





























Key Takeaways
- Diagram software is a growing global market: Industry forecasts point to sustained expansion through the next decade, supported by enterprise digitization, cloud adoption, and visual collaboration.
- AI and cloud collaboration are reshaping diagramming: Cloud deployment represented 58.4% of the market in 2024, while AI-powered diagram generation and automation are becoming increasingly important product capabilities.
- Enterprise adoption is strong, while Asia-Pacific offers major growth potential: Large enterprises accounted for more than 61% of the market in 2025, while Asia-Pacific is the fastest-growing region at more than 12% CAGR in some estimates.
Diagram software is expanding rapidly in 2026 as businesses adopt cloud collaboration, AI-powered diagram generation, and visual workflow tools. Market forecasts show continued growth through the next decade, while enterprise adoption and demand for real-time collaboration are strengthening diagramming software’s role in modern digital workplaces.
Diagram software has evolved far beyond basic flowcharts and organizational charts. In 2026, businesses, IT teams, developers, educators, and remote workforces increasingly use diagramming tools to visualize complex processes, document infrastructure, map workflows, design systems, communicate ideas, and collaborate in real time. As cloud adoption and artificial intelligence reshape workplace software, diagramming platforms are becoming an increasingly important part of the enterprise technology stack.

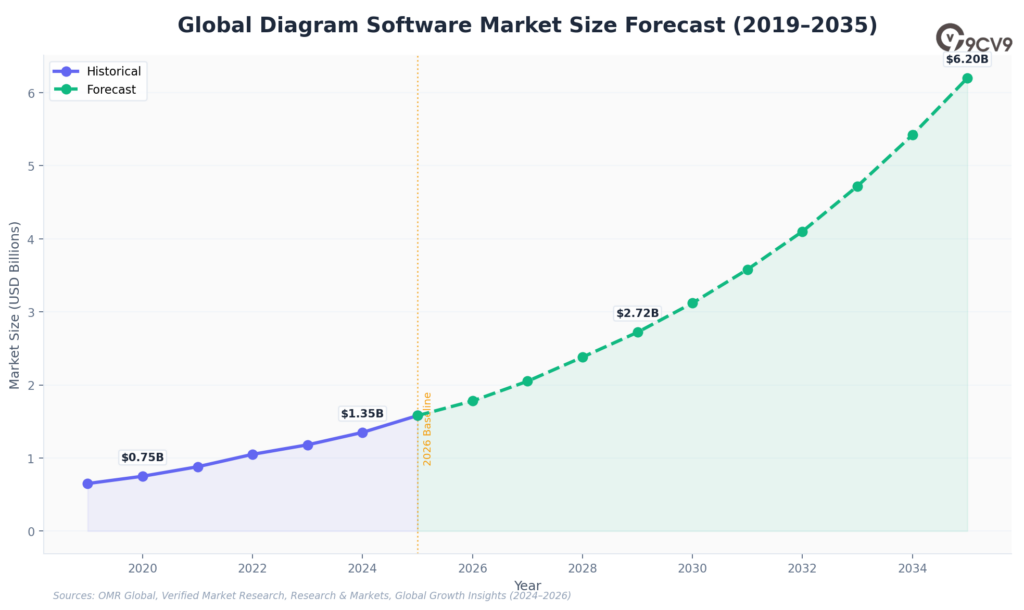
The diagram software market is also expanding rapidly. Verified Market Research valued the global market at $843.92 million in 2024 and projects it to reach $1.78 billion by 2032 at a 9.8% CAGR. Research & Markets provides a higher estimate, placing the diagramming software market at approximately $1 billion in 2024, $1.13 billion in 2025, and a projected $1.82 billion by 2029. Differences between estimates largely reflect varying definitions of diagramming, visual collaboration, workflow, and related software categories.
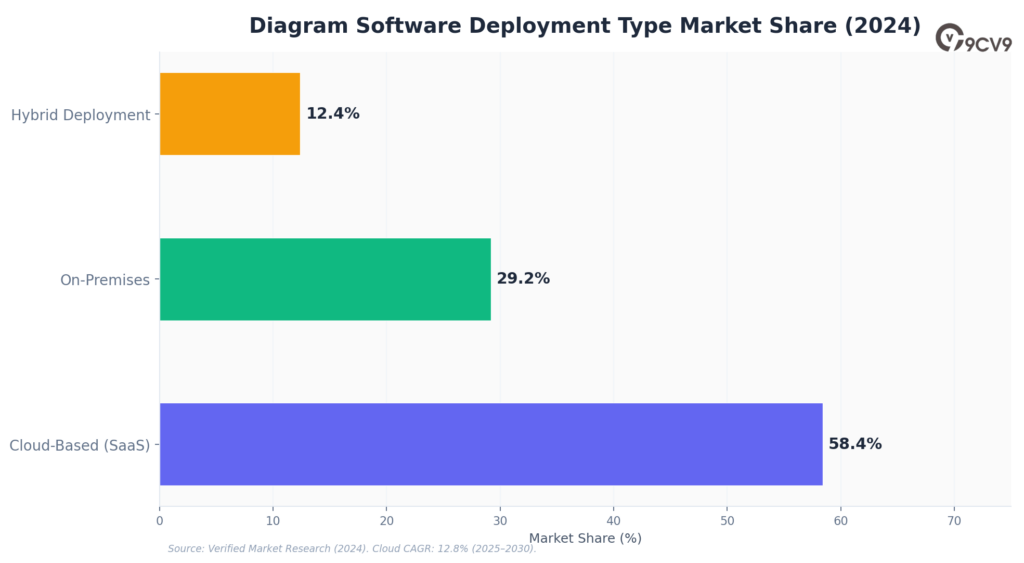
Cloud-based diagram software is playing a particularly important role in this growth. Cloud deployment accounted for 58.4% of the market in 2024, while 66% of enterprises reportedly prefer real-time collaboration capabilities in their diagramming tools. Large enterprises represented more than 61% of the market in 2025, while 67% of U.S. enterprises have incorporated visual diagramming tools into their operations. SMEs are emerging as another major growth opportunity, with their segment projected to expand at a 12.7% CAGR through 2032.

Artificial intelligence is accelerating the transformation.
According to the statistics compiled for this report, 82% of business leaders had used AI-powered tools for visual content production, while 90% agreed that generative AI improved the quality of visual communication.
Diagramming platforms are responding with capabilities such as text-to-diagram generation, automatic workflow creation, AI-assisted process mapping, and integrations with other AI-powered enterprise tools.
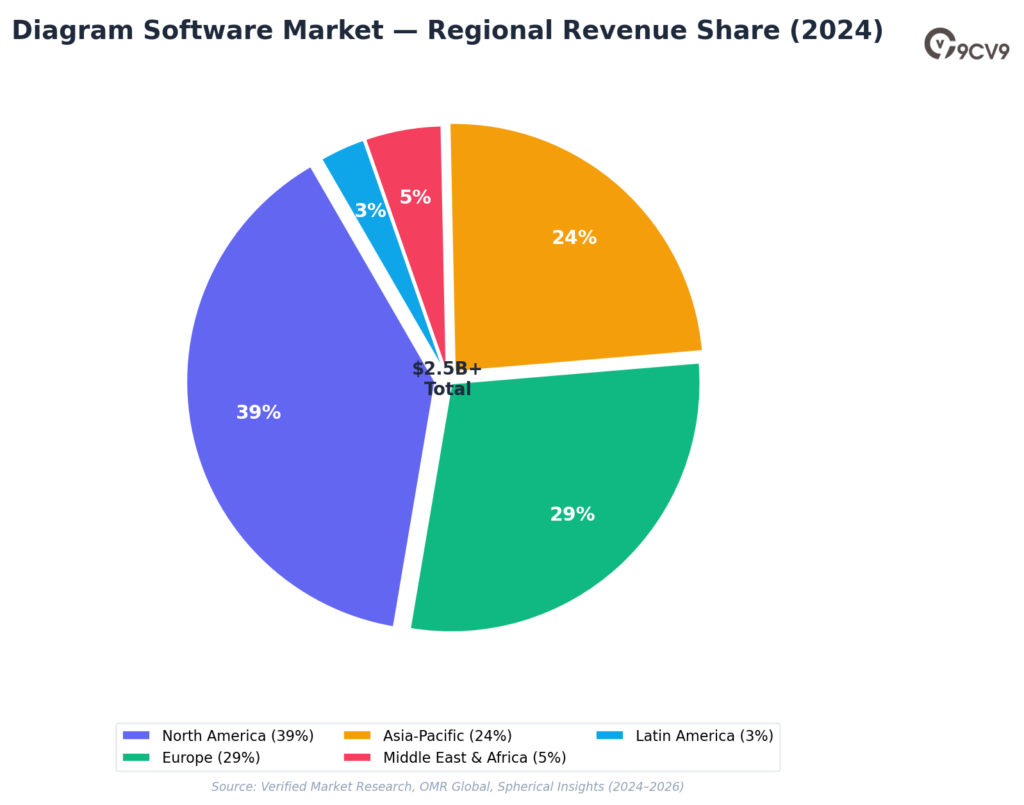
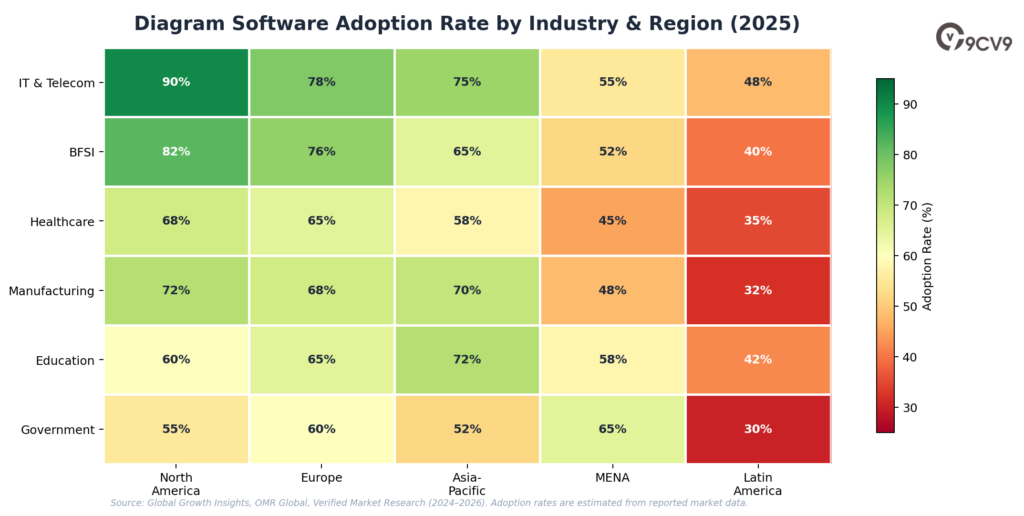
Regional trends reveal another important shift. North America remains the largest diagram software market, accounting for roughly 38%–40% of global revenue, while Europe represents around 29%. Asia-Pacific holds approximately 24% but is growing at more than 12% annually in some estimates, making it the fastest-growing region and an increasingly important opportunity for diagram software providers.
Competition is also intensifying among established diagramming and visual collaboration platforms. Miro reportedly has more than 65 million users and 130,000 paying customers, while 99% of Fortune 100 companies use the platform. Microsoft Visio, Lucidchart, draw.io and other established tools continue to compete across enterprise diagramming, technical documentation, workflow visualization, network diagrams, and collaborative workspaces.
The following 105 diagram software statistics, data points, and trends for 2026 provide a comprehensive look at the industry’s market size, growth forecasts, cloud adoption, enterprise usage, AI transformation, regional trends, competitive landscape, collaboration patterns, network diagram software, and changing user behavior.
Together, these statistics reveal where the diagram software industry stands in 2026 and where the market could be heading over the remainder of the decade.
Before we venture further into this article, we would like to share who we are and what we do.
About 9cv9
9cv9 is a business tech startup based in Singapore and Asia, with a strong presence all over the world.
With over ten years of startup and business experience, and being highly involved in connecting with thousands of companies and startups, the 9cv9 team has listed some important and crucial software tools in this review.
If you like to get your company listed in our top B2B software reviews, check out our world-class 9cv9 Media and PR service and pricing plans here.
Top 105 Diagram Software Statistics, Data & Trends in 2026
🏪 MARKET SIZE & VALUATION
- $843.92 million — Global diagram software market value in 2024 (Verified Market Research). The diagram software sector crossed the $800M threshold in 2024, signaling its transition from niche tool to mainstream enterprise infrastructure.
- $1.78 billion — Projected market value by 2032 at a 9.8% CAGR (Verified Market Research). With nearly a 2x growth trajectory over eight years, diagram software is firmly in the high-growth enterprise SaaS category.
- $1 billion — Diagramming software market in 2024 (Research & Markets). Multiple independent analysts corroborate the $1B baseline, reinforcing the reliability of this market’s size estimate.
- $1.13 billion — Diagramming software market in 2025 at 12.8% CAGR (Research & Markets). The jump from $1B to $1.13B in a single year reflects accelerating post-pandemic digitization and hybrid work normalization.
- $1.82 billion — Market projection for 2029, growing at 12.6% CAGR (Research & Markets). Sustained double-digit CAGR through the decade confirms diagramming tools as a durable enterprise investment.
- $2.38 billion — Estimated market value in 2022 (Cognitive Market Research). The 2022 baseline anchors the growth story: the market has more than doubled in just three years.
- $2.5 billion — Diagramming software market value in 2025 (OMR Global). OMR’s higher estimate reflects inclusion of broader visual collaboration tools alongside pure diagramming platforms.
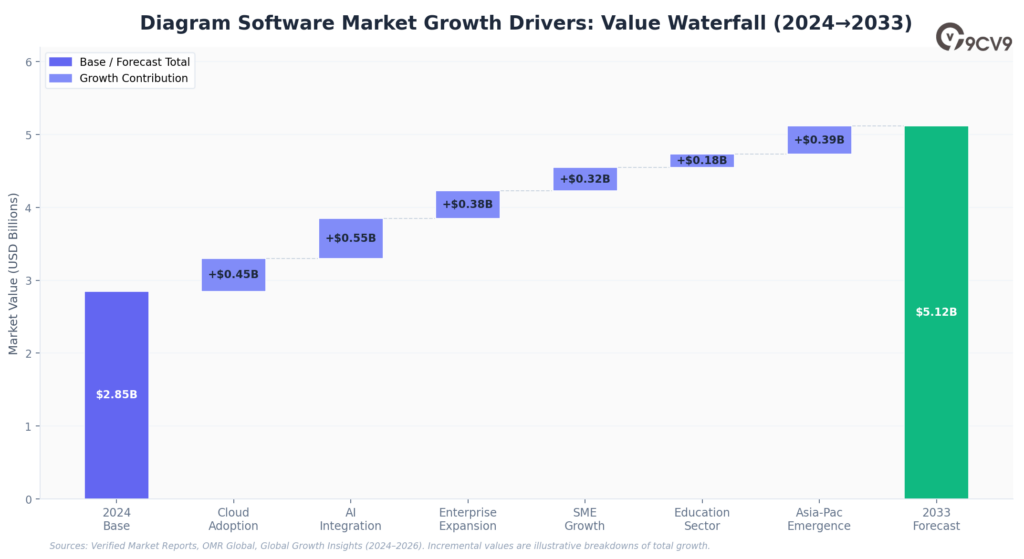
- $2.85 billion — Diagram software market revenue in 2024 (Verified Market Reports). Broader market definitions incorporating flowchart, BPM, and network diagram tools push the total well above $2.5B.
- $5.12 billion — Market revenue projected by 2033 at 7.4% CAGR (Verified Market Reports). Even at conservative growth rates, the market is forecast to nearly double by the early 2030s.
- $5.48 billion — Market projection for 2030 at 11% CAGR from a 2022 base (Cognitive Market Research). Aggressive AI-driven growth scenarios see the market approaching $5.5B within the decade.
- $6.8 billion — Diagramming software market forecast for 2035 at 10.5% CAGR (OMR Global, April 2026). OMR’s 2035 forecast is the most bullish long-range estimate, driven by AI-native diagramming workflows becoming standard.
- $7.1 billion — Online diagram software sub-segment projection for 2031 at 8.5% CAGR (Market Research Intellect). The online-only sub-segment is set to exceed $7B, confirming browser-based tools’ dominance over desktop incumbents.
- $780.32 million — Global diagramming software market size in 2024, per Global Growth Insights. This conservative estimate reflects strict market boundaries excluding broad collaboration suites like Miro.
- $842.75 million — Projected 2025 market value per Global Growth Insights ($1.56B by 2033 at 8% CAGR). Even lower-bound forecasts project a near-doubling over eight years.
- $1,559.87 million — 2033 market forecast at 8% CAGR from Global Growth Insights. The most conservative long-range projection still shows a 2x expansion, underscoring structural demand.
☁️ DEPLOYMENT & CLOUD
- 58.4% — Cloud deployment market share in 2024 (Verified Market Research). More than half the diagram software market has already migrated to cloud-based SaaS, reflecting enterprise-wide digital transformation.
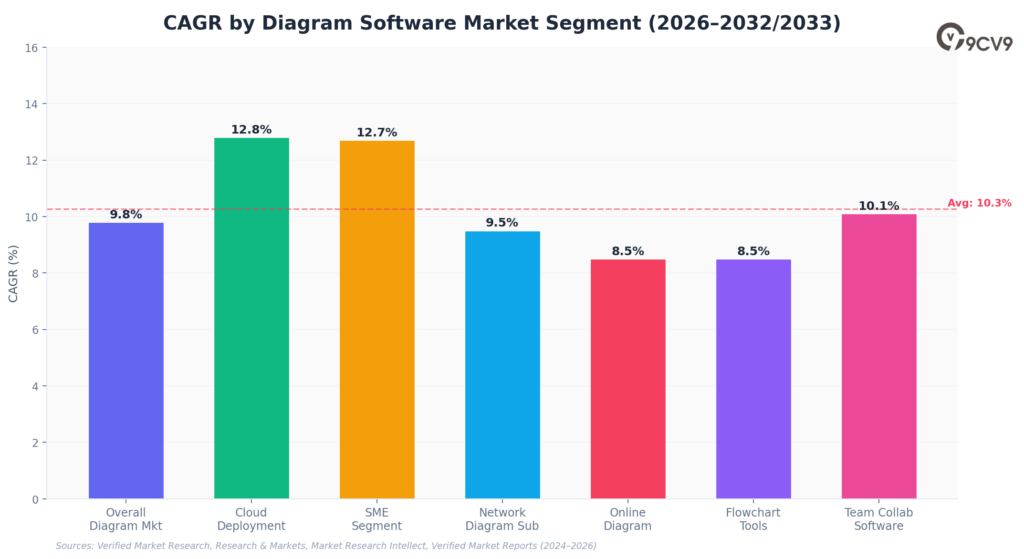
- 12.8% — Projected CAGR for cloud deployment sub-segment through 2030 (Verified Market Research). Cloud is growing nearly twice as fast as the overall market, cementing SaaS as the dominant delivery model.
- 59%+ — Proportion of enterprises shifting toward cloud-integrated diagramming platforms (Global Growth Insights). The majority of enterprises now source their diagramming capabilities from cloud platforms rather than on-premise solutions.
- 66% — Enterprises preferring real-time collaboration features in diagramming tools (Global Growth Insights). Two-thirds of the market considers real-time co-editing non-negotiable — a feature only feasible at scale in cloud environments.
- 29.2% — Estimated on-premises diagram software market share in 2024. On-premise still commands nearly 30% of revenues, particularly in regulated industries like government, healthcare, and financial services.
- 12.4% — Hybrid deployment market share in 2024. Hybrid models serve organizations needing cloud collaboration capabilities alongside on-premises data governance requirements.
- $31.62 billion → $68.20 billion — Team collaboration software market growing from 2026 to 2034 at 10.1% CAGR (Fortune Business Insights). Diagram tools are a critical component of the broader collaboration market, which is set to more than double over eight years.
🏢 ENTERPRISE ADOPTION
- 61%+ — Large enterprise market share in 2025 (Verified Market Research). Large organizations continue to dominate diagram software spending, driven by complex architecture visualization, compliance documentation, and AI integration.
- 58% — Fortune 500 companies integrating diagramming platforms into core enterprise systems (Verified Market Research). A majority of the world’s largest companies now treat visual diagramming as mission-critical infrastructure, not optional software.
- 62% — Corporate segment revenue share in 2025 (Verified Market Research). Businesses are the overwhelmingly dominant revenue source, dwarfing education and personal use categories.
- 67% — US enterprises that have incorporated visual diagramming tools (Global Growth Insights). Nearly 7 in 10 US enterprises use some form of diagramming software, reflecting how central visual communication has become to American business operations.
- 44% — US diagram software adoption driven by hybrid work environments (Global Growth Insights). Hybrid work is not just a driver — it’s nearly the single largest adoption catalyst in the world’s biggest diagram software market.
- 12.7% — Projected CAGR for the SME segment through 2032 (Verified Market Research). SMEs are growing faster than large enterprises in diagramming tool adoption, fueled by affordable cloud-based freemium options.
- 51%+ — DevOps teams using integrated diagramming tools within Jira/GitHub workflows (Global Growth Insights, Gliffy integration data). More than half of software engineering teams have embedded diagrams directly into their development toolchain.
- 47% — Average productivity increase reported by enterprises adopting AI-powered diagramming tools (Global Growth Insights). AI-enhanced diagramming delivers nearly a 50% productivity uplift — a compelling ROI for enterprise technology budgets.
- 48% — Enterprises reporting legacy system compatibility as a major adoption barrier (Global Growth Insights). Nearly half of enterprises face integration friction that slows their migration to modern cloud-based diagramming platforms.
- 36% — Time lost in manual workflows cited by enterprises as a key pain point (Global Growth Insights). More than a third of enterprise productivity is consumed by inefficient manual processes that visual workflow tools can directly address.
- 24% — Education sector’s share of diagram software market in 2024 (Verified Market Research). Educational institutions are the second-largest user segment, as hybrid learning drives rapid uptake of visual collaboration tools in classrooms.
- 33% — Emerging market users who adopted Lucidchart’s offline functionality (Global Growth Insights). Offline access is a meaningful differentiator in regions with inconsistent connectivity, expanding the addressable market significantly.
- 38% — Increase in diagramming tool usage in remote work environments after offline features were introduced (Global Growth Insights). Offline capability isn’t just a convenience — it demonstrably expands active usage, particularly in public sector and education.
🌍 REGIONAL MARKET
- 38–40% — North America’s share of global diagram software revenues (Verified Market Research, Spherical Insights). North America is the undisputed largest region, anchored by mature enterprise cloud adoption and a high concentration of Fortune 500 companies.
- 29% — Europe’s share of diagramming software revenues (Global Growth Insights). Europe’s strong market position is driven by GDPR compliance requirements that mandate documented process maps, creating organic demand for diagramming tools.
- 24% — Asia-Pacific’s market share, with 12%+ CAGR — the fastest-growing region (Global Growth Insights, Spherical Insights). Asia-Pacific’s accelerating growth reflects massive digital transformation programs in India, China, and Southeast Asia.
- 9% — Middle East & Africa’s market share (Global Growth Insights). Gulf Cooperation Council nations are driving MEA adoption through national digital transformation agendas like Saudi Vision 2030 and UAE’s Digital Economy Strategy.
- >12% — Asia-Pacific CAGR, the highest of all regions (Spherical Insights, April 2026). No region is growing faster than Asia-Pacific — India’s Business Reforms Action Plan and China’s cloud infrastructure boom are key catalysts.
- 40% — North America’s share of the flowchart and diagramming tools market in 2024 (Spherical Insights). North America not only leads in market share but has also been the first adopter of AI-powered diagramming capabilities.
🏆 COMPETITIVE LANDSCAPE
- 65 million+ — Miro’s total user base in 2026 (Miro.com). Miro has cemented itself as the world’s most widely used collaborative visual workspace, growing from 35M users through continued enterprise and consumer expansion.
- 100 million+ — Miro’s claimed cumulative user interactions across 250,000 customers (GetApp, 2026). The platform’s penetration across 250,000 paying organizations signals enterprise lock-in at a scale few SaaS companies achieve.
- $665 million — Miro’s estimated annual recurring revenue in 2024 (Sacra). Miro’s revenue trajectory from $5M ARR in 2018 to $665M in 2024 is one of the most remarkable growth stories in enterprise SaaS history.
- 5.6% — Miro’s ARR growth rate in 2024 (~$630M to $665M YoY) (Sacra). Growth has normalized from hypergrowth to steady enterprise expansion, consistent with market maturation and competitive pressure.
- 99% — Fortune 100 companies that use Miro (Sacra, Miro.com). Essentially universal penetration of the Fortune 100 makes Miro the de facto standard for enterprise visual collaboration — an extraordinary competitive moat.
- 130,000 — Miro’s paying customer count (Sacra). With 130K paying customers and 65M+ users, Miro’s freemium-to-enterprise conversion model is highly effective at monetizing viral word-of-mouth adoption.
- 4.81/5 — Miro’s average user rating on G2 and TrustRadius, ranked #1 of 105 diagramming tools (Miro.com). An industry-leading rating across 105 competing tools confirms Miro’s user experience superiority in the marketplace.
- 4.59/5 — Lucidchart’s average user rating on third-party review platforms (Miro.com). Lucidchart maintains the second-highest rating in the category, positioning it as the premium alternative for structured, process-focused diagramming.
- 67% — More 5-star reviews Miro receives compared to Lucidchart (Miro.com). Miro’s user satisfaction lead is not marginal — it receives two-thirds more top ratings than its closest direct competitor.
- ~2x — Miro’s estimated NPS score relative to Lucidchart (Miro.com). A near-double Net Promoter Score signals dramatically higher user loyalty, which translates to lower churn and stronger organic growth.
- 130+ — Native application integrations offered by Miro (Miro.com). Miro’s 130+ integrations — double Lucidchart’s — create powerful network effects by embedding the platform in every corner of the enterprise tech stack.
- 2,500+ — User-created templates in Miro’s Miroverse community gallery (Miro.com). A community-driven template library of 2,500+ resources creates a moat that proprietary tools cannot replicate without open ecosystems.
- 3.37% — Microsoft Visio’s market share in the graphics/design tools category (Enlyft). While seemingly small, Visio’s share is amplified by Microsoft 365 bundling, making it ubiquitous in large corporate environments despite modest standalone adoption.
- $300/user/year — Miro’s enterprise pricing ceiling (Sacra). At up to $300 per user annually, Miro’s enterprise tier is competitively priced against Lucidchart and Microsoft Visio while offering broader collaboration functionality.
- 10+ — New Azure stencils and Kubernetes shapes added to Visio in 2024 (Market Research Intellect). Microsoft’s investment in cloud-native diagramming shapes reflects a strategic pivot to serve the growing cloud architecture documentation market.
🤖 AI & INNOVATION
- 90% — Business leaders who agree generative AI improved visual communication quality (Canva Visual Economy Report 2024). Near-universal consensus on AI’s visual quality improvement signals that AI-enhanced diagramming will become a baseline expectation, not a premium feature.
- 82% — Business leaders who used AI-powered tools for visual content production in the past year (Canva Visual Economy Report 2024). AI-assisted visual creation has crossed the mainstream threshold — diagram tools without AI are increasingly perceived as legacy products.
- 77% — Business leaders reporting visual communication increased business performance (Canva Visual Economy Report 2024). The business case for visual tools is now statistically proven at scale: three-quarters of leaders can directly attribute performance gains to visual communication.
- 78% — Enterprise AI adoption rate in 2025 (Fullview.io, 2025 AI statistics roundup). With nearly 4 in 5 enterprises running AI initiatives, demand for AI-native diagramming tools is on a steep upward trajectory.
- $3.70 — Average ROI per dollar invested in AI tools across enterprises (Fullview.io). The strong ROI of AI investments validates enterprise budget allocation for AI-enhanced diagramming platforms.
- 26%–55% — Productivity gains delivered by enterprise AI tools (Fullview.io). The wide range reflects variation by use case, but even the lower bound of 26% productivity improvement makes AI diagramming tools highly compelling for enterprise buyers.
- 40% — Performance boost for workers using generative AI tools versus those without (ArtSmart.ai/McKinsey). A 40% performance differential creates strong individual motivation to adopt AI-powered diagramming tools, driving bottom-up adoption.
- 26.4% — Proportion of workers using generative AI at work in H2 2024 (Penn Wharton Budget Model, Bick et al. 2025). Generative AI adoption for work tasks tracks similarly to PC adoption in the early 1980s — a signal of transformative but still-early-stage diffusion.
- 5.0 — Average generative AI use cases per company by December 2024, up from 2.5 in October 2023 (Bain/SEO Sherpa). Companies that successfully adopt one AI use case rapidly expand to others — diagram auto-generation is a natural second or third use case after writing and coding.
- November 2025 — Lucid Software launched AI-based diagram generation from text inputs (OMR Global, April 2026). Lucidchart’s text-to-diagram feature represents a fundamental UX shift: non-technical users can now create professional flowcharts without drag-and-drop expertise.
- March 2026 — Miro introduced automatic Kanban generation and integrations with Glean and Google Chat (OMR Global, April 2026). Miro’s AI roadmap in 2026 focuses on reducing diagram creation time from hours to seconds through intelligent auto-generation.
- 30%–50% — Productivity gains documented across business processes from enterprise AI implementation (PhilArchive, Q1 2025 Generative AI Business Applications study). Process automation via AI delivers the highest productivity gains — and diagramming software is a key enabler of visualizing and optimizing those automated workflows.
📈 GROWTH DRIVERS & USE CASES
- $14 billion — Visual communication tools market expected size by 2025 (Verified Market Reports). The broader visual communication ecosystem — of which diagram software is a core pillar — represents a $14B total addressable market.
- $61.13 billion — Industrial process automation market value in 2023, growing 5.4% from $58B in 2022 (Flair HR, Feb 2024). Diagramming software is integral to designing, documenting, and communicating industrial automation workflows.
- 47% — IT leaders identifying operations as the primary source of ROI from process automation (Salesforce, December 2023). Operational automation is the #1 driver of ROI — and diagramming tools are essential for mapping and communicating these automated processes.
- 54% — Growth in diagramming tools integrated with project management platforms (Global Growth Insights). More than half again more integrations between PM and diagramming platforms reflect the blurring boundary between task management and visual workflow design.
- 33% — Rise in educational sector diagram tool usage (Global Growth Insights). Education’s role as a growth segment is underappreciated — as universities adopt hybrid curricula, visual learning tools are becoming standard classroom infrastructure.
- 45% — Adoption increase in non-English markets after MyDraw added 12 languages in 2024 (Global Growth Insights). Language localization is a powerful and underutilized growth lever in diagram software — non-English markets represent a largely untapped opportunity.
- 29% — Rise in real-time diagram sharing after Gliffy integrated with GitHub and Jira (Global Growth Insights). Platform integrations directly drive adoption metrics — the Gliffy case demonstrates that where users work, their diagrams should be too.
- $58 billion — Process automation market in 2022 (Flair HR). Process automation and diagramming software are deeply interlinked — as automation grows, so does the need for visual tools to design, document, and communicate those workflows.
- $45 billion — Enterprise collaboration software market projected size by 2025 (Sacra). The broader collaboration market provides a rising tide for all visual workspace tools, including dedicated diagramming platforms.
🔗 NETWORK DIAGRAM SUB-MARKET
- $1.2 billion — Network diagram software market value in 2024 (Market Research Intellect). The network diagramming sub-segment represents a significant and specialized slice of the overall market, driven by IT infrastructure complexity.
- $2.5 billion — Network diagram software forecast for 2033 at 9.5% CAGR (Market Research Intellect). Network diagram software is growing faster than the overall software market, reflecting the explosion in cloud, hybrid, and distributed network architectures.
- $2.5 billion — Network diagram market size in 2025 (Data Insights Market). Multiple sources confirm the network segment has crossed the $2.5B threshold in 2025, validating its status as a significant standalone market.
- $7.2 billion — Network diagram software projected value by 2033 at 12% CAGR (Data Insights Market). The most bullish network diagram estimate sees the sub-market reaching $7.2B — driven by cloud, virtualization, and remote operations management.
- 9.5% — CAGR for network diagram software 2026–2033 (Market Research Intellect). Network diagramming is growing at nearly 10% annually as IT teams need increasingly sophisticated tools to document and manage sprawling cloud architectures.
🤝 COLLABORATION & REMOTE WORK
- $31.62B → $68.20B — Team collaboration software market growing from 2026 to 2034 (Fortune Business Insights via Cake.com). The collaboration market is set to more than double — diagram tools ride this wave as essential components of visual teamwork infrastructure.
- 54% — Employees who believe inefficient processes are hindering collaboration (McLean & Company, 2025). A majority of employees cite process inefficiency as a collaboration barrier — precisely the pain point that well-implemented diagramming tools address.
- 49% — Employees attributing collaboration challenges to complex organizational structures (McLean & Company, 2025). Org charts and system diagrams are among the most accessed diagram types in enterprise settings, addressing this structural complexity challenge.
- 25 hours/week — Time employees spend on meetings, including 15 hours on preparation (Zoom/Deloitte, 2025). Visual collaboration tools and diagram-based communication can dramatically reduce meeting prep time by creating shared visual context before calls begin.
- 56% — Employees who feel meeting time is simply wasted (Project.co, 2026). More than half the workforce sees meetings as unproductive — diagram-based async communication offers a compelling alternative to unnecessary synchronous meetings.
- 69% — Employees who know what others in their team are working on when using project management tools (Project.co). Visual workflow tools that integrate with project management systems dramatically improve team visibility and coordination.
- 16% — Increase in meetings after 8 PM due to global and flexible teams (Microsoft Work Trend Index 2025). Cross-time zone collaboration demands asynchronous visual tools — diagram software enables effective communication without requiring simultaneous availability.
- 117 emails/day — Average daily emails received by employees (Microsoft Work Trend Index 2025). Diagram-based visual communication can replace lengthy email threads, reducing information overload while improving comprehension and retention.
💡 KEY PRODUCT FEATURES & DIFFERENTIATORS
- 2025 — draw.io has been available since 2005, making it one of the longest-standing browser-based diagramming tools (Miro/draw.io partnership announcement). draw.io’s 20-year track record demonstrates that open-source, no-login diagramming tools address a permanent and durable market need.
- $15/month — draw.io’s starting cloud price for teams of 20 users (Gleek.io). At $0.75/user/month, draw.io offers one of the most price-competitive team diagramming solutions, making it the default choice for budget-conscious teams.
- $450+/month — draw.io enterprise pricing for up to 2,500 users (Gleek.io). Even at enterprise scale, draw.io remains significantly cheaper than competitors like Lucidchart or Visio, driving SME and startup adoption.
- 2,500 max users — draw.io account size ceiling for the cloud product (Gleek.io). draw.io’s user cap reflects its positioning as a mid-market solution, leaving large enterprise deals to Lucidchart, Miro, and Visio.
- 60%+ — Percentage of GDP that digital technologies contribute globally (World Bank, cited in OMR Global 2026). Digital tools including diagram software are embedded in the infrastructure of the global economy, supporting sustained long-term demand.
- 12% — Projected CAGR for Asia-Pacific diagramming tool adoption, the highest of all regions (Spherical Insights). Asia-Pacific’s digital transformation pace is unmatched globally — diagram software vendors who localize for this region stand to capture outsized growth.
📊 ADOPTION & BEHAVIORAL STATISTICS
- 77% — Business performance improvement reported from visual communication adoption (Canva, 2024). The business case for visual communication tools is now empirically strong — nearly 8 in 10 leaders report measurable performance gains.
- $408 billion — Productivity software total addressable market that Miro competes within (Sacra). By expanding beyond diagramming into a full visual productivity suite, Miro positions itself for a slice of the $408B productivity software market.
- 2.9% — Annual labor productivity growth attributable to AI adoption in the US (ArtSmart.ai). AI-driven productivity gains compound over time — diagram tools with AI capabilities contribute directly to this structural productivity improvement.
- 10%+ — Annual revenue increase for organizations providing AI-based tools and training (ArtSmart.ai). Companies that invest in AI-powered tools including diagramming platforms generate measurable top-line revenue improvements.
- 44% — Companies deploying or assessing AI agents in H2 2025 (NVIDIA State of AI Report 2026). AI agents are becoming integral to enterprise workflows — and diagramming tools are increasingly the visual layer through which these agents are designed and documented.
- 48% — Telecommunications companies leading AI agent adoption at 48%, followed by retail at 47% (NVIDIA, 2026). High-complexity industries with intricate system architectures are the fastest adopters of AI tools — including AI-powered diagramming for network and process visualization.
- 231 apps — Average number of apps used by large companies (2,000+ employees) per Okta’s 2024 Businesses at Work report. With enterprises using 200+ applications, diagram tools that integrate into existing tech stacks have a decisive advantage over standalone solutions.
- $109.1 billion — US private AI investment in 2024 (Qualtrics, 2026). The scale of AI investment is fueling rapid development of AI-native features in diagramming software, accelerating capability improvements across the category.
- 3 out of 4 — Companies regularly using AI for at least one function in 2025 (Qualtrics). Near-universal enterprise AI adoption creates fertile ground for AI-enhanced diagramming tools — non-AI alternatives risk being perceived as outdated.
Conclusion
The diagram software industry is entering a new phase of growth and innovation in 2026. What began primarily as software for creating flowcharts, organizational charts, and technical diagrams has developed into a broader ecosystem of cloud-based visual collaboration, process mapping, system design, network documentation, and AI-assisted productivity tools.
The 105 diagram software statistics examined in this report demonstrate the scale of that transition. Verified Market Research valued the global diagram software market at $843.92 million in 2024 and projects it to reach $1.78 billion by 2032 at a 9.8% CAGR. Other research firms use broader market definitions and consequently produce substantially larger estimates, but the overall trend remains consistent: diagramming software demand is expected to expand significantly throughout the decade.
Cloud adoption, enterprise digitization, and distributed work are among the strongest forces shaping the market. Cloud deployment represented 58.4% of the diagram software market in 2024, while 66% of enterprises reportedly prefer real-time collaboration features. Large enterprises accounted for more than 61% of the market in 2025, yet SMEs are becoming an increasingly important growth segment, with a projected CAGR of 12.7% through 2032.
Artificial intelligence could accelerate this transformation further. The research shows that 82% of business leaders had used AI-powered tools for visual content production, while 90% agreed that generative AI improved visual communication quality. As diagram software providers introduce text-to-diagram generation, automated workflows, AI-assisted visualization, and deeper integrations with enterprise applications, creating complex diagrams could become faster and accessible to a much wider group of users.
Geographically, North America remains the largest market with approximately 38%–40% of global diagram software revenue, while Asia-Pacific represents around 24% and is growing at more than 12% annually in some estimates. This combination of mature enterprise demand in North America and rapid digital transformation across Asia-Pacific suggests that the industry’s next stage of expansion will be increasingly global.
Ultimately, the most important diagram software trend in 2026 is the shift from simply drawing diagrams to using visual platforms as collaborative business infrastructure. With enterprises managing an average of 231 applications, growing AI adoption, increasingly distributed teams, and more complex digital systems, organizations need effective ways to visualize how people, processes, applications, networks, and information connect.
These 105 diagram software statistics, data points, and trends for 2026 indicate that cloud collaboration, AI-powered diagram generation, enterprise integrations, process automation, and Asia-Pacific expansion are likely to remain important forces shaping the market. For businesses evaluating diagram software, vendors competing in the category, and technology professionals tracking workplace trends, the data points toward a market that is becoming more collaborative, intelligent, integrated, and strategically important.
If you find this article useful, why not share it with your hiring manager and C-level suite friends and also leave a nice comment below?
We, at the 9cv9 Research Team, strive to bring the latest and most meaningful data, guides, and statistics to your doorstep.
To get access to top-quality guides, click over to 9cv9 Blog.
To hire top talents using our modern AI-powered recruitment agency, find out more at 9cv9 Modern AI-Powered Recruitment Agency.
People Also Ask
What is the diagram software market size in 2026?
Market estimates vary by definition. Research cited in this report places the market from under $1 billion to several billion dollars, depending on whether broader visual collaboration and workflow tools are included.
How fast is the diagram software market growing?
Major forecasts indicate sustained growth. Verified Market Research projects a 9.8% CAGR through 2032, while Research & Markets estimates growth of about 12.6% through 2029.
How large could the diagram software market become by 2032?
Verified Market Research forecasts the global diagram software market will reach approximately $1.78 billion by 2032, up from $843.92 million in 2024.
What are the biggest diagram software trends in 2026?
Key trends include AI-powered diagram generation, cloud deployment, real-time collaboration, enterprise integrations, process automation and growing adoption across Asia-Pacific.
How important is cloud-based diagram software?
Cloud deployment represented 58.4% of the diagram software market in 2024, making cloud platforms a major part of the industry’s shift toward collaborative SaaS tools.
What percentage of enterprises prefer real-time diagram collaboration?
About 66% of enterprises reportedly prefer real-time collaboration features in diagramming tools, highlighting the growing importance of simultaneous editing and visual teamwork.
How popular is diagram software among US enterprises?
Around 67% of US enterprises have incorporated visual diagramming tools, according to statistics compiled in this report. Hybrid work is also identified as an important adoption driver.
Are large enterprises the biggest users of diagram software?
Yes. Large enterprises accounted for more than 61% of the diagram software market in 2025, driven by needs such as architecture visualization, documentation and integrations.
Is diagram software adoption growing among small businesses?
Yes. The SME segment is projected to grow at a 12.7% CAGR through 2032, supported by affordable cloud platforms and freemium diagramming solutions.
How is AI changing diagram software in 2026?
AI is enabling text-to-diagram generation, automated workflows and faster visual content creation. These capabilities can reduce the manual work required to produce diagrams and process maps.
How many business leaders use AI for visual content creation?
About 82% of business leaders reported using AI-powered tools for visual content production, according to Canva’s Visual Economy Report statistics cited in the research.
Does generative AI improve visual communication?
Around 90% of business leaders agreed that generative AI improved visual communication quality, indicating strong demand for AI-assisted capabilities within visual software.
Can AI-powered diagram software improve productivity?
The compiled research reports a 47% average productivity increase among enterprises adopting AI-powered diagramming tools, although results can vary significantly by organization and use case.
Which region has the largest diagram software market?
North America is the largest regional market, representing approximately 38%–40% of global diagram software revenue according to estimates included in the research.
What is Europe’s share of the diagram software market?
Europe accounts for approximately 29% of diagramming software revenue in one estimate, making it another major regional market behind North America.
Which region is growing fastest for diagram software?
Asia-Pacific is identified as the fastest-growing region, with growth exceeding 12% CAGR in some estimates as digital transformation accelerates across the region.
What is Asia-Pacific’s share of the diagram software market?
Asia-Pacific represents approximately 24% of the market according to research cited in the report, with its growth rate exceeding that of other major regions.
How many people use Miro?
Miro reportedly has more than 65 million users, making it one of the largest visual collaboration and diagramming platforms covered by the research.
How many paying customers does Miro have?
Miro reportedly has approximately 130,000 paying customers, demonstrating substantial commercial adoption alongside its much larger overall user base.
How widely is Miro used by Fortune 100 companies?
The research states that 99% of Fortune 100 companies use Miro, illustrating the platform’s strong penetration among the world’s largest enterprises.
How many integrations does Miro offer?
Miro offers more than 130 native application integrations, helping organizations connect visual collaboration with other applications across their technology stacks.
How large is the network diagram software market?
One estimate values network diagram software at $1.2 billion in 2024, with the market projected to reach $2.5 billion by 2033 at a 9.5% CAGR.
Why is network diagram software growing?
Growth is being supported by increasingly complex cloud, hybrid and distributed IT infrastructures that require teams to visualize, document and manage network architectures.
How does remote work affect diagram software adoption?
Remote and hybrid work increases demand for shared visual workspaces, real-time editing and asynchronous communication, making collaborative diagramming tools more useful to distributed teams.
Why do businesses use diagram software?
Businesses use diagram software to visualize workflows, document systems, map processes, communicate ideas, create organizational structures and improve collaboration across teams.
How important is diagram software for DevOps teams?
More than 51% of DevOps teams reportedly use integrated diagramming tools within Jira or GitHub workflows, demonstrating their role in software development and technical documentation.
What are the main barriers to diagram software adoption?
Legacy compatibility is a significant challenge. About 48% of enterprises reportedly identify compatibility with legacy systems as a major barrier to adopting modern diagramming platforms.
How important is visual communication to business performance?
Around 77% of business leaders reported that visual communication increased business performance, supporting the business case for diagramming and other visual communication tools.
What features matter most in diagram software in 2026?
Important capabilities include cloud access, real-time collaboration, AI generation, templates, integrations, workflow visualization, offline access and enterprise-grade documentation features.
What is the future of diagram software beyond 2026?
The data points toward continued growth driven by AI, cloud collaboration, automation, enterprise integrations and Asia-Pacific adoption, with several forecasts predicting substantial expansion through the 2030s.
Sources
Verified Market Research Research & Markets OMR Global Global Growth Insights Cognitive Market Research Verified Market Reports Market Research Intellect Data Insights Market Sacra Miro Enlyft Spherical Insights OpenPR Canva Newsroom Fullview ArtSmart Qualtrics NVIDIA Penn Wharton Budget Model Cake Gleek Fortune Business Insights Salesforce Flair HR Okta Microsoft Work Trend Index McLean & Company