


























Key Takeaways
- The best Gantt chart software in 2026 combines visual project scheduling with task dependencies, critical path analysis, baselines, resource management, and automation.
- Leading Gantt chart tools such as Smartsheet, Microsoft Project, monday.com, ClickUp, Asana, and Primavera P6 serve different needs, from small teams to complex enterprise projects.
- Choosing the right Gantt chart software requires comparing pricing, ease of use, collaboration, scheduling depth, integrations, workload planning, and portfolio management capabilities.
Smartsheet leads the best Gantt chart software in 2026 for organizations seeking visual project scheduling, task dependencies, critical path tracking, baselines, automation, resource management, and enterprise collaboration. The best choice ultimately depends on project complexity, team size, budget, scheduling requirements, and the level of portfolio management required.
Gantt charts remain one of the most effective ways to plan, visualize, and control complex projects in 2026. By displaying tasks against a structured timeline, they allow project managers to understand what needs to happen, when each activity should begin and end, which tasks depend on others, and where delays could affect the final delivery date.
The best Gantt chart software in 2026 has evolved far beyond simple horizontal timeline bars. Modern platforms combine interactive scheduling with task dependencies, critical path analysis, milestones, project baselines, resource allocation, workload management, time tracking, workflow automation, portfolio management, reporting, and increasingly AI-powered project assistance. These capabilities can help teams identify scheduling risks earlier and coordinate work across multiple departments and projects.
Demand for sophisticated project management technology is also expanding as organizations manage increasingly distributed teams, complex digital transformation initiatives, construction programs, product launches, engineering projects, and cross-functional workflows. Cloud-based platforms have made advanced scheduling capabilities that were once primarily associated with specialist project management software accessible to businesses of almost every size.
However, the best Gantt chart software is not necessarily the platform with the longest feature list. A construction company coordinating contractors and material lead times has very different scheduling requirements from a marketing agency planning campaigns or a PMO overseeing hundreds of enterprise projects. Pricing can also vary significantly, from affordable cloud subscriptions to specialized enterprise project controls systems requiring substantial implementation and training.
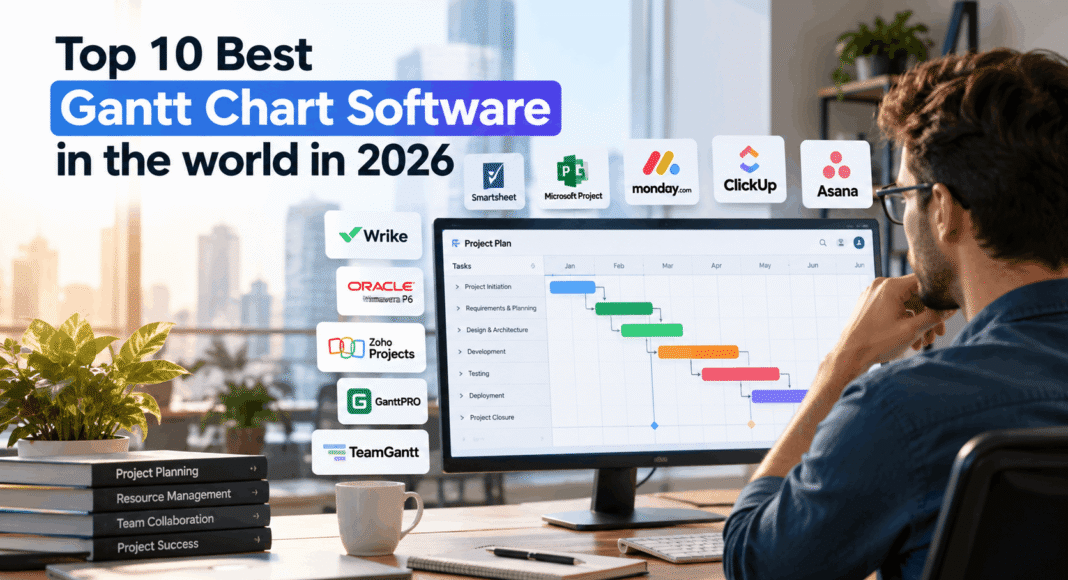
This guide to the Top 10 Best Gantt Chart Software in the world in 2026 compares Smartsheet, Microsoft Project, monday.com, ClickUp, Asana, Wrike, Oracle Primavera P6, Zoho Projects, GanttPRO, and TeamGantt. Each platform is evaluated according to its Gantt chart capabilities, dependency management, critical path functionality, baselines, resource planning, collaboration features, pricing, scalability, and suitability for different project environments.
Whether the priority is an easy-to-use online Gantt chart, affordable project scheduling software, construction scheduling, enterprise portfolio management, or advanced Critical Path Method planning, this comparison provides a practical starting point for identifying the Gantt chart software best suited to an organization’s projects, teams, and long-term operational requirements.
Before we venture further into this article, we would like to share who we are and what we do.
About 9cv9
9cv9 is a business tech startup based in Singapore and Asia, with a strong presence all over the world.
With over ten years of startup and business experience, and being highly involved in connecting with thousands of companies and startups, the 9cv9 team has listed some of the top and best companies/tools in this review.
If you like to get your company listed in our top B2B software reviews, check out our world-class 9cv9 Media and PR service and pricing plans here.
Top 10 Best Gantt Chart Software To Know in 2026
- Smartsheet
- Microsoft Project
- monday.com
- ClickUp
- Asana
- Wrike
- Oracle Primavera P6
- Zoho Projects
- GanttPRO
- TeamGantt
1. Smartsheet
Smartsheet is an enterprise-focused work management and project scheduling platform that combines a familiar spreadsheet-style interface with interactive Gantt charts, dashboards, reports, automation, and portfolio management capabilities.
For organizations evaluating the best Gantt chart software in 2026, Smartsheet stands out because project schedules can be created and maintained through structured rows rather than requiring teams to work exclusively inside a traditional timeline interface. Users can move between grid, Gantt, board, calendar, and table views while maintaining the same underlying project information.
This approach makes Smartsheet particularly suitable for organizations transitioning from spreadsheet-based project tracking toward more structured project and portfolio management.
Smartsheet Gantt Chart Capabilities
Smartsheet’s Gantt functionality extends beyond basic timeline visualization. Project managers can establish dependencies between tasks, identify critical paths, maintain project baselines, define milestones, and automatically recalculate schedules when predecessor dates change.
Hierarchical project structures are another important capability. When dependencies are enabled, parent rows automatically summarize information from their child tasks, including duration, percentage completed, start dates, and end dates.
| Gantt Chart Capability | Smartsheet Support | Practical Application |
|---|---|---|
| Interactive Gantt charts | Yes | Visualize tasks, milestones and schedules |
| Task dependencies | Yes | Connect predecessor and successor activities |
| Automatic date adjustment | Yes | Reschedule dependent tasks when dates change |
| Critical path | Yes | Identify tasks directly affecting completion dates |
| Driving path | Yes | Identify predecessors affecting a task’s start date |
| Summary path | Yes | Identify subtasks affecting parent completion |
| Project baselines | Yes | Compare planned schedules against current schedules |
| Hierarchical tasks | Yes | Organize projects into parent and child activities |
| Multiple project views | Yes | Switch between grid, Gantt, board, calendar and other views |
| Workload tracking | Business and above | Evaluate team workload alongside project schedules |
One limitation worth considering is baseline management. Smartsheet currently supports one baseline for a project sheet rather than maintaining multiple historical baseline versions. This may matter to organizations with highly formalized project controls.
Automation and Schedule Management
Dependency management is one of Smartsheet’s strongest Gantt-related capabilities. When a predecessor task’s timing changes, dependent task dates can automatically adjust according to the project’s dependency configuration.
Critical-path calculations also respond dynamically to scheduling changes. This gives project managers a clearer understanding of which activities could delay the overall completion date.
These capabilities make Smartsheet particularly useful for waterfall projects, implementation programs, construction schedules, marketing campaigns, operational projects, and other initiatives where sequencing and deadlines are important.
Smartsheet Pricing in 2026
Smartsheet follows a per-member subscription structure for its main commercial plans. Annual billing provides lower monthly-equivalent pricing than month-to-month subscriptions.
| Plan | Annual Billing Price | Member Requirements | Relevant Project Management Features |
|---|---|---|---|
| Pro | $9 per member/month | 1-10 members | Gantt view, dependencies, critical path, 250 automations per month |
| Business | $19 per member/month | Minimum 3 members | Pro features plus baselines, timeline view, workload tracking and unlimited automations |
| Enterprise | Custom pricing | 10+ members | Business features plus enterprise security, portfolio management and governance |
| Advanced Work Management | Custom pricing | Customized deployment | Enterprise capabilities plus Control Center, DataMesh, Data Shuttle, connectors and other advanced tools |
A notable correction to older descriptions of Smartsheet is that baselines should not be treated as universally equivalent across plans. Current plan information places baseline functionality on Business and higher tiers in the pricing comparison, although Smartsheet’s documentation also identifies baseline availability across paid offerings. Organizations should therefore confirm entitlement for their specific subscription configuration.
Pro Versus Business
The difference between Pro and Business can become significant for teams that want to move beyond basic Gantt chart creation.
| Requirement | Pro | Business |
|---|---|---|
| Gantt View | Yes | Yes |
| Dependencies | Yes | Yes |
| Critical Path | Yes | Yes |
| Baselines | Limited by current plan entitlement | Yes |
| Timeline View | No | Yes |
| Workload Tracking | No | Yes |
| Monthly Automations | 250 | Unlimited |
| Guest Access | Limited | Unlimited free guests |
| Dashboard Widgets | Up to 10 per dashboard | Unlimited |
| API Access | No | Yes |
| Activity Log | No | Yes |
At annual rates, moving from $9 to $19 per member per month represents approximately a 111% increase in the base per-member subscription price. Consequently, organizations primarily interested in straightforward Gantt scheduling should evaluate whether Business-tier capabilities justify the additional expenditure.
Enterprise Project and Portfolio Management
Smartsheet becomes considerably broader at the enterprise level. Instead of functioning simply as Gantt chart software, it can serve as a centralized work management environment connecting project schedules, dashboards, reports, resource information, automation, governance, and portfolio oversight.
Advanced Work Management expands the platform further through capabilities such as Control Center, DataMesh, Data Shuttle, Dynamic View, connectors, and additional enterprise applications.
This scalability is one reason Smartsheet is used by large organizations. Publicly identified customers include Pfizer, Procter & Gamble, Alaska Airlines and the LEGO Group, while Smartsheet reports adoption across more than 85% of Fortune 500 companies.
User Reviews and Market Reception
Smartsheet maintains strong ratings across major business software review platforms in 2026.
| Review Platform | Rating | Approximate Review Volume |
|---|---|---|
| G2 | 4.4 / 5 | More than 22,700 reviews |
| Capterra | 4.5 / 5 | More than 3,500 reviews |
G2 reviewers frequently highlight Smartsheet’s familiar spreadsheet-style environment, project monitoring capabilities, flexibility, sharing options, and ability to connect information across multiple sheets.
Capterra reviews similarly indicate strong overall satisfaction, with ease of use and customer service both receiving approximately 4.3 out of 5.
Strengths and Limitations
| Area | Assessment |
|---|---|
| Ease of adoption | Strong for teams already comfortable with spreadsheets |
| Gantt functionality | Strong |
| Dependency management | Strong |
| Critical-path analysis | Strong |
| Automation | Strong, particularly on Business and higher plans |
| Portfolio management | Strong at Enterprise and Advanced Work Management levels |
| Resource management | More capable on higher-tier plans |
| Collaboration | Strong |
| Enterprise governance | Strong |
| Small-team affordability | Competitive on Pro |
| Advanced-feature affordability | Moderate to expensive |
| Baseline flexibility | Limited compared with specialized project controls platforms |
Who Should Consider Smartsheet?
Smartsheet is particularly well suited to project management offices, operations teams, construction organizations, professional services companies, marketing departments, product teams, and enterprises that need to connect project schedules with broader workflow management.
Its biggest advantage is the combination of spreadsheet familiarity and formal project scheduling. Teams can begin with structured rows and columns and progressively introduce Gantt charts, dependencies, automation, dashboards, workload tracking, and portfolio controls as their requirements become more sophisticated.
Smartsheet’s Position Among the Best Gantt Chart Software in 2026
For a comparison of the Top 10 Best Gantt Chart Software in the world in 2026, Smartsheet deserves consideration as an especially strong option for organizations that need more than a standalone Gantt chart creator.
Its combination of dependency-driven scheduling, critical-path analysis, baselines, automation, multiple project views, dashboards, workload management, and enterprise governance makes it particularly compelling for growing and large organizations.
The principal trade-off is cost and complexity. Smaller teams requiring only basic timeline visualization may find simpler Gantt chart tools more economical. However, businesses that want Gantt scheduling to form part of a wider collaborative work management and portfolio ecosystem can derive considerably greater value from Smartsheet.
2. Microsoft Project
Microsoft Project remains one of the most established project scheduling platforms for professional project managers, PMOs, engineering teams, construction organizations, and enterprises managing complex schedules. In 2026, Microsoft’s project management offering increasingly sits within the Microsoft Planner ecosystem, with former Project subscription plans incorporated into Planner’s premium tiers.
Rather than competing solely as a standalone Gantt chart application, the platform combines visual timelines with Critical Path Method scheduling, dependencies, resource management, baselines, budgeting, and portfolio management.
Microsoft’s current portfolio spans cloud subscriptions and perpetual Project 2024 desktop licenses, allowing organizations to choose between collaborative cloud project management and traditional on-premises scheduling software.
Microsoft Project Gantt Chart and Scheduling Capabilities
The platform is particularly strong when projects involve interconnected activities and strict scheduling requirements. Planner’s premium capabilities include Gantt-style Timeline views, milestones, summary tasks, custom calendars, assignments, critical-path visualization, and multiple dependency relationships.
Planner and Project Plan 3 extends these capabilities with advanced dependencies incorporating lead and lag, baselines, resource requests, program management, project financials, budgeting, costing, and access to the Project desktop client.
| Scheduling Capability | Planner Plan 1 | Planner and Project Plan 3 |
|---|---|---|
| Timeline Gantt View | Yes | Yes |
| Task Dependencies | Yes | Yes |
| Milestones | Yes | Yes |
| Summary and Subtasks | Yes | Yes |
| Critical Path | Limited premium capability | Yes |
| Baselines | No | Yes |
| Lead and Lag Dependencies | No | Yes |
| Resource Requests | No | Yes |
| Program Management | No | Yes |
| Project Financial Management | No | Yes |
| Project Desktop Client | No | Yes |
Advanced Dependency Management
One of Microsoft’s strongest differentiators is its scheduling engine. Premium Planner projects can establish finish-to-start, start-to-start, finish-to-finish, and start-to-finish relationships between activities.
The scheduling engine can automatically recalculate execution dates when dependencies change. Plan 3 adds lead and lag functionality, giving experienced project managers greater control over complex sequencing.
Critical-path visualization further helps managers identify the activities that directly determine a project’s completion date. This makes the software particularly relevant for engineering, construction, infrastructure, manufacturing, implementation, and other schedule-sensitive projects.
Microsoft Project Pricing in 2026
Microsoft offers several levels of project management functionality. Planner Plan 1 provides the most accessible entry point for teams primarily interested in Gantt charts and structured project management, while Planner and Project Plan 3 is designed for substantially more advanced scheduling requirements.
| Plan Tier | 2026 Pricing | Deployment | Key Project Management Capabilities |
|---|---|---|---|
| Planner Plan 1 | $10 per user/month, paid yearly | Cloud | Gantt Timeline, dependencies, reports, project goals, backlogs and sprints |
| Planner and Project Plan 3 | $30 per user/month, paid yearly | Cloud plus desktop client | Baselines, critical path, advanced dependencies, resource requests, program management and financials |
| Planner and Project Plan 5 | $55 per user/month, paid yearly | Enterprise | Plan 3 features plus portfolio and enterprise resource management |
| Project Standard 2024 | $679.99 one-time | Desktop / On-premises | Standalone project planning and automated scheduling |
| Project Professional 2024 | $1,129.99 one-time | Desktop / On-premises | Comprehensive on-premises project management |
| Project Server | Custom | On-premises | Enterprise project portfolio management |
Microsoft’s official 2026 pricing confirms the $10, $30 and $55 monthly subscription tiers, while Project Standard 2024 and Project Professional 2024 remain available as one-time purchases.
Planner Plan 1 Versus Planner and Project Plan 3
The appropriate tier depends heavily on scheduling complexity.
| Requirement | Plan 1 | Plan 3 |
|---|---|---|
| Basic Gantt Planning | Strong | Strong |
| Task Dependencies | Yes | Yes |
| Reporting | Yes | Yes |
| Backlogs and Sprints | Yes | Yes |
| Critical Path | More limited | Advanced |
| Baselines | No | Yes |
| Lead and Lag | No | Yes |
| Resource Requests | No | Yes |
| Budgeting and Costing | No | Yes |
| Program Management | No | Yes |
| Desktop Project Client | No | Included |
At $10 per user per month, Planner Plan 1 is the more economical choice for organizations primarily seeking collaborative Gantt charts, dependencies, reporting, and structured task management.
Plan 3 costs three times as much at $30 per user per month, but the additional expenditure provides substantially deeper project controls. Baselines, critical-path scheduling, advanced dependencies, resource capabilities, financial management, and desktop Project access make it considerably more appropriate for professional PMOs and complex project environments.
Desktop Project 2024
Microsoft continues to support organizations that prefer perpetual desktop software rather than recurring cloud subscriptions.
Project Standard 2024 costs $679.99 as a one-time purchase for one PC. It includes automated scheduling, dependency-based date calculations, multiple timelines, templates, and scenario planning.
Project Professional 2024 costs $1,129.99 as a one-time purchase and provides a more comprehensive on-premises project management environment.
These editions can be particularly relevant to organizations with restrictive IT policies, established Microsoft Project workflows, or environments where cloud-based collaboration is not the primary requirement.
Enterprise Project and Portfolio Management
Organizations requiring capabilities beyond individual project schedules can move to Planner and Project Plan 5. At $55 per user per month with annual billing, this tier builds on Plan 3 with advanced portfolio management and enterprise resource management and allocation.
| Organizational Requirement | Recommended Microsoft Tier |
|---|---|
| Simple team task management | Planner in Microsoft 365 |
| Gantt charts and dependencies | Planner Plan 1 |
| Professional project scheduling | Planner and Project Plan 3 |
| Critical path and baselines | Planner and Project Plan 3 |
| Advanced resource planning | Planner and Project Plan 3 |
| Enterprise portfolio management | Planner and Project Plan 5 |
| Standalone desktop scheduling | Project Standard 2024 |
| Advanced on-premises project management | Project Professional 2024 |
Market Reception
Microsoft Project continues to receive strong recognition for scheduling depth rather than simplicity. G2 lists Microsoft Project and Portfolio Management at approximately 4.0 out of 5, reflecting its established position among professional project management platforms.
Its greatest advantage is the depth of scheduling functionality available to experienced project managers. The corresponding disadvantage is complexity. Organizations seeking a lightweight, highly intuitive Gantt chart application may encounter more functionality and configuration than they require.
Strengths and Limitations
| Area | Assessment |
|---|---|
| Gantt Chart Scheduling | Excellent |
| Critical Path Management | Excellent |
| Dependency Management | Excellent |
| Lead and Lag Scheduling | Excellent on Plan 3 |
| Baseline Management | Strong |
| Resource Management | Strong |
| Portfolio Management | Excellent on Plan 5 |
| Microsoft 365 Integration | Excellent |
| Desktop Project Management | Excellent |
| Ease of Learning | Moderate to Difficult |
| Suitability for Small Projects | Moderate |
| Suitability for Complex Projects | Excellent |
Microsoft Project’s Position Among the Best Gantt Chart Software in 2026
Microsoft Project remains a compelling benchmark for organizations that judge Gantt chart software primarily by scheduling sophistication rather than interface simplicity.
Planner Plan 1 has also made Microsoft’s Gantt capabilities more accessible, providing Timeline views and dependencies for $10 per user per month. Professional project managers requiring baselines, critical-path analysis, advanced dependencies, resource planning, budgeting, and desktop Project functionality can instead move to Planner and Project Plan 3.
For PMOs, engineering organizations, construction companies, professional services teams, and enterprises managing complex interconnected schedules, Microsoft Project remains one of the strongest Gantt chart software options in 2026.
3. monday.com
monday.com is a visual work management platform designed to coordinate projects, workflows, resources, and operational processes across teams. Its flexible board-based architecture allows organizations to manage project information in one environment and visualize the same data through Gantt charts, timelines, calendars, dashboards, and other views.
For organizations comparing the best Gantt chart software in 2026, monday.com is particularly notable for combining accessible visual project management with increasingly sophisticated scheduling functionality. Its Gantt tools are integrated directly with project boards, allowing schedule changes to remain connected with the underlying tasks, owners, dates, statuses, and project data.
Gantt Chart and Timeline Capabilities
Gantt functionality becomes available from the Standard plan. Users can convert board information into a visual project schedule, organize activities chronologically, display milestones, and monitor how work progresses against deadlines.
More sophisticated Gantt functionality is concentrated in the Pro and Enterprise tiers. Baselines, for example, are available on these higher plans and allow project managers to capture schedule snapshots and compare subsequent progress against the original project plan.
| Gantt Chart Capability | Availability | Project Management Application |
|---|---|---|
| Gantt View | Standard and above | Visualize projects across a schedule |
| Timeline View | Standard and above | Track activities chronologically |
| Milestones | Pro and Enterprise | Highlight major deadlines and deliverables |
| Gantt Baselines | Pro and Enterprise | Compare current schedules against previous snapshots |
| Dependencies | Pro and Enterprise | Connect related project activities |
| Critical Path | Available as a trial feature | Identify schedule-critical activities |
| Lead and Lag | Gradual rollout | Control gaps and overlaps between dependent tasks |
| Workload Management | Pro and above | Monitor capacity across team members |
| Time Tracking | Pro and above | Measure time spent on individual activities |
Dependency Management
monday.com provides a considerably more sophisticated dependency system than a simple visual Gantt chart might suggest.
Project teams can define Finish-to-Start, Start-to-Start, Finish-to-Finish, and Start-to-Finish relationships. The platform also provides Flexible, Strict, and No Action dependency modes, determining how dependent dates react when upstream schedules change.
Dragging activities within Gantt or Timeline views can therefore cause associated dates to shift according to the configured dependency rules.
Lead and lag functionality is also being introduced, enabling teams to establish deliberate gaps or overlaps between connected project activities. These capabilities make monday.com increasingly suitable for projects involving sequential workflows rather than merely independent task lists.
Baseline Tracking
Baseline functionality provides project managers with a snapshot of the original schedule against which subsequent changes can be measured.
When a baseline is created, monday.com preserves the original timeline positions while allowing the live schedule to continue changing. Project managers can then visually identify tasks that remain on schedule and activities that have been delayed.
Multiple baseline snapshots can also be selected and compared, making the functionality useful for understanding how project schedules evolve during execution.
Critical Path Analysis
monday.com also provides critical-path visualization within its Gantt environment. When enabled, the platform highlights activities that must remain on schedule for the overall project to meet its planned completion date.
However, organizations evaluating this capability in 2026 should note an important qualification: monday.com currently describes Critical Path as a trial feature, meaning its long-term plan availability may change.
monday.com Pricing in 2026
The platform uses a per-seat subscription model, with annual subscriptions offering lower effective monthly pricing.
| Plan Tier | Annual Billing Price | Gantt and Scheduling Capabilities |
|---|---|---|
| Free | $0 | Basic boards and task management; up to 2 seats |
| Basic | $9 per seat/month | Expanded work management but no Gantt or Timeline views |
| Standard | $12 per seat/month | Gantt, Timeline, Calendar, 250 automation actions and 250 integration actions monthly |
| Pro | $19 per seat/month | Advanced board views, time tracking, advanced columns and 25,000 automation actions monthly |
| Enterprise | Custom | Portfolio management, resource management, governance and enterprise-scale automation |
The Standard plan represents the practical starting point for organizations specifically purchasing monday.com as Gantt chart software. At $12 per seat per month with annual billing, it introduces both Timeline and Gantt views.
Pro Versus Standard for Project Management
The distinction between Standard and Pro becomes important for organizations managing more sophisticated projects.
| Capability | Standard | Pro |
|---|---|---|
| Gantt View | Yes | Yes |
| Timeline View | Yes | Yes |
| Calendar View | Yes | Yes |
| Automation Actions | 250/month | 25,000/month |
| Integration Actions | 250/month | 25,000/month |
| Time Tracking | No | Yes |
| Advanced Columns | Limited | Yes |
| Advanced Board Views | Limited | Yes |
| Baselines | No | Yes |
| Dependencies | Limited | Yes |
| Workload Management | Limited | Yes |
Standard should therefore be sufficient for teams primarily interested in visual Gantt scheduling and straightforward project coordination. Pro is substantially more appropriate when projects require dependencies, baseline tracking, time measurement, workload analysis, and large-scale automation.
Automation and Workflow Management
Automation is one of monday.com’s major advantages over conventional Gantt chart applications.
Standard provides 250 automation actions per month, whereas Pro increases this allowance dramatically to 25,000 actions. Enterprise deployments can scale automation and integration activity considerably further.
This allows Gantt schedules to become part of broader operational workflows. Project status changes, assignments, notifications, deadlines, approvals, and connected business processes can be automated rather than managed independently from the project schedule.
Enterprise Project and Portfolio Management
At the Enterprise level, monday.com extends beyond individual project schedules into portfolio and resource management.
Portfolio functionality allows organizations to connect projects into centralized views and monitor project health, risks, progress, and strategic alignment. Resource management provides additional tools for understanding capacity and allocating people across projects.
| Organizational Requirement | Suitable Tier |
|---|---|
| Basic personal task management | Free |
| General team work management | Basic |
| Gantt chart project planning | Standard |
| Advanced project scheduling | Pro |
| Baselines and workload management | Pro |
| High-volume workflow automation | Pro |
| Portfolio management | Enterprise |
| Enterprise resource management | Enterprise |
| Advanced governance and permissions | Enterprise |
User Reviews and Market Reception
monday.com maintains a strong reputation among business software users. G2 reports an overall rating of approximately 4.7 out of 5 across more than 19,000 reviews.
The platform’s appeal is closely connected to usability and flexibility. Rather than forcing every team into a rigid project management methodology, monday.com allows organizations to configure boards, columns, dashboards, automations, and project views around their existing processes.
Strengths and Limitations
| Area | Assessment |
|---|---|
| User Interface | Excellent |
| Gantt Visualization | Strong |
| Timeline Management | Strong |
| Dependency Management | Strong on higher plans |
| Baseline Tracking | Strong on Pro and Enterprise |
| Critical Path | Promising, but currently a trial feature |
| Automation | Excellent |
| Time Tracking | Strong on Pro |
| Workload Management | Strong |
| Portfolio Management | Strong on Enterprise |
| Ease of Adoption | Excellent |
| Free Gantt Availability | Poor |
| Advanced Features on Lower Plans | Limited |
monday.com’s Position Among the Best Gantt Chart Software in 2026
monday.com deserves a strong position among the Top 10 Best Gantt Chart Software in the world in 2026 because it balances visual usability with increasingly capable project scheduling.
Its Standard plan provides an accessible entry point for Gantt and Timeline management, while Pro introduces the functionality required for more sophisticated project environments, including dependencies, baselines, time tracking, workload management, advanced columns, and substantially greater automation capacity.
Compared with traditional project scheduling platforms, monday.com’s principal advantage is flexibility. It can function simultaneously as a Gantt chart tool, collaborative workspace, workflow automation platform, resource management system, and operational dashboard.
For organizations seeking modern, visually accessible Gantt chart software that can expand into broader work management, monday.com is one of the strongest options to consider in 2026.
4. ClickUp
ClickUp is an all-in-one productivity and project management platform that combines task management, Gantt charts, documents, dashboards, goals, time tracking, resource management, automation, chat, and artificial intelligence within a unified workspace.
For organizations comparing the best Gantt chart software in 2026, ClickUp is particularly competitive because sophisticated scheduling capabilities are available at relatively low subscription prices. Its Gantt environment is connected directly to underlying tasks, dependencies, milestones, assignees, priorities, and project dates, allowing teams to manage schedules without maintaining a separate project planning application.
ClickUp is especially attractive to software development teams, agencies, operations departments, startups, and organizations seeking to consolidate several productivity applications into one platform.
Gantt Chart and Project Scheduling Capabilities
ClickUp’s Gantt view converts project tasks into an interactive timeline. Project managers can drag activities to change dates, create dependency relationships visually, establish milestones, identify critical-path activities, and determine where schedule flexibility remains through Slack Time.
When dependency rescheduling is enabled, moving one activity can automatically shift downstream dependent tasks. This makes the Gantt chart a functional scheduling environment rather than simply a visual representation of existing deadlines.
| Gantt Capability | ClickUp Functionality | Project Management Value |
|---|---|---|
| Interactive Gantt Charts | Yes | Visual project scheduling |
| Drag-and-Drop Scheduling | Yes | Rapidly modify project dates |
| Task Dependencies | Yes | Establish relationships between activities |
| Automatic Rescheduling | Yes | Shift downstream dependent tasks automatically |
| Critical Path | Yes | Identify activities controlling completion dates |
| Slack Time | Yes | Identify scheduling flexibility |
| Milestones | Yes | Highlight major project deliverables |
| Gantt Baselines | Available on paid plans | Compare schedules against previous snapshots |
| Resource Management | Yes | Coordinate people and project capacity |
| Gantt Export | Business and above | Export schedules for external stakeholders |
Dependency and Critical Path Management
ClickUp provides considerably more scheduling depth than basic timeline software.
Dependencies can be created directly inside the Gantt view by connecting project activities. Once dependency rescheduling is enabled, changes can cascade through the connected task chain automatically.
Critical Path analysis identifies the longest sequence of dependent activities controlling the project’s earliest possible completion date. ClickUp complements this with Slack Time, which identifies tasks that can move without immediately delaying the overall project.
These capabilities are valuable for product launches, software development, marketing campaigns, implementation projects, professional services, and other deadline-sensitive initiatives.
Gantt Chart Availability by Plan
One important correction to older ClickUp comparisons concerns its Free Forever plan. Current ClickUp documentation provides up to 60 uses of Gantt view on Free Forever rather than completely unrestricted Gantt usage. Unlimited and higher plans provide unlimited Gantt views.
| Plan | Gantt Availability | Critical Path and Slack Time |
|---|---|---|
| Free Forever | Up to 60 uses | Limited availability |
| Unlimited | Unlimited Gantt | 100 uses |
| Business | Unlimited Gantt | Unlimited |
| Enterprise | Unlimited Gantt | Unlimited |
For teams heavily dependent on critical-path analysis, Business therefore provides a meaningful advantage because Critical Path and Slack Time become unlimited.
ClickUp Pricing in 2026
ClickUp remains aggressively priced compared with many enterprise project management platforms. Current annual pricing starts at $7 per user per month for Unlimited and $12 for Business.
| Plan Tier | Annual Billing Price | Storage | Important Project Features |
|---|---|---|---|
| Free Forever | $0 | 60 MB | Unlimited tasks and members, limited Gantt usage, Docs and basic project management |
| Unlimited | $7 per user/month | Unlimited | Unlimited Gantt, time tracking, goals, portfolios, resource management and integrations |
| Business | $12 per user/month | Unlimited | Advanced dashboards, portfolio workload management, unlimited Timeline views and 5,000 automations monthly |
| Enterprise | Custom | Enterprise scale | Advanced governance, SSO, SCIM, audit logs, custom roles and enterprise automation |
The Unlimited plan represents particularly strong value for Gantt-focused teams. At $7 per user per month when billed annually, it provides unlimited Gantt charts alongside native time tracking, goals, portfolio management, resource management, unlimited storage, and unlimited custom fields.
Unlimited Versus Business
The Business tier becomes more relevant when project management extends beyond individual schedules into reporting, workload analysis, automation, and cross-project oversight.
| Capability | Unlimited | Business |
|---|---|---|
| Price per User/Month | $7 | $12 |
| Unlimited Gantt Charts | Yes | Yes |
| Native Time Tracking | Yes | Yes |
| Goals and Portfolios | Yes | Yes |
| Resource Management | Yes | Yes |
| Critical Path and Slack Time | 100 uses | Unlimited |
| Advanced Dashboards | Limited | Yes |
| Portfolio Workload Management | Limited | Yes |
| Automations | Lower allowance | 5,000 per month |
| Unlimited Timeline Views | No | Yes |
| Custom Exporting | No | Yes |
Business therefore makes greater sense for organizations managing multiple teams or projects simultaneously, while Unlimited offers substantial functionality for smaller organizations requiring capable Gantt scheduling at a relatively low cost.
ClickUp Brain and AI Pricing
Artificial intelligence has become a more significant part of ClickUp’s product strategy in 2026. Current ClickUp pricing differs slightly from earlier estimates: Brain AI is listed at $9 per user per month with yearly billing, while the broader Everything AI package costs $28 per user per month.
| Configuration | Base Platform | AI Add-On | Approximate Combined Cost |
|---|---|---|---|
| Unlimited + Brain AI | $7 | $9 | $16 per user/month |
| Business + Brain AI | $12 | $9 | $21 per user/month |
| Unlimited + Everything AI | $7 | $28 | $35 per user/month |
| Business + Everything AI | $12 | $28 | $40 per user/month |
Brain AI provides access to AI assistance, AI writing, project summaries, premium AI models, workspace search, and AI-related productivity features.
Everything AI is positioned as the more extensive agentic package, adding considerably greater access to AI agents, automated fields, AI-generated content, meeting intelligence, and other advanced capabilities. Some AI operations can also involve usage credits, so organizations should consider both subscription and consumption costs when estimating total expenditure.
Tool Consolidation
ClickUp’s broader advantage is that organizations are not purchasing Gantt functionality in isolation.
| Traditional Software Requirement | ClickUp Capability |
|---|---|
| Gantt Chart Software | Gantt View |
| Task Manager | Tasks and Projects |
| Documentation Platform | Docs and Wikis |
| Time Tracking Software | Native Time Tracking |
| Goal Management | Goals |
| Portfolio Management | Portfolios |
| Resource Planning | Resource Management |
| Reporting Platform | Dashboards |
| Team Communication | ClickUp Chat |
| Workflow Automation | Automations |
| AI Assistant | ClickUp Brain |
This consolidation can reduce the need for separate project scheduling, documentation, time tracking, goal management, and communication tools, although organizations should evaluate whether ClickUp’s individual modules provide sufficient depth for specialized requirements.
Market Reception
ClickUp maintains a 4.6 out of 5 rating on G2. Current G2 data shows more than 14,000 reviews, meaning the original figure of 13,551 reviews is now outdated.
Review feedback frequently highlights ClickUp’s extensive customization, centralized workspace, broad feature set, and ability to replace multiple productivity applications.
The same feature density can also create its primary weakness. ClickUp itself acknowledges that its extensive configuration options can produce a steeper initial learning curve than simpler project management platforms.
Strengths and Limitations
| Area | Assessment |
|---|---|
| Gantt Chart Functionality | Excellent |
| Dependency Management | Excellent |
| Automatic Rescheduling | Excellent |
| Critical Path Analysis | Strong |
| Slack Time Analysis | Strong |
| Time Tracking | Excellent for the price |
| Resource Management | Strong |
| Portfolio Management | Strong |
| Automation | Strong |
| AI Capabilities | Extensive but adds cost |
| Value for Money | Excellent |
| Ease of Initial Setup | Moderate |
| Feature Complexity | High |
ClickUp’s Position Among the Best Gantt Chart Software in 2026
ClickUp deserves a prominent position among the Top 10 Best Gantt Chart Software in the world in 2026 because it delivers an unusually broad combination of scheduling, productivity, resource management, automation, and collaboration capabilities at competitive prices.
The $7-per-user Unlimited plan is particularly compelling for small and growing teams because it combines unlimited Gantt charts with native time tracking, goals, portfolio management, resource management, unlimited storage, and extensive customization. Organizations requiring more sophisticated workload management, reporting, automation, and unlimited critical-path functionality can move to Business at $12 per user per month.
ClickUp’s primary trade-off is complexity. Its extensive functionality can require more configuration and onboarding than simpler Gantt chart applications. However, for organizations willing to configure the workspace properly, ClickUp offers one of the strongest feature-to-price propositions among Gantt chart and project management software platforms in 2026.
5. Asana
Asana is a collaborative work management platform designed to connect everyday tasks, projects, workflows, portfolios, and organizational goals. It is particularly popular among marketing teams, creative departments, product organizations, professional services firms, and cross-functional enterprise teams.
For organizations comparing the best Gantt chart software in 2026, Asana provides both Timeline and dedicated Gantt views. Timeline emphasizes accessible visual scheduling, while Gantt provides a more structured representation of task hierarchy, durations, dependencies, milestones, and project progress.
Asana’s strength is not simply creating Gantt charts. Its broader value comes from connecting schedules with workflow automation, accountability, reporting, resource management, portfolios, and strategic goals.
Gantt Chart and Timeline Capabilities
Asana’s Gantt and Timeline functionality becomes available with the Starter plan. Teams can create start and due dates, connect dependent activities, reschedule tasks visually, identify milestones, and monitor how schedule changes affect a project.
The dedicated Gantt view is particularly useful when projects contain multiple phases and complex dependencies, while Timeline provides a simpler visual planning environment.
| Scheduling Capability | Asana Functionality | Project Management Value |
|---|---|---|
| Gantt View | Yes, Starter and above | Detailed schedule visualization |
| Timeline View | Yes, Starter and above | Visual project planning |
| Drag-and-Drop Scheduling | Yes | Rapid schedule adjustment |
| Task Dependencies | Yes | Connect sequential activities |
| Dependency Date Shifting | Yes | Automatically adjust connected work |
| Critical Path | Yes | Identify activities affecting project completion |
| Milestones | Yes | Highlight major deadlines and deliverables |
| Portfolio Timeline | Advanced and above | Coordinate schedules across projects |
| Workload Management | Advanced and above | Monitor capacity and rebalance assignments |
| Native Time Tracking | Advanced and above | Compare planned and actual effort |
Dependency Management and Schedule Adjustments
Asana provides more sophisticated dependency management than a basic Gantt chart creator.
Project managers can establish blocking and blocked-by relationships directly within Timeline. When schedules change, dependency date shifting can automatically adjust connected activities.
Asana provides different approaches for handling schedule changes, including maintaining the buffer between dependent tasks. This helps project managers preserve intentional scheduling gaps when upstream activities move.
Work schedules can also be configured so automated schedule changes account for working days rather than simply moving tasks across weekends.
Critical Path Management
Asana supports critical-path visualization for projects containing dependencies.
The critical path highlights the sequence of activities that must remain on schedule to prevent the overall project completion date from slipping. This makes Asana more useful for deadline-sensitive initiatives such as product launches, marketing campaigns, events, implementations, and cross-functional programs.
While Asana provides capable critical-path functionality, organizations requiring highly technical CPM scheduling, advanced resource leveling, or engineering-grade schedule controls may still prefer specialized project scheduling platforms.
Multi-Homing Across Projects
One of Asana’s most distinctive project management capabilities is multi-homing.
A single task can belong to multiple projects without creating duplicate copies. Asana currently allows a task to belong to as many as 20 projects. Changes to the assignee, deadline, comments, attachments, and other task information are reflected everywhere that task appears.
| Traditional Approach | Asana Multi-Homing |
|---|---|
| Duplicate tasks between projects | One task appears across multiple projects |
| Update each copy separately | Changes synchronize automatically |
| Greater risk of conflicting information | Single underlying source of task information |
| Separate departmental tracking | Multiple teams can reference the same work |
| Manual cross-project coordination | Shared work remains connected |
This capability can be especially valuable when marketing, product, design, engineering, and leadership teams need to monitor the same deliverable from different project perspectives.
Asana Pricing in 2026
Asana’s Personal plan remains free for up to two users. Gantt and Timeline functionality begins with Starter at $10.99 per user per month when billed annually.
| Plan Tier | Annual Billing Price | Primary Scheduling and Management Capabilities |
|---|---|---|
| Personal | $0 | Up to 2 users, unlimited tasks and projects, list, board and calendar views |
| Starter | $10.99 per user/month | Timeline, Gantt, custom fields, dashboards, unlimited automations and forms |
| Advanced | $24.99 per user/month | Portfolios, goals, workload, native time tracking and advanced cross-project management |
| Enterprise | Custom | Enterprise administration, security and organization-wide management |
| Enterprise+ | Custom | Advanced enterprise security, compliance and administrative controls |
A notable update for 2026 is that Asana’s current pricing information states that Starter has no user-seat limit. Therefore, descriptions claiming that Starter is restricted by a two-to-five-seat threshold should not be treated as a current feature limitation.
Starter Versus Advanced
Starter provides most of the functionality necessary for individual project scheduling. Advanced becomes substantially more relevant when an organization needs to coordinate multiple projects, resources, and strategic objectives.
| Capability | Starter | Advanced |
|---|---|---|
| Gantt View | Yes | Yes |
| Timeline View | Yes | Yes |
| Dependencies | Yes | Yes |
| Custom Fields | Yes | Yes |
| Reporting Dashboards | Yes | Yes |
| Unlimited Automations | Yes | Yes |
| Portfolios | No | Unlimited |
| Goals | No | Yes |
| Portfolio Workload | No | Yes |
| Native Time Tracking | No | Yes |
| Cross-Project Resource Planning | Limited | Strong |
The jump from $10.99 to $24.99 represents an increase of approximately 127% in the annual per-user monthly equivalent. Organizations should therefore determine whether portfolios, workload planning, goals, and native time tracking justify moving the entire team to Advanced.
Portfolio and Resource Management
Advanced transforms Asana from primarily a project management platform into a broader program and portfolio management environment.
Portfolios provide centralized visibility across multiple projects, including project health, progress, ownership, budgets, time, and other custom metrics. Portfolio Timeline can display start dates, completion dates, and milestones across projects.
Portfolio Workload adds a resource-management layer by showing team capacity across connected projects and allowing managers to rebalance assignments.
| Management Level | Relevant Asana Capability |
|---|---|
| Individual Task | Tasks and Subtasks |
| Project | Gantt and Timeline |
| Cross-Project Work | Multi-Homing |
| Program | Portfolios |
| Resource Capacity | Portfolio Workload |
| Organizational Objectives | Goals |
| Performance Monitoring | Dashboards and Reporting |
Goals and Strategic Alignment
Another important differentiator is Asana Goals.
Rather than treating Gantt schedules as isolated project plans, organizations can connect projects and everyday work to higher-level objectives. This allows management teams to understand not only whether individual tasks are being completed, but also how execution contributes to broader organizational priorities.
This combination makes Asana particularly suitable for organizations implementing OKRs or other goal-oriented management frameworks.
Market Reception
Asana maintains a strong position across business software review platforms. G2 currently reports an average rating of approximately 4.4 out of 5 across more than 14,000 reviews, making the original figure of approximately 11,000 reviews outdated.
Its reputation is particularly strong around usability, visual project management, collaboration, workflow organization, and cross-functional coordination.
Strengths and Limitations
| Area | Assessment |
|---|---|
| Gantt Chart Functionality | Strong |
| Timeline Planning | Excellent |
| Dependency Management | Strong |
| Critical Path | Strong |
| Multi-Homing | Excellent |
| Workflow Automation | Excellent |
| Portfolio Management | Excellent on Advanced |
| Workload Management | Strong on Advanced |
| Goal and OKR Management | Excellent |
| Native Time Tracking | Available on Advanced |
| Ease of Adoption | Strong |
| Advanced Plan Pricing | Relatively Expensive |
| Engineering-Grade CPM Scheduling | More Limited |
Asana’s Position Among the Best Gantt Chart Software in 2026
Asana deserves consideration among the Top 10 Best Gantt Chart Software in the world in 2026 because it combines capable Gantt scheduling with one of the strongest collaborative work-management environments available.
Starter provides a practical entry point at $10.99 per user per month, incorporating Gantt and Timeline views, dependencies, reporting dashboards, custom fields, forms, and unlimited workflow automations.
Advanced significantly expands the platform with portfolios, goals, workload management, and native time tracking, although its $24.99 per-user price creates a substantial cost increase.
For marketing departments, creative agencies, product teams, professional services organizations, and enterprises coordinating work across multiple departments, Asana is particularly compelling when the objective extends beyond building a Gantt chart to connecting project schedules, resources, workflows, and organizational goals within a single system.
6. Wrike
Wrike is an enterprise-oriented work management and project management platform designed for organizations coordinating complex workflows, multiple projects, resources, approvals, and cross-functional teams.
For businesses evaluating the best Gantt chart software in 2026, Wrike stands out for combining interactive Gantt scheduling with critical-path analysis, dependency management, schedule baselines, workload planning, reporting, automation, and enterprise resource management.
The platform is particularly relevant to PMOs, professional services organizations, marketing and creative agencies, operations teams, and enterprises managing large portfolios of concurrent projects.
Wrike Gantt Chart Capabilities
Wrike’s interactive Gantt charts provide considerably more functionality than simple timeline visualization. Project managers can create and modify dependencies, reschedule tasks through drag-and-drop controls, identify milestones, analyze critical paths, measure scheduling float, and compare actual schedules against project baselines.
When a task with dependencies moves, Wrike can automatically shift its downstream dependent activities, helping maintain schedule consistency across interconnected projects.
| Gantt Chart Capability | Wrike Support | Project Management Application |
|---|---|---|
| Interactive Gantt Charts | Yes | Build and manage visual project schedules |
| Drag-and-Drop Scheduling | Yes | Modify schedules directly from the timeline |
| Task Dependencies | Yes | Connect sequential project activities |
| Automatic Dependency Shifting | Yes | Adjust downstream schedules automatically |
| Critical Path | Business and above | Identify tasks determining completion dates |
| Milestones | Yes | Highlight important deadlines and deliverables |
| Lead and Lag | Yes | Create gaps or overlaps between dependent tasks |
| Total Float | Yes | Determine available scheduling flexibility |
| Free Float | Yes | Measure task movement without delaying successors |
| Negative Float | Yes | Identify tasks already behind required schedules |
| Baseline Tracking | Yes | Compare original plans with current schedules |
| Gantt Snapshots | Paid plans | Preserve historical schedule states |
Advanced Dependency Management
Wrike provides a mature dependency system suitable for projects containing interconnected activities.
When a scheduled task is moved, dependent active tasks can shift automatically. Project managers can also configure lead and lag periods, providing greater control over the timing between connected activities.
This is particularly useful for construction schedules, implementation programs, product launches, professional services engagements, marketing campaigns, and operational projects where delays in one activity can affect numerous downstream tasks.
Critical Path and Scheduling Float
Critical-path functionality is available from the Business plan upward under Wrike’s 2026 packaging.
Wrike highlights activities that directly determine the project’s finish date. If one of these critical activities is delayed, the final completion date may also move.
Wrike complements critical-path analysis with scheduling float.
| Scheduling Metric | Purpose |
|---|---|
| Critical Path | Identifies tasks directly controlling project completion |
| Total Float | Shows how far a task can move without delaying the project |
| Free Float | Shows how far a task can move without delaying its successor |
| Negative Float | Identifies activities already behind required scheduling constraints |
| Milestones | Marks significant project deadlines |
| Baseline Variance | Compares planned scheduling with actual execution |
This combination makes Wrike more capable than lightweight Gantt applications designed primarily for timeline visualization.
Project Baselines and Gantt Snapshots
Wrike offers both baseline tracking and Gantt chart snapshots.
Baseline tracking records the original project schedule into reportable fields. Organizations can subsequently compare planned and actual delivery dates and incorporate schedule variance into dashboards and formulas.
Gantt snapshots provide another layer of historical tracking. Paid-plan users can create unlimited static snapshots representing either the current schedule or the state of a project on a selected historical date.
This distinction is useful because baselines support ongoing schedule-performance analysis, while snapshots provide fixed historical representations that can be shared or reviewed later.
Wrike Pricing in 2026
Wrike introduced revised plan packaging for new purchases beginning in January 2026. The current core lineup consists of Free, Team, Business, Pinnacle, and Apex plans.
| Plan Tier | 2026 Price | User Range | Key Project Management Capabilities |
|---|---|---|---|
| Free | $0 | Basic teams and individuals | Task and project management, board and table views |
| Team | $10 per user/month | 2-15 users | Interactive Gantt charts, dashboards, customization and AI Essentials |
| Business | $25 per user/month | 5-200 users | Advanced workflow customization, integrations and critical-path functionality |
| Pinnacle | Custom | Enterprise | Advanced resource and capacity planning, budgeting and business intelligence |
| Apex | Custom | Enterprise | Pinnacle capabilities plus expanded AI, automation and enterprise integrations |
Prices shown for Team and Business are monthly equivalents billed on an annual per-user basis.
A notable correction to older information is that Business is now officially listed at $25 per user per month for new 2026 purchases rather than the previous $24.80 figure.
Team Versus Business
Wrike Team provides a relatively affordable entry point for organizations specifically seeking interactive Gantt chart software. Business becomes more relevant as operational complexity increases.
| Capability | Team | Business |
|---|---|---|
| Interactive Gantt Charts | Yes | Yes |
| Gantt Snapshots | Yes | Yes |
| Critical Path | No | Yes |
| Custom Workflows | Yes | Advanced |
| Dashboards | Yes | Advanced |
| Workflow Customization | Moderate | Strong |
| Integrations | More Limited | Expanded |
| AI Features | AI Essentials | AI Elite starter capabilities |
| Maximum Users | 15 | 200 |
For small project teams, Team offers a strong balance between price and Gantt functionality. Organizations requiring critical-path management and more sophisticated operational workflows will generally need Business or above.
Pinnacle and Apex for Enterprise Operations
Wrike’s upper tiers move substantially beyond conventional Gantt chart software.
Pinnacle introduces advanced resource and capacity planning, budgeting, financial tracking, advanced reporting, and business intelligence. Organizations can plan resources according to job roles, track billable and cost rates, monitor budgets, and analyze portfolio performance.
Apex extends this environment with greater AI capacity, unlimited Whiteboards, Wrike Integrate, Wrike Sync, and enterprise-level workflow automation.
| Organizational Requirement | Appropriate Wrike Tier |
|---|---|
| Basic task management | Free |
| Interactive Gantt scheduling | Team |
| Critical-path project management | Business |
| Large operational workflows | Business |
| Advanced capacity planning | Pinnacle |
| Project budgeting and financial tracking | Pinnacle |
| Advanced BI and reporting | Pinnacle |
| Enterprise integrations and automation | Apex |
| Large-scale AI workflow automation | Apex |
Seat Purchasing Structure
Wrike’s purchasing structure is an important consideration when calculating total cost of ownership.
Subscriptions are sold in user groups rather than always matching the exact number of employees requiring access. Accounts with up to 30 seats are generally purchased in groups of five, while accounts between 30 and 100 seats use groups of ten. Organizations exceeding 100 seats purchase in groups of 25.
This means a company requiring slightly more than a purchasing threshold may need to pay for unused seats. Businesses comparing Wrike with strictly per-user competitors should therefore calculate the effective account cost rather than comparing advertised per-user prices alone.
Cross-Functional Work Management
Wrike’s folder, project, and space structure is useful for organizations where the same work must remain visible to different departments.
Items can be organized across different locations without creating independent copies of the underlying work. This helps operations, creative, marketing, and management teams maintain different organizational structures while continuing to work from shared information.
Market Reception
Wrike maintains a strong reputation across major business software review platforms in 2026.
| Review Platform | Current Rating | Review Volume |
|---|---|---|
| G2 | 4.2 / 5 | More than 4,500 Wrike reviews |
| Capterra | 4.4 / 5 | Approximately 3,040 reviews |
Capterra’s September 2026 data places Wrike at 4.4 out of 5 overall. Reviews frequently emphasize centralized project management, workflow visibility, customization, and the ability to coordinate numerous projects and deadlines.
However, its flexibility also contributes to one of its main disadvantages. Some reviewers report a substantial learning curve because organizations must understand and configure workflows, automations, blueprints, permissions, and workspace structures before obtaining maximum value.
Strengths and Limitations
| Area | Assessment |
|---|---|
| Interactive Gantt Charts | Excellent |
| Dependency Management | Excellent |
| Critical Path Analysis | Excellent on Business and above |
| Lead and Lag Scheduling | Strong |
| Scheduling Float Analysis | Excellent |
| Baseline Tracking | Excellent |
| Gantt Snapshots | Excellent |
| Resource Management | Strong |
| Advanced Capacity Planning | Excellent on Pinnacle |
| Workflow Customization | Excellent |
| Enterprise Reporting | Excellent on Pinnacle |
| Ease of Initial Configuration | Moderate |
| Small-Team Affordability | Good on Team |
| Pricing Flexibility | Reduced by seat purchasing groups |
Wrike’s Position Among the Best Gantt Chart Software in 2026
Wrike deserves a strong position among the Top 10 Best Gantt Chart Software in the world in 2026 because it combines sophisticated project scheduling with enterprise work management.
The $10-per-user Team plan provides a relatively accessible route into interactive Gantt scheduling, while Business expands the platform with critical-path functionality and greater workflow sophistication. Pinnacle and Apex extend Wrike into resource planning, budgeting, business intelligence, enterprise integration, and AI-powered workflow management.
Wrike is particularly compelling for PMOs, agencies, professional services firms, operations teams, and enterprises managing many simultaneous projects. Its primary trade-off is complexity: organizations may require more configuration and onboarding than they would with lightweight Gantt chart applications.
For businesses that need Gantt charts to operate as part of a broader project, resource, portfolio, and operational management environment, Wrike remains one of the strongest enterprise Gantt chart software options in 2026.
7. Oracle Primavera P6
Oracle Primavera P6 is an enterprise project planning and scheduling platform built for organizations managing large, complex and schedule-critical projects. Rather than functioning primarily as lightweight Gantt chart software, P6 is designed around Critical Path Method scheduling, resource optimization, cost control, earned value management and multi-project planning.
For organizations comparing the best Gantt chart software in 2026, Primavera P6 occupies a specialized position. It is particularly relevant to construction, civil engineering, infrastructure, utilities, oil and gas, energy, manufacturing, aerospace and other capital-intensive industries where delays can have substantial contractual and financial consequences.
Oracle describes P6 Professional as a multiproject planning and control system supporting CPM scheduling, resource leveling, enterprise project structures and simultaneous multi-user access.
Primavera P6 Gantt Chart and Scheduling Capabilities
Primavera P6 combines traditional Gantt visualization with a highly sophisticated scheduling engine. Projects can be structured through Work Breakdown Structures, activities, milestones, calendars, relationships, constraints, resources and cost information.
| Scheduling Capability | Primavera P6 Support | Primary Application |
|---|---|---|
| Gantt Charts | Yes | Visualize complex project schedules |
| Critical Path Method | Yes | Determine schedule-critical activities |
| Multiple Critical Paths | Yes | Analyze several schedule-driving paths |
| Task Dependencies | Yes | Model relationships between activities |
| Lead and Lag | Yes | Model overlaps and waiting periods |
| Resource Leveling | Yes | Resolve resource availability conflicts |
| Project Baselines | Yes | Compare current performance with approved plans |
| Work Breakdown Structures | Yes | Organize large projects hierarchically |
| Earned Value Tracking | Yes | Monitor schedule and cost performance |
| Multi-Project Management | Yes | Coordinate portfolios of related projects |
| Resource-Driven Critical Paths | Yes | Identify resource assignments affecting critical activities |
Oracle’s current P6 Professional documentation confirms CPM scheduling, resource leveling, resource administration and cross-project cost, schedule and earned-value tracking as core capabilities.
Critical Path and Resource Leveling
Critical-path scheduling is one of Primavera P6’s defining strengths.
The scheduling engine calculates activity dates according to dependencies, constraints, calendars and project logic. Project planners can subsequently identify activities whose delays threaten the final completion date.
Resource leveling adds another dimension. Instead of calculating schedules purely from task relationships, Primavera can delay activities when the resources necessary to perform them are unavailable.
Oracle’s 2026 P6 Professional documentation also supports calculating multiple resource-driven critical paths after resource leveling. This helps planners identify not only logically critical activities but also resource assignments contributing to schedule criticality.
Resource Leveling and Traditional CPM
| Scheduling Question | Relevant P6 Capability |
|---|---|
| Which activities determine completion? | Critical Path Method |
| Which activities depend on one another? | Activity Relationships |
| Where are resources overallocated? | Resource Leveling |
| Which resources are driving delays? | Resource-Driven Critical Paths |
| How has the approved schedule changed? | Baselines |
| Is execution ahead or behind schedule? | Earned Value Management |
| How are several projects performing? | Cross-Project Tracking |
Earned Value Management
Primavera’s integration of scheduling and earned value management is another major differentiator.
Earned value calculations allow organizations to compare planned work, completed work and actual project expenditure. These calculations can be aggregated from activities through Work Breakdown Structure levels and ultimately to the overall project.
Oracle’s current documentation confirms that earned-value information can be displayed directly alongside project activities and Gantt charts when an appropriate cost-loaded schedule and earned-value baseline are configured.
This makes Primavera particularly valuable where project managers need to answer questions beyond whether individual activities are late.
| Project Control Question | Primavera Analysis |
|---|---|
| Is the project progressing according to plan? | Schedule performance |
| Is spending aligned with completed work? | Cost performance |
| How does current execution compare with the baseline? | Earned value analysis |
| What work remains? | Estimate-to-complete analysis |
| What is the likely final project cost? | Forecasting metrics |
Baselines and Schedule Control
Baselines allow project controls teams to preserve approved project schedules and subsequently measure how execution deviates from those plans.
This is particularly important for major capital projects where the approved contractual schedule may need to remain available throughout execution.
Oracle Primavera Cloud similarly provides baseline functionality for evaluating performance at different stages of the project lifecycle, including the ability to manage baselines across multiple projects within programs.
Primavera P6 Pricing
Primavera P6 is substantially more expensive than mainstream collaborative Gantt chart applications because Oracle licenses it as professional enterprise project controls software.
The current Oracle Construction and Engineering global price list provides the following licensing figures.
| Oracle Product | License Price | Software Update License and Support |
|---|---|---|
| Primavera P6 Professional Project Management | $2,500 | $550 |
| Primavera P6 Enterprise Project Portfolio Management | $2,750 | $605 |
| Primavera P6 Progress Reporter | $950 | $209 |
| Primavera Risk Analysis | $9,500 | $2,090 |
| Primavera Analytics | $2,000 | $440 |
An important correction to the original description is that the $2,500 figure for P6 Professional should not simply be described as an annual subscription. Oracle’s price list separates the software license from Software Update License and Support. P6 Professional is listed at $2,500 for the license plus $550 for update and support under the applicable licensing metric.
P6 Professional Versus P6 EPPM
P6 Professional and P6 Enterprise Project Portfolio Management address overlapping but different requirements.
| Area | P6 Professional | P6 EPPM |
|---|---|---|
| Detailed Project Scheduling | Excellent | Excellent |
| CPM Scheduling | Yes | Yes |
| Resource Leveling | Yes | Yes |
| Gantt Planning | Yes | Yes |
| Planner and Scheduler Focus | Excellent | Strong |
| Enterprise Administration | More Limited | Strong |
| Multi-User Environment | Supported | Enterprise-Oriented |
| Portfolio Oversight | Strong | More Extensive |
| Web-Based Enterprise Access | Limited | Stronger |
| Large Organization Deployment | Strong | Excellent |
P6 Professional is primarily aimed at professional planners and schedulers, whereas P6 EPPM extends Primavera into broader enterprise project and portfolio administration.
Risk Analysis and Monte Carlo Simulation
One important correction concerns Monte Carlo simulation.
Monte Carlo quantitative risk analysis should not be described as a standard built-in P6 Professional scheduling function. Oracle’s current product comparison shows Monte Carlo Risk Analysis as available in Oracle Primavera Cloud rather than directly within P6 Professional.
P6 schedule and risk information can instead be integrated with Primavera Cloud. Organizations can import P6 project schedules into Primavera Cloud, conduct quantitative risk analysis there and subsequently return relevant risk-analysis results to P6.
Oracle Primavera Cloud uses Monte Carlo simulations to model numerous potential project outcomes based on schedule uncertainty, risks, cost information and other variables.
| Risk Capability | P6 Professional | Primavera Cloud |
|---|---|---|
| Risk Register | Yes | Yes |
| Schedule Risk Information | Yes | Yes |
| Quantitative Risk Analysis | Requires complementary environment | Yes |
| Monte Carlo Simulation | No native equivalent | Yes |
| Probability Distributions | No native equivalent | Yes |
| Risk Sensitivity Analysis | Limited | Yes |
| P6 Schedule Integration | Native schedule | Yes |
Enterprise Scalability
Primavera P6 is designed for multiproject environments where numerous planners and project managers may need access to centralized project information.
P6 Professional supports relational database architectures and simultaneous multi-user project access. Oracle specifically positions the system for enterprise-wide project management scalability and centralized project storage.
This architecture distinguishes Primavera from many SaaS Gantt chart applications designed primarily around individual teams or departmental projects.
Strengths and Limitations
| Area | Assessment |
|---|---|
| Critical Path Scheduling | Excellent |
| Complex Dependency Management | Excellent |
| Resource Leveling | Excellent |
| Baseline Management | Excellent |
| Earned Value Management | Excellent |
| Multi-Project Scheduling | Excellent |
| Enterprise Scalability | Excellent |
| Cost and Schedule Integration | Excellent |
| Quantitative Risk Analysis | Requires Primavera Cloud or complementary risk tools |
| Ease of Learning | Difficult |
| Small-Team Suitability | Poor |
| Entry-Level Affordability | Poor |
| Capital Project Suitability | Excellent |
Who Should Consider Primavera P6?
Primavera P6 is best suited to organizations where project scheduling is a formal project-controls discipline rather than simply a method of visualizing tasks.
Typical use cases include major construction projects, infrastructure programs, power plants, energy developments, manufacturing programs, engineering projects, aerospace programs and other capital-intensive initiatives.
Small marketing teams, startups and general business departments are unlikely to require this level of scheduling sophistication. Such organizations can usually obtain faster adoption and lower costs from mainstream collaborative Gantt platforms.
Oracle Primavera P6’s Position Among the Best Gantt Chart Software in 2026
Oracle Primavera P6 deserves a distinctive position among the Top 10 Best Gantt Chart Software in the world in 2026 because its strengths are fundamentally different from those of mainstream work-management platforms.
While products such as monday.com, ClickUp and Asana emphasize accessibility and collaboration, Primavera P6 focuses heavily on professional scheduling, CPM analysis, resource leveling, earned value, baselines and enterprise-scale project controls.
For ordinary business projects, this sophistication can create unnecessary cost and complexity. For large construction, engineering, infrastructure and capital programs where schedule delays can translate into substantial financial exposure, however, Primavera P6 remains one of the most capable project scheduling systems available.
8. Zoho Projects
Zoho Projects is a cloud-based project management platform designed to help organizations plan projects, coordinate teams, monitor deadlines, track time, manage issues, and automate recurring workflows.
For organizations comparing the Top 10 Best Gantt Chart Software in the world in 2026, Zoho Projects is particularly notable for its price-to-feature ratio. It combines interactive Gantt charts, dependencies, milestones, critical-path analysis, baselines, resource utilization, time tracking, issue management, and automation within the broader Zoho business software ecosystem.
Zoho Projects is used by more than 200,000 customers worldwide, with applications spanning IT services, consulting, engineering, construction, marketing, professional services, and other project-driven industries.
Project Structure and Gantt Chart Capabilities
Zoho Projects organizes work through projects, milestones, task lists, tasks, and subtasks. These activities can subsequently be visualized within interactive Gantt charts, allowing project managers to understand scheduling relationships and identify potential delays.
Its Gantt functionality is available across paid plans, while some of its more sophisticated scheduling features are reserved for higher subscription tiers.
| Gantt Chart Capability | Zoho Projects Support | Project Management Application |
|---|---|---|
| Interactive Gantt Charts | Paid plans | Visual project scheduling |
| Milestones | Yes | Track major project deliverables |
| Task Dependencies | Premium and above | Connect sequential activities |
| Cross-Project Dependencies | Enterprise and above | Coordinate work between projects |
| Critical Path | Enterprise and above | Identify schedule-critical activities |
| Slack Analysis | Enterprise and above | Measure scheduling flexibility |
| Project Baselines | Enterprise and above | Compare actual schedules with original plans |
| Multiple Baselines | Up to 15 per project | Track schedule evolution |
| Resource Utilization | Higher plans | Monitor resource allocation |
| Earned Value Management | Enterprise and Ultimate | Analyze schedule and cost performance |
Task Dependency Management
Zoho Projects provides dependency management directly through its Gantt environment.
Project managers can connect activities where the timing or completion of one task affects another. The platform supports dependency scheduling controls that determine how due dates react when predecessor tasks change.
Dependencies between tasks within the same project are available from Premium upward. Enterprise and Ultimate extend this functionality to dependencies between separate projects.
| Dependency Requirement | Relevant Plan |
|---|---|
| Basic visual scheduling | Paid plans |
| Dependencies within one project | Premium and above |
| Dependencies across different projects | Enterprise and Ultimate |
| Critical-path analysis | Enterprise and above |
| Slack visualization | Enterprise and above |
This distinction is important for organizations comparing pricing because Premium provides strong Gantt functionality but does not contain every advanced scheduling capability available within Zoho Projects.
Critical Path and Slack Analysis
Critical-path functionality is available on the Enterprise plan.
Zoho identifies the longest sequence of dependent activities that determines overall project duration. Tasks on this path require particular attention because delaying them can delay the project’s final completion date.
The Gantt chart also displays slack for non-critical activities. Slack represents the amount of time an activity can be delayed without delaying the overall project.
This provides project managers with a clearer distinction between schedule-critical work and activities where resources can potentially be reassigned.
Baseline Management
Baseline functionality is another significant capability, but it should be attributed to Enterprise rather than Premium.
A baseline captures a snapshot of the project’s original schedule. Project managers can subsequently compare the active schedule against that snapshot to identify delays and deviations.
Zoho Projects currently supports as many as 15 baselines for an individual project.
| Baseline Function | Business Value |
|---|---|
| Original Schedule Snapshot | Preserves an earlier project plan |
| Current vs Baseline Comparison | Identifies scheduling deviations |
| Up to 15 Baselines | Tracks multiple stages of schedule evolution |
| Slippage Analysis | Highlights activities moving beyond planned dates |
| Gantt Integration | Displays schedule differences visually |
This is unusually useful for a relatively affordable project management platform because project managers can retain several historical scheduling reference points rather than relying on a single original plan.
Zoho Projects Pricing in 2026
Zoho Projects remains one of the more affordable established project management platforms. Current independent pricing data places paid subscriptions from approximately $4 per user per month.
The original description requires an important correction regarding the Free plan. Current Zoho documentation states that Free supports three users and one project rather than five users and three projects.
| Plan Tier | Approximate Starting Position | Scheduling Capabilities |
|---|---|---|
| Free | $0 | 3 users, 1 project and basic project management |
| Premium | From approximately $4 per user/month | Interactive Gantt charts, project dependencies and expanded project management |
| Enterprise | Higher paid tier | Baselines, critical path, cross-project dependencies and advanced resource capabilities |
| Ultimate | Highest advanced tier | Enterprise functionality plus expanded advanced capabilities |
Exact regional pricing can vary by country, currency, taxes, contract terms, and billing frequency. Organizations should therefore compare their local Zoho pricing before calculating total deployment costs.
Premium Versus Enterprise
The difference between Premium and Enterprise becomes especially important when Zoho Projects is evaluated specifically as Gantt chart software.
| Capability | Premium | Enterprise |
|---|---|---|
| Interactive Gantt Charts | Yes | Yes |
| Same-Project Dependencies | Yes | Yes |
| Cross-Project Dependencies | No | Yes |
| Critical Path | No | Yes |
| Slack Analysis | No | Yes |
| Baselines | No | Yes |
| Multiple Baselines | No | Up to 15 |
| Advanced Resource Management | More Limited | Yes |
| Earned Value Management | No | Yes |
Premium is therefore suitable for teams primarily requiring affordable Gantt scheduling and dependencies. Enterprise is substantially more appropriate for professional project managers requiring schedule variance, critical-path analysis, resource planning, and cross-project coordination.
Earned Value Management
Zoho Projects has also expanded beyond conventional collaborative project management by incorporating Earned Value Management into its Enterprise and Ultimate user-based plans.
EVM combines scope, schedule, and cost information to help project managers understand whether execution is progressing according to plan.
| EVM Metric | Management Purpose |
|---|---|
| Earned Value | Measures value of completed work |
| Planned Value | Measures planned project progress |
| Actual Cost | Tracks expenditure associated with completed work |
| Cost Performance Index | Evaluates cost efficiency |
| Schedule Performance Index | Evaluates schedule efficiency |
| Cost Variance | Identifies budget performance differences |
| Schedule Variance | Identifies schedule performance differences |
This capability strengthens Zoho Projects as an option for organizations that require more formal project controls without moving immediately to highly specialized enterprise scheduling platforms.
Integration With the Zoho Ecosystem
One of Zoho Projects’ strongest strategic advantages is its position within the broader Zoho software ecosystem.
Organizations already using other Zoho applications can connect project activities with CRM, customer service, finance, analytics, collaboration, and other business processes.
| Business Requirement | Relevant Zoho Environment |
|---|---|
| Project Management | Zoho Projects |
| Customer Relationship Management | Zoho CRM |
| Customer Support | Zoho Desk |
| Analytics and Reporting | Zoho Analytics |
| Business Automation | Zoho Flow |
| Team Collaboration | Zoho Workplace |
| Financial Operations | Zoho Finance Applications |
This makes Zoho Projects particularly attractive to businesses that already operate extensively within the Zoho ecosystem.
Market Reception
Current review data differs substantially from the ratings in the original description.
G2 currently reports Zoho Projects at approximately 4.4 out of 5 rather than 4.7. Capterra reports an overall rating of approximately 4.5 out of 5 from more than 870 reviews rather than 4.6.
| Review Platform | 2026 Rating | Review Volume |
|---|---|---|
| G2 | Approximately 4.4 / 5 | More than 500 reviews |
| Capterra | Approximately 4.5 / 5 | More than 870 reviews |
Review feedback frequently highlights project tracking, task organization, integrated functionality, time tracking, affordability, and team coordination.
Conversely, reviewers sometimes identify interface complexity, limited customization within certain project views, mobile limitations, and a learning curve when configuring more sophisticated workflows.
Strengths and Limitations
| Area | Assessment |
|---|---|
| Gantt Chart Functionality | Strong |
| Task Dependencies | Strong |
| Critical Path | Strong on Enterprise |
| Slack Analysis | Strong on Enterprise |
| Multiple Baselines | Excellent for the price |
| Earned Value Management | Strong |
| Resource Management | Strong |
| Issue Tracking | Strong |
| Time Tracking | Strong |
| Zoho Ecosystem Integration | Excellent |
| Price-to-Feature Ratio | Excellent |
| Free Plan Generosity | Limited |
| Interface Customization | Moderate |
| Ease of Initial Configuration | Moderate |
Zoho Projects’ Position Among the Best Gantt Chart Software in 2026
Zoho Projects deserves consideration among the Top 10 Best Gantt Chart Software in the world in 2026 because it delivers an unusually broad collection of project scheduling and management capabilities at a comparatively accessible price.
Premium provides an economical route into interactive Gantt scheduling and dependency management, while Enterprise significantly increases scheduling sophistication through critical-path analysis, slack calculations, cross-project dependencies, baselines, resource capabilities, and Earned Value Management.
Zoho Projects is therefore particularly compelling for small and mid-sized businesses that have outgrown simple task-management software but do not require the cost and complexity of heavyweight project controls platforms such as Oracle Primavera P6.
For organizations already using the wider Zoho ecosystem, the value proposition becomes even stronger because project schedules can operate as part of a broader integrated business software environment.
9. GanttPRO
GanttPRO is a specialized online project management platform built around interactive Gantt charts. Unlike broader work management systems that treat Gantt charts as one of many optional project views, GanttPRO places visual scheduling, dependencies, project timelines, resources, and schedule control at the center of the user experience.
For organizations comparing the Top 10 Best Gantt Chart Software in the world in 2026, GanttPRO is particularly attractive to project managers, construction teams, consultants, engineering organizations, agencies, and other teams that want powerful Gantt scheduling without the complexity associated with heavyweight enterprise project management platforms.
Its combination of an intuitive interface and sophisticated scheduling functionality makes GanttPRO an interesting middle ground between simple timeline applications and complex systems such as Microsoft Project or Oracle Primavera P6.
Gantt Chart and Scheduling Capabilities
GanttPRO’s core interface provides visual task scheduling through an interactive timeline. Tasks can be created, moved, resized, connected through dependencies, organized hierarchically, and assigned to resources directly within the project schedule.
Its Auto Scheduling functionality automatically recalculates connected task schedules when dates or dependency relationships change. This reduces the manual work required to maintain a project plan when upstream activities are delayed or rescheduled.
| Gantt Chart Capability | GanttPRO Support | Project Management Application |
|---|---|---|
| Interactive Gantt Charts | Yes | Build visual project schedules |
| Drag-and-Drop Scheduling | Yes | Modify project dates quickly |
| Task Dependencies | Yes | Connect related project activities |
| Lead and Lag | Yes | Control gaps and overlaps between tasks |
| Auto Scheduling | Yes | Recalculate dependent task dates |
| Critical Path | Yes | Identify schedule-critical activities |
| Baselines | Yes | Compare current performance with earlier plans |
| Milestones | Yes | Highlight major deadlines |
| Project Calendars | Yes | Configure working schedules |
| Workload Management | Business and above | Analyze resource capacity |
| Portfolio Management | Business and above | Coordinate multiple projects |
| Time Tracking | Business and above | Record time spent on project activities |
Critical Path Management
Critical-path functionality is included within GanttPRO’s project planning environment.
When Critical Path is enabled, the platform identifies the sequence of activities that directly influences the project’s completion date. A delay affecting one of these tasks can consequently affect the overall project deadline.
This functionality is particularly useful for construction, engineering, implementation, product development, and other projects where understanding schedule-critical work is more important than simply viewing task deadlines.
Dependencies and Auto Scheduling
GanttPRO supports multiple dependency relationships as well as lead and lag between connected activities.
Its Auto Scheduling engine is particularly useful when projects contain numerous dependencies. Changing the dates of a predecessor task can trigger automatic recalculation of dependent activities, helping preserve the logical structure of the overall schedule.
| Scheduling Situation | GanttPRO Function |
|---|---|
| Predecessor date changes | Auto Scheduling recalculates connected work |
| Tasks must occur sequentially | Dependencies |
| Tasks require an intentional delay | Lag |
| Activities need to overlap | Lead |
| Completion deadline is threatened | Critical Path |
| Original schedule needs comparison | Baseline |
Baseline Management
GanttPRO also provides baseline functionality for measuring schedule performance.
Project managers can save the initial project plan and subsequently compare it against the current schedule. Importantly, GanttPRO supports creating several baselines over time rather than limiting users to a single historical reference point.
This makes it easier to identify schedule deviations and understand how a project has changed during execution.
Resource and Workload Management
Resource management becomes considerably more sophisticated on the Business plan.
Workload management allows project managers to evaluate resource allocation and identify situations where individual team members have more work assigned than their available capacity.
Business also introduces portfolio management, reporting, budget planning, and time tracking. Consequently, this tier is more suitable for organizations coordinating several projects and shared resources simultaneously.
GanttPRO Pricing in 2026
Current GanttPRO pricing differs from some earlier pricing information. The platform now offers four principal paid plans: Core, Advanced, Business, and Enterprise.
| Plan Tier | Annual Billing Price | Primary Capabilities |
|---|---|---|
| Core | $7 per user/month | Gantt charts, Auto Scheduling, project calendars and virtual resources |
| Advanced | $10 per user/month | Core features plus custom fields, filters, calendar exceptions and custom templates |
| Business | $17 per user/month | Advanced features plus workload management, portfolios, reports, budget planning and time tracking |
| Enterprise | $25 promotional price, normally $35 per user/month | Advanced security, administration, support and enterprise controls |
Therefore, the earlier estimate of approximately $13 for Advanced is no longer accurate. Current annual pricing lists Advanced at $10 per user per month and Business at $17 per user per month.
Enterprise is currently advertised at a promotional $25 per user per month instead of its listed $35 price and requires at least five users on an annual subscription.
Core Versus Advanced Versus Business
GanttPRO’s pricing structure allows organizations to select a tier according to how far their requirements extend beyond Gantt scheduling.
| Capability | Core | Advanced | Business |
|---|---|---|---|
| Gantt Charts | Yes | Yes | Yes |
| Auto Scheduling | Yes | Yes | Yes |
| Dependencies | Yes | Yes | Yes |
| Critical Path | Yes | Yes | Yes |
| Baselines | Yes | Yes | Yes |
| Milestones | Yes | Yes | Yes |
| Unlimited Projects | Yes | Yes | Yes |
| Custom Fields | Limited | Yes | Yes |
| Custom Project Templates | No | Yes | Yes |
| Workload Management | No | No | Yes |
| Portfolio Management | No | No | Yes |
| Reports | No | No | Yes |
| Budget Planning | No | No | Yes |
| Time Tracking | No | No | Yes |
Core therefore provides substantial functionality for teams primarily interested in Gantt scheduling. Advanced becomes useful when greater project customization is required, while Business is considerably better suited to multi-project and resource-intensive environments.
Collaboration and External Project Sharing
Although GanttPRO is primarily scheduling-focused, it also provides collaboration functionality.
Users can communicate through comments, attach files, receive notifications, and share project information. Private project links can be generated when schedules need to be presented to customers or other external stakeholders without providing full project access.
The platform also provides a Communication Hub for centralized collaboration.
Integration Ecosystem
GanttPRO integrates with several widely used productivity and project management applications.
| External Platform | GanttPRO Integration Purpose |
|---|---|
| Microsoft Teams | Notifications and project communication |
| Slack | Notifications and workflow communication |
| Google Drive | Attach and create project files |
| OneDrive | Attach project documents |
| Google Calendar | Calendar synchronization |
| Outlook Calendar | Calendar synchronization |
| Jira Cloud | Project and scheduling synchronization |
| Microsoft Project | Import project files |
| Microsoft Excel | Import spreadsheet project data |
| API | Connect GanttPRO with custom business systems |
The Google Drive integration, for example, allows users to create and attach documents, spreadsheets, drawings, and presentations directly from task settings.
This makes the original characterization of GanttPRO as heavily dependent on external tools for document collaboration partly accurate, but somewhat incomplete. GanttPRO does not attempt to replace a dedicated document suite, yet it can connect project tasks directly with files stored and edited in external collaboration environments.
Market Reception
GanttPRO maintains particularly strong user ratings in 2026.
| Review Platform | Rating | Review Volume |
|---|---|---|
| G2 | 4.8 / 5 | 588 reviews |
Current G2 reviews frequently praise GanttPRO’s intuitive interface, visual timelines, dependency management, ease of project setup, and comparatively short learning curve.
Some reviewers identify pricing and limitations in highly customized workflows as disadvantages. This reflects GanttPRO’s deliberate positioning: it prioritizes accessible project scheduling rather than attempting to become an infinitely configurable Work OS.
Strengths and Limitations
| Area | Assessment |
|---|---|
| Gantt Chart Experience | Excellent |
| Ease of Use | Excellent |
| Auto Scheduling | Excellent |
| Dependency Management | Excellent |
| Critical Path | Excellent |
| Baseline Management | Strong |
| Resource Management | Strong on Business |
| Portfolio Management | Strong on Business |
| Budget Planning | Strong on Business |
| Time Tracking | Available on Business |
| External Schedule Sharing | Strong |
| Enterprise Security | Strong on Enterprise |
| Document Creation | Relies partly on integrations |
| Highly Customized Workflows | More Limited |
| Built-In Communication | Less extensive than full Work OS platforms |
GanttPRO’s Position Among the Best Gantt Chart Software in 2026
GanttPRO deserves a strong position among the Top 10 Best Gantt Chart Software in the world in 2026 because Gantt scheduling is the platform’s primary specialization rather than a secondary feature.
Core starts at $7 per user per month and already provides powerful Gantt charts, Auto Scheduling, dependencies, critical-path functionality, baselines, milestones, and unlimited projects. Advanced expands customization for $10 per user per month, while the $17 Business tier adds workload management, portfolios, reporting, budget planning, and time tracking.
Its primary advantage is focus. Organizations do not need to navigate an extensive Work OS simply to create and maintain professional project schedules. At the same time, GanttPRO provides enough dependency, critical-path, baseline, resource, and portfolio functionality to support considerably more sophisticated projects.
For project managers, construction teams, engineering organizations, agencies, and professional services firms seeking dedicated Gantt chart software with a comparatively short learning curve, GanttPRO is one of the strongest specialized options available in 2026.
10. TeamGantt
TeamGantt is a schedule-first project management platform centered on visual Gantt charts, project timelines, dependencies, resource workloads, and schedule tracking. Unlike broader work management platforms where Gantt charts operate as one optional view, TeamGantt places the project schedule at the center of its workflow.
For organizations comparing the Top 10 Best Gantt Chart Software in the world in 2026, TeamGantt is particularly relevant to construction companies, contractors, agencies, consultants, marketing teams, product teams, and other organizations that prioritize straightforward visual scheduling.
Its 2026 product has also expanded considerably beyond basic Gantt charts, with critical-path analysis, advanced dependencies, baseline reporting, portfolio management, resource planning, financial forecasting, and specialized construction scheduling capabilities.
TeamGantt Gantt Chart Capabilities
TeamGantt uses a visual drag-and-drop scheduling interface that allows project managers to create tasks, establish durations, assign resources, connect dependencies, establish milestones, and adjust schedules directly from the Gantt chart.
When interconnected schedules change, dependency logic helps maintain relationships between activities rather than requiring managers to rebuild downstream schedules manually.
| Gantt Chart Capability | TeamGantt Support | Project Management Application |
|---|---|---|
| Interactive Gantt Charts | Yes | Build visual project schedules |
| Drag-and-Drop Scheduling | Yes | Adjust dates and durations quickly |
| Task Dependencies | Yes | Connect related project activities |
| Four Dependency Types | Yes | Model different scheduling relationships |
| Lead and Lag | Yes | Create overlaps or delays between activities |
| Critical Path | Higher plans | Identify schedule-critical work |
| Milestones | Yes | Track important deadlines |
| Baselines | Business and Builder | Compare planned and actual schedules |
| Workload Management | Paid plans | Monitor resource capacity |
| Portfolio Management | Business and above | Monitor multiple projects |
| Lookahead Scheduling | Builder or add-on | Coordinate short-term execution |
| Material Lead-Time Tracking | Builder | Coordinate procurement with installation |
Advanced Dependency Management
TeamGantt now supports Finish-to-Start, Start-to-Start, Finish-to-Finish, and Start-to-Finish dependencies.
Custom lead and lag periods provide additional scheduling control. This allows project managers to model situations where activities must overlap or where a waiting period must occur between interconnected tasks.
Connected activities can automatically adjust when project dates change, reducing the manual schedule maintenance required when delays occur.
| Scheduling Requirement | TeamGantt Capability |
|---|---|
| Sequential activities | Finish-to-Start |
| Activities beginning together | Start-to-Start |
| Activities completing together | Finish-to-Finish |
| Completion triggering another start | Start-to-Finish |
| Waiting period between activities | Lag |
| Intentional activity overlap | Lead |
| Schedule-driving activities | Critical Path |
Critical Path and Baseline Management
TeamGantt’s newer scheduling environment includes critical-path analysis, helping project managers identify the activities that directly influence final project completion.
Baseline functionality provides another important project-control layer. Project managers can preserve schedule snapshots and compare planned timelines against actual execution.
TeamGantt supports multiple baseline sets rather than restricting a project to a single baseline. Managers can therefore preserve different schedule states and identify which activities were completed early, on schedule, or late.
Construction Scheduling Capabilities
TeamGantt has developed a particularly strong specialization around construction scheduling through its Builder Edition.
The platform connects the master Gantt schedule with lookahead planning, subcontractor coordination, material procurement, workload management, and financial forecasting.
| Construction Capability | Practical Application |
|---|---|
| Lookahead Scheduling | Generate focused 2-to-6-week execution schedules |
| Material Lead Times | Connect procurement dates with installation activities |
| Subcontractor Confirmation | Obtain schedule confirmation without requiring logins |
| Crew Workload Management | Identify overbooked or available crews |
| Equipment Workloads | Monitor equipment allocation across projects |
| Cost-Loaded Scheduling | Associate project costs with scheduled activities |
| Financial Forecasting | Forecast project cash flow |
| RACI Assignments | Clarify project responsibility |
| Lockable Milestones | Protect important schedule dates |
| Procore Integration | Synchronize schedules with construction workflows |
Lookahead Scheduling
Lookahead planning is particularly useful for construction teams that need to translate a long-term master schedule into shorter operational planning windows.
TeamGantt can generate lookahead schedules covering approximately two to six weeks directly from the live project schedule. Project managers can filter upcoming activities according to criteria such as trade, crew, labels, or milestones.
This keeps short-term field planning connected with the overall project schedule rather than maintaining separate spreadsheets or static documents.
Subcontractor Schedule Confirmation
TeamGantt also addresses a common construction scheduling problem: confirming whether subcontractors can actually meet planned dates.
Schedule updates can be distributed by email or text. Subcontractors can confirm proposed dates or identify conflicts without requiring a TeamGantt account.
| Traditional Coordination | TeamGantt Approach |
|---|---|
| Phone calls to subcontractors | Digital schedule confirmation |
| Static PDF schedules | Live schedule links |
| Manual confirmation tracking | Confirmation status within schedule |
| Separate field spreadsheets | Lookaheads generated from master schedule |
| Manual material spreadsheets | Lead times linked to installation tasks |
| Independent crew calendars | Cross-project workload visibility |
TeamGantt Pricing in 2026
The original pricing description captures Builder Edition accurately but omits TeamGantt’s lower-priced Basic and Business plans.
TeamGantt currently uses project-based pricing rather than the conventional per-user licensing structure adopted by many competing Gantt platforms.
| Plan | Starting Price | Included Capacity | Key Capabilities |
|---|---|---|---|
| Basic | $24/month or $240/year | 2 projects, 1 manager, 10 collaborators | Core project scheduling and collaboration |
| Business | $120/month or $1,140/year | 5 projects, unlimited managers and collaborators | Advanced scheduling, workload, portfolio and project controls |
| Builder Edition | $199/month or $1,908/year | 10 projects, unlimited managers, collaborators and tasks | Business features plus specialized construction capabilities |
| Enterprise | Custom | Unlimited projects and tasks | Advanced reporting, forecasting and enterprise capabilities |
Annual subscriptions currently provide approximately 20% savings compared with standard monthly billing.
Builder Edition Pricing
Builder Edition is particularly interesting because pricing does not increase according to the number of users.
At $199 per month, or $1,908 when purchased annually, it includes 10 projects together with unlimited managers, collaborators, and tasks.
| Builder Edition Metric | Included Capacity |
|---|---|
| Starting Monthly Price | $199 |
| Annual Price | $1,908 |
| Included Projects | 10 |
| Managers | Unlimited |
| Collaborators | Unlimited |
| Tasks per Project | Unlimited |
| Personalized Onboarding | Included |
| Additional Projects | Available |
This structure can produce a meaningful cost advantage for construction companies involving many employees, subcontractors, clients, and external stakeholders because access is not priced individually for every participant.
Business Versus Builder Edition
Builder Edition includes everything available within Business while adding functionality specifically designed around construction scheduling.
| Capability | Business | Builder Edition |
|---|---|---|
| Interactive Gantt | Yes | Yes |
| Critical Path | Yes | Yes |
| Advanced Dependencies | Yes | Yes |
| Workload Management | Yes | Yes |
| Portfolio Management | Yes | Yes |
| Time Tracking | Yes | Yes |
| Financial Forecasting | Yes | Yes |
| Lookahead Scheduling | Limited/Add-on | Yes |
| Material Delay Prevention | No | Yes |
| Schedule Confirmation | No | Yes |
| Procore Synchronization | No | Yes |
| RACI Assignments | No | Yes |
| Lockable Milestones | No | Yes |
| Construction-Specific Workflow | No | Yes |
Integration With Existing Project Systems
TeamGantt does not necessarily need to replace an organization’s existing enterprise project scheduling environment.
Construction organizations can import schedules from Microsoft Project, Primavera P6, and CSV files. TeamGantt schedules can also be synchronized with Procore.
This creates an interesting use case for larger organizations: a detailed master schedule can originate within a more complex scheduling environment, while TeamGantt provides a more accessible operational layer for field coordination, subcontractors, lookaheads, and everyday schedule communication.
Market Reception
TeamGantt maintains strong user satisfaction across major software review platforms.
| Review Platform | Rating |
|---|---|
| G2 | 4.8 / 5 |
| GetApp | 4.6 / 5 |
| Capterra | 4.6 / 5 |
Its principal appeal is usability. TeamGantt deliberately emphasizes straightforward schedule management rather than attempting to replicate every function of heavyweight enterprise project management software.
Strengths and Limitations
| Area | Assessment |
|---|---|
| Gantt Chart Experience | Excellent |
| Ease of Use | Excellent |
| Dependency Management | Excellent |
| Critical Path | Strong |
| Baseline Management | Strong |
| Workload Management | Strong |
| Construction Scheduling | Excellent |
| Lookahead Planning | Excellent |
| Subcontractor Coordination | Excellent |
| Material Lead-Time Tracking | Excellent |
| Pricing for Large Teams | Excellent |
| Portfolio Management | Strong |
| Enterprise Financial Management | Moderate |
| Earned Value Management | Limited |
| Highly Complex CPM Scheduling | More Limited |
TeamGantt’s Position Among the Best Gantt Chart Software in 2026
TeamGantt deserves consideration among the Top 10 Best Gantt Chart Software in the world in 2026 because it maintains a strong focus on schedule clarity while steadily expanding its professional project-control capabilities.
Its biggest differentiator is its combination of accessible Gantt scheduling and project-based rather than per-seat pricing. This becomes particularly compelling for organizations involving many employees, clients, contractors, or subcontractors.
Builder Edition strengthens that proposition for construction companies. For $199 per month, organizations receive 10 projects with unlimited managers, collaborators, and tasks alongside lookahead scheduling, material lead-time management, subcontractor confirmations, resource workloads, critical-path analysis, baselines, and financial forecasting.
TeamGantt is less appropriate for organizations requiring highly sophisticated Earned Value Management, enterprise financial modeling, or Primavera-level CPM controls. However, for teams that prioritize understandable schedules, rapid adoption, straightforward collaboration, and predictable pricing, TeamGantt is one of the strongest Gantt-focused platforms available in 2026.
Conclusion
Choosing the best Gantt chart software in 2026 depends on the complexity of the projects being managed, team size, scheduling requirements, collaboration needs, resource planning demands, and available budget. Modern Gantt chart platforms have evolved far beyond simple timeline visualization, with leading solutions now incorporating task dependencies, critical path analysis, workload management, project baselines, automation, portfolio management, time tracking, and enterprise reporting.
The ten leading platforms covered in this guide—Smartsheet, Microsoft Project, monday.com, ClickUp, Asana, Wrike, Oracle Primavera P6, Zoho Projects, GanttPRO, and TeamGantt—serve distinctly different project management requirements.
Smartsheet combines spreadsheet familiarity with powerful enterprise work management, while Microsoft Project remains a strong choice for professional project managers requiring sophisticated scheduling and Critical Path Method capabilities. monday.com, ClickUp, and Asana are particularly suitable for organizations seeking modern, collaborative project management environments that extend beyond traditional Gantt charts.
Wrike provides advanced work management and resource planning for complex enterprise operations, while Oracle Primavera P6 remains one of the most specialized options for construction, engineering, infrastructure, energy, and other large-scale capital projects. Zoho Projects offers an attractive balance between affordability and advanced scheduling capabilities, particularly for organizations already using the wider Zoho ecosystem.
For teams primarily interested in dedicated Gantt chart functionality, GanttPRO delivers a focused and intuitive scheduling experience without the complexity of a full enterprise Work OS. TeamGantt similarly emphasizes visual project scheduling while offering particularly useful capabilities for construction teams, contractors, agencies, and organizations involving large numbers of external collaborators.
Ultimately, there is no single best Gantt chart software for every organization. Smaller teams may prioritize affordability, simplicity, and rapid deployment, while growing businesses may require automation, workload management, and multi-project reporting. Large enterprises and project management offices are more likely to prioritize resource optimization, governance, portfolio management, baselines, critical-path scheduling, and integrations with existing business systems.
Before selecting a platform, organizations should evaluate not only subscription pricing but also the total cost of implementation, training, integrations, advanced features, and additional user licenses. Testing shortlisted platforms against real project schedules can also reveal whether their workflows, dependency controls, reporting tools, and resource-management capabilities match actual operational requirements.
As project environments become increasingly complex and distributed in 2026, the best Gantt chart software can provide much more than an attractive project timeline. When properly selected and implemented, it can become a central planning system that improves schedule visibility, identifies potential delays earlier, coordinates resources more effectively, and helps teams deliver projects on time and with greater predictability.
If you find this article useful, why not share it with your hiring manager and C-level suite friends and also leave a nice comment below?
We, at the 9cv9 Research Team, strive to bring the latest and most meaningful data, guides, and statistics to your doorstep.
To get access to top-quality guides, click over to 9cv9 Blog.
To hire top talents using our modern AI-powered recruitment agency, find out more at 9cv9 Modern AI-Powered Recruitment Agency.
People Also Ask
What is the best Gantt chart software in 2026?
Smartsheet is one of the best Gantt chart software options in 2026, particularly for organizations needing dependencies, critical paths, baselines, automation, dashboards, resource management, and enterprise collaboration.
What are the top Gantt chart software tools in 2026?
Leading options include Smartsheet, Microsoft Project, monday.com, ClickUp, Asana, Wrike, Oracle Primavera P6, Zoho Projects, GanttPRO, and TeamGantt.
What is Gantt chart software?
Gantt chart software visually displays project tasks across a timeline, helping teams manage start dates, deadlines, milestones, dependencies, resources, progress, and project schedules.
Why should businesses use Gantt chart software?
Gantt chart software helps businesses visualize project schedules, identify dependencies, coordinate resources, detect delays, track milestones, and understand how individual tasks affect overall project completion.
What features should the best Gantt chart software have?
The best Gantt chart tools should offer dependencies, milestones, drag-and-drop scheduling, critical path analysis, baselines, resource management, workload planning, collaboration, reporting, and automation.
What is the best free Gantt chart software in 2026?
ClickUp is a strong free option because its Free Forever plan provides limited Gantt functionality alongside task management, collaboration, documents, and other project management features.
What is the best Gantt chart software for small businesses?
ClickUp, Zoho Projects, GanttPRO, and TeamGantt are strong choices for small businesses because they combine accessible project scheduling with comparatively affordable pricing and straightforward interfaces.
What is the best Gantt chart software for large enterprises?
Smartsheet, Microsoft Project, Wrike, and Oracle Primavera P6 are strong enterprise options because they provide advanced scheduling, governance, resource management, reporting, and portfolio capabilities.
What is the best Gantt chart software for construction projects?
Oracle Primavera P6 and TeamGantt are strong choices for construction. Primavera P6 excels at complex CPM scheduling, while TeamGantt provides accessible construction scheduling, lookahead planning, and subcontractor coordination.
What is the best Gantt chart software for engineering projects?
Oracle Primavera P6 and Microsoft Project are particularly suitable for engineering projects requiring detailed dependencies, critical path analysis, baselines, resource planning, and complex schedule management.
What is the easiest Gantt chart software to use?
GanttPRO and TeamGantt are among the easiest Gantt-focused platforms to learn because both emphasize visual, drag-and-drop scheduling without requiring users to navigate an extensive enterprise Work OS.
What is the most affordable Gantt chart software?
Zoho Projects, ClickUp, and GanttPRO offer competitively priced Gantt functionality. The best value depends on team size and whether advanced features such as critical paths, baselines, portfolios, and workload planning are required.
Is Microsoft Project still worth using in 2026?
Yes. Microsoft Project remains valuable for professional project managers and PMOs requiring advanced dependencies, critical path scheduling, baselines, resource planning, budgeting, and detailed project controls.
Is Smartsheet good for Gantt charts?
Yes. Smartsheet combines interactive Gantt charts with dependencies, critical path tracking, baselines, automation, dashboards, workload management, and spreadsheet-style project data management.
Does monday.com have Gantt charts?
Yes. monday.com provides interactive Gantt functionality on eligible paid plans, allowing teams to visualize schedules, manage dependencies, track milestones, adjust dates, and connect project timelines with broader workflows.
Does ClickUp have Gantt charts?
Yes. ClickUp provides Gantt charts with dependencies, milestones, automatic rescheduling, critical path analysis, Slack Time, resource management, and other project planning capabilities.
Does Asana have Gantt charts?
Yes. Asana provides Gantt and Timeline views for visual scheduling. Teams can manage dependencies, milestones, deadlines, critical paths, and cross-functional projects within its broader work management environment.
Is Wrike good for Gantt chart project management?
Yes. Wrike provides interactive Gantt charts, dependencies, critical path analysis, lead and lag scheduling, baselines, Gantt snapshots, workload planning, and enterprise work management.
Is Oracle Primavera P6 better than Microsoft Project?
Primavera P6 is generally stronger for highly complex capital and infrastructure projects, while Microsoft Project can be more accessible for conventional enterprise project management. The better choice depends on scheduling complexity.
What is the best dedicated Gantt chart software?
GanttPRO is one of the strongest dedicated Gantt chart platforms because it focuses on visual scheduling, dependencies, auto-scheduling, critical paths, baselines, milestones, and resource management.
Is TeamGantt suitable for construction companies?
Yes. TeamGantt offers construction-oriented features including lookahead schedules, subcontractor coordination, material lead-time tracking, workload planning, critical paths, baselines, and visual Gantt scheduling.
What is critical path analysis in Gantt chart software?
Critical path analysis identifies the sequence of dependent tasks that determines the earliest possible project completion date. Delaying a critical activity can potentially delay the entire project.
What are task dependencies in a Gantt chart?
Task dependencies define relationships between project activities. They determine when one task can start or finish based on the scheduling or completion of another task.
What is a Gantt chart baseline?
A baseline records an approved or original project schedule. Project managers can compare the live schedule against the baseline to identify delays, schedule changes, and differences between planned and actual progress.
Can Gantt chart software automatically reschedule tasks?
Yes. Many modern Gantt platforms can automatically shift dependent tasks when predecessor dates change, helping project managers maintain scheduling relationships without manually updating every connected activity.
Can Gantt chart software manage team workloads?
Yes. Platforms such as Smartsheet, monday.com, ClickUp, Asana, Wrike, GanttPRO, and TeamGantt provide workload or resource management capabilities, although availability varies by subscription tier.
What is the difference between a Gantt chart and a project timeline?
A project timeline primarily visualizes when activities occur. A Gantt chart typically adds task durations, dependencies, milestones, hierarchical structures, progress tracking, and potentially critical path information.
What is the difference between Gantt chart software and project management software?
Gantt chart software emphasizes timeline-based scheduling, while project management software may also include tasks, documents, communication, budgets, resources, automation, reporting, portfolios, and workflows.
How do I choose the best Gantt chart software?
Compare scheduling depth, dependencies, critical path functionality, baselines, resource management, collaboration, integrations, automation, pricing, usability, portfolio features, and scalability against actual project requirements.
Is Gantt chart software worth using in 2026?
Yes. Gantt chart software remains valuable for projects involving multiple tasks, dependencies, deadlines, resources, and stakeholders because it provides a clear visual representation of how project activities connect over time.
Sources
Research and Markets Fortune Business Insights The Business Research Company Straits Research Grand View Research Market Data Forecast Mordor Intelligence CollabCRM Breeze Teamhood Celoxis G2 TeamGantt Rewardio Spendflo Lark RealCost Labs WorkflowAces 5day edison365 Softbliq ProjectManager Capterra Morningmate monday.com Plutio Asana TaskRhino SmartSuite Wrike Hackceleration Clue SmartPM SaaSrat Zoho Kanbanchi ProofHub GenzFrontir Guideflow SoftSnoop