


")


")


Key Takeaways
- The best database monitoring software in 2026 combines observability, AI-driven insights, and low-overhead monitoring to manage complex cloud and hybrid environments.
- Leading tools go beyond basic metrics by linking database performance with applications, infrastructure, and user experience for faster root cause analysis.
- Choosing the right database monitoring platform improves uptime, optimizes query performance, and delivers long-term ROI through proactive performance management.
Databases sit at the very heart of modern digital businesses. From powering customer-facing applications and e-commerce platforms to supporting analytics, artificial intelligence, and mission-critical enterprise systems, databases are no longer back-office components. In 2026, database performance, availability, and reliability directly influence user experience, revenue generation, and business continuity. As data volumes grow and architectures become more distributed, database monitoring has evolved into a strategic requirement rather than a technical afterthought.

The rapid shift toward cloud-native systems, microservices, and hybrid or multi-cloud environments has fundamentally changed how databases operate. Traditional monolithic databases running in predictable environments are increasingly replaced or complemented by managed cloud databases, distributed data stores, and specialized engines designed for scale and performance. While these modern architectures offer flexibility and speed, they also introduce new risks. A single slow query, misconfigured connection pool, or unexpected workload spike can cascade across applications and services, leading to outages or degraded user experiences.
Why Database Monitoring Is Critical in 2026
In 2026, database monitoring is no longer limited to tracking CPU usage, memory consumption, or disk I/O. Modern monitoring tools must provide real-time insight into query performance, connection behavior, replication health, and resource utilization while also explaining how database issues impact applications and end users. Organizations now expect monitoring platforms to answer complex questions quickly, such as why a specific user transaction is slow, which query caused a performance bottleneck, or how a database issue affects revenue-generating workflows.
The increasing complexity of data environments has also raised the cost of failure. Downtime or poor database performance can result in lost transactions, reduced productivity, and long-term reputational damage. As a result, businesses are investing heavily in tools that help them detect issues early, diagnose root causes faster, and optimize performance proactively rather than reactively.
The Evolution from Monitoring to Observability
One of the most significant shifts shaping database monitoring in 2026 is the move toward observability. Instead of viewing databases in isolation, leading platforms now correlate database metrics with application traces, logs, and infrastructure data. This unified view enables teams to understand not just what is failing, but why it is failing within the broader system context.
Observability-driven database monitoring reduces mean time to resolution, minimizes alert fatigue, and supports proactive performance management. By connecting database behavior to application performance and user experience, organizations can prioritize fixes based on real business impact rather than raw technical metrics alone.
The Role of AI and Automation in Database Monitoring
Artificial intelligence and machine learning have become defining features of the best database monitoring software in 2026. AI-powered tools automatically detect anomalies, establish intelligent baselines, predict performance issues, and recommend query or configuration optimizations. These capabilities dramatically reduce the manual effort required to manage complex database environments and help teams prevent incidents before they occur.
AI-driven monitoring also plays a critical role in cost optimization. By identifying inefficient queries, overprovisioned resources, and unused indexes, modern tools help organizations improve performance while controlling infrastructure spend. For teams managing large-scale or cloud-based databases, this level of automation is essential for maintaining efficiency at scale.
Challenges Facing Modern Database Teams
Database administrators, DevOps engineers, and platform teams face mounting challenges in 2026. They must support multiple database technologies simultaneously, manage workloads across on-premises and cloud environments, and respond to performance issues in real time. At the same time, teams are under pressure to move faster, support continuous deployment, and ensure near-zero downtime.
Traditional monitoring tools often fall short in these environments. They may lack support for modern databases, struggle to scale, or provide fragmented views that slow down troubleshooting. This gap has driven demand for more advanced, flexible, and intelligent database monitoring platforms that can adapt to evolving architectures.
What This Guide Covers
This guide to the Top 10 Best Database Monitoring Software in 2026 is designed to help IT leaders, database administrators, DevOps teams, and engineering managers navigate an increasingly crowded and complex market. It focuses on tools that deliver real-world value through strong performance visibility, low operational overhead, scalability, and intelligent automation.
Rather than highlighting features in isolation, this guide examines how each solution supports modern use cases, including cloud and hybrid deployments, microservices architectures, and diverse database ecosystems. It also considers pricing models, ease of use, and overall suitability for organizations of different sizes and technical maturity levels.
How to Choose the Right Database Monitoring Software
Selecting the right database monitoring solution in 2026 requires balancing several factors. Organizations must consider not only feature depth, but also total cost of ownership, deployment complexity, performance impact, and long-term scalability. A tool that works well for a small environment may struggle at enterprise scale, while a powerful enterprise platform may be overly complex for smaller teams.
The best database monitoring software is the one that aligns with an organization’s architecture, skill set, and business goals. Some teams prioritize deep observability and advanced AI capabilities, while others value simplicity, affordability, or open-source flexibility. Understanding these priorities is essential to making an informed decision.
Setting the Stage for the Top 10
The tools featured in this guide represent the strongest database monitoring solutions available in 2026. Each has earned its place by addressing the realities of modern data environments and delivering measurable improvements in performance, reliability, and operational efficiency.
As data continues to grow in volume, velocity, and business importance, investing in the right database monitoring software is no longer optional. It is a foundational step toward building resilient, high-performing systems that can support innovation and growth in 2026 and beyond.
Before we venture further into this article, we would like to share who we are and what we do.
About 9cv9
9cv9 is a business tech startup based in Singapore and Asia, with a strong presence all over the world.
With over nine years of startup and business experience, and being highly involved in connecting with thousands of companies and startups, the 9cv9 team has listed some important learning points in this overview of the Top 10 Best Database Monitoring Software in 2026.
If you like to get your company listed in our top B2B software reviews, check out our world-class 9cv9 Media and PR service and pricing plans here.
Top 10 Best Database Monitoring Software in 2026
- Datadog
- SolarWinds Database Performance Analyzer
- Oracle Enterprise Manager
- IBM Instana Observability
- ManageEngine Applications Manager
- Prometheus and Grafana
- Site24x7
- New Relic
- AppDynamics
- SigNoz
1. Datadog

Datadog is widely regarded as one of the most advanced database monitoring solutions available for modern cloud and hybrid environments. Its position among the Top 10 Best Database Monitoring Software in 2026 is driven by its ability to connect database performance directly with application behavior, infrastructure health, and business impact, all within a single unified observability platform.
Core Database Monitoring Capabilities and Practical Value
Datadog provides deep, real-time visibility into database performance by continuously tracking query execution times, query throughput, wait events, and resource contention. It enables teams to quickly identify long-running or inefficient queries and understand exactly how those queries affect application response times and user experience. By linking database metrics directly to application traces, engineering teams can move beyond surface-level monitoring and pinpoint the exact code paths responsible for performance degradation. This level of correlation significantly reduces troubleshooting time and improves incident response quality.
Integration Coverage and Stack-Wide Visibility
One of Datadog’s strongest advantages is its extensive integration ecosystem, which includes more than 450 native integrations. From a database monitoring perspective, it supports widely used systems such as MySQL, PostgreSQL, MongoDB, Redis, Oracle, and Azure SQL Managed Instance. This broad compatibility allows organizations to monitor heterogeneous database environments alongside cloud platforms, containers, orchestration layers, and third-party services. As a result, Datadog functions not only as a database monitoring tool, but as a centralized observability layer across the entire technology stack.
AI-Driven Insights and Intelligent Recommendations
Datadog continues to strengthen its machine learning and automation capabilities. Its anomaly detection engine automatically identifies unusual patterns in database behavior, helping teams surface performance issues before they escalate into outages. The Database Monitoring Recommendations feature adds further value by highlighting high-impact blocking queries, inefficient indexing strategies, and unused indexes. These insights are prioritized by severity and accompanied by clear next steps, allowing teams to focus on fixes that deliver the greatest performance gains with minimal effort.
Enterprise-Grade Scalability and Cloud-Native Design
Designed for large-scale, cloud-native systems, Datadog performs well in containerized and Kubernetes-based environments where database workloads are dynamic and distributed. Enhancements in Kubernetes monitoring and synthetic testing further strengthen its ability to support complex microservices architectures. This makes the platform particularly well suited for enterprises running mission-critical applications with high availability and performance requirements.
Pricing Structure and Cost Considerations
Datadog uses a modular, usage-based pricing model that scales with infrastructure size, data volume, and enabled features. While this provides flexibility, it can also result in high overall costs for large deployments. Pricing typically starts at approximately $15 per host per month for infrastructure monitoring and around $31 per host per month for application performance monitoring, with additional costs for logs, custom metrics, and indexed traces. As environments grow, annual spend can range from tens of thousands to well over a million dollars, making cost management an important consideration for finance and engineering teams.
User Satisfaction and Market Perception
Despite frequent concerns around pricing complexity and total cost of ownership, Datadog consistently receives strong user ratings across enterprise review platforms. High satisfaction scores indicate that organizations value the platform’s depth, reliability, and operational impact. Many users report that the ability to prevent outages, optimize performance, and streamline incident management delivers a return on investment that outweighs the licensing costs, particularly in complex, large-scale environments.
Agent Performance and System Overhead
Datadog Database Monitoring runs on top of the Datadog Agent, which is optimized to minimize performance impact on monitored systems. Typical overhead is low, with average CPU usage around one to two percent, memory consumption near 300 MB of RAM, and minimal network usage. Database query overhead is reported to be approximately one percent of CPU time, making it suitable for production environments without introducing significant monitoring-related risk.
Database Support Overview Table
Database Type | Supported
MySQL | Yes
PostgreSQL | Yes
MongoDB | Yes
Redis | Yes
Oracle | Yes
Azure SQL Managed Instance | Yes
Feature Impact Matrix
Feature Area | Operational Impact | Business Value
Query Performance Tracking | Faster issue detection | Reduced downtime
Trace-to-Query Correlation | Precise root cause analysis | Lower MTTR
AI Anomaly Detection | Proactive monitoring | Fewer critical incidents
Recommendation Engine | Guided optimization | Improved database efficiency
Wide Integrations | Unified observability | Lower tooling complexity
Why Datadog Ranks Among the Best in 2026
Datadog earns its place among the top database monitoring platforms by combining deep technical insight, intelligent automation, and unmatched ecosystem breadth. While its pricing model may be best suited for mid-to-large enterprises, the platform delivers substantial operational benefits for organizations that require end-to-end visibility, rapid troubleshooting, and scalable observability across modern, distributed systems.
2. SolarWinds Database Performance Analyzer
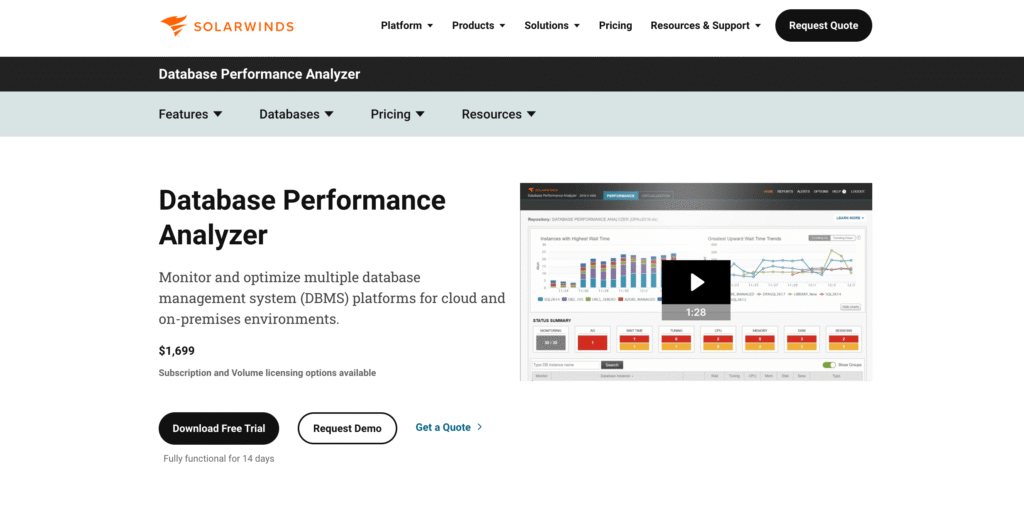
SolarWinds Database Performance Analyzer is widely regarded as one of the most reliable and cost-effective database monitoring solutions for modern enterprises. Its inclusion among the Top 10 Best Database Monitoring Software in 2026 is driven by its deep focus on database performance, low operational overhead, and strong support for both on-premise and cloud-based database environments.
Platform Focus and Database-Centric Monitoring Strength
SolarWinds Database Performance Analyzer is designed specifically for teams whose primary responsibility is database reliability and efficiency. Rather than spreading focus across broad infrastructure monitoring, the platform concentrates on what matters most to Database Administrators and DevOps teams: query performance, wait events, locking issues, and resource contention. This database-first design allows users to quickly understand why a database is slow, which queries are causing problems, and what actions will deliver the highest performance improvements.
Advanced Query Analysis and Root Cause Diagnostics
The software provides detailed visibility into SQL query behavior, breaking down performance issues into understandable wait types such as CPU, I/O, memory, and locking. Its built-in machine learning engine continuously analyzes historical performance data, learning what “normal” looks like over time. As a result, it can automatically detect anomalies and highlight unusual performance patterns before they become critical outages. Root cause analysis is simplified through clear visual timelines and query comparisons, allowing teams to resolve issues faster and with greater confidence.
Expert Recommendations and Performance Optimization Guidance
A key differentiator of SolarWinds DPA is its advisory system. The platform includes built-in query advisors and table tuning recommendations that guide users toward practical optimization steps. Instead of only showing raw metrics, it explains why a query is inefficient and how it can be improved. This makes the tool valuable not only for senior DBAs but also for less experienced team members who need actionable guidance rather than complex diagnostic data.
Broad Database and Cloud Platform Coverage
SolarWinds DPA supports a wide range of database engines across both traditional and cloud environments. This allows organizations to monitor diverse database estates from a single interface, reducing tooling complexity and operational overhead.
Supported Database Platforms Table
Database Platform | Supported
Oracle | Yes
SQL Server | Yes
MySQL | Yes
PostgreSQL | Yes
MariaDB | Yes
Db2 | Yes
SAP ASE | Yes
Azure SQL Database | Yes
Amazon Aurora | Yes
Amazon RDS | Yes
Pricing Accessibility and Cost Efficiency
One of the reasons SolarWinds DPA remains popular in 2026 is its straightforward and comparatively affordable pricing. Annual licensing typically falls between $2,000 and $3,000, which many organizations find significantly lower than enterprise observability platforms with similar database capabilities. Pricing tends to become more attractive as the number of monitored instances increases, making it suitable for growing environments. Users commonly rate its pricing value positively, particularly when evaluating long-term return on investment.
User Satisfaction and Real-World Adoption Feedback
User feedback consistently highlights SolarWinds DPA’s ease of use, fast problem identification, and strong real-time visibility. Review data shows high satisfaction scores, with a strong concentration of four-star and five-star ratings. Users frequently praise the ability to monitor multiple databases from a single dashboard and resolve performance issues quickly. Some feedback points to slower feature innovation and training limitations, but these concerns are often outweighed by the platform’s reliability and focused performance capabilities.
Agentless Architecture and Minimal System Overhead
SolarWinds DPA operates using an agentless architecture, which significantly simplifies deployment and reduces ongoing maintenance. This design also results in extremely low system impact, with reported overhead typically at or below one percent. For organizations running mission-critical databases, this low resource consumption is a major advantage. The monitoring tool does not compete with production workloads, ensuring stable performance even under heavy database usage.
Operational Impact and Value Matrix
Capability Area | Technical Benefit | Business Outcome
Wait-Based Analysis | Faster root cause detection | Reduced downtime
Machine Learning Insights | Early anomaly detection | Fewer incidents
Query Advisors | Clear optimization guidance | Improved performance efficiency
Agentless Design | Minimal resource usage | Lower total cost of ownership
Multi-Database Support | Centralized visibility | Simplified operations
Why SolarWinds DPA Stands Out in 2026
SolarWinds Database Performance Analyzer earns its position among the leading database monitoring tools by combining deep database expertise, intelligent automation, and a cost-efficient licensing model. Its focus on low overhead, actionable insights, and broad database support makes it especially attractive for organizations that prioritize performance stability and operational efficiency. For teams seeking a dedicated, database-centric monitoring solution without the complexity and cost of larger observability platforms, SolarWinds DPA remains a strong and dependable choice in 2026.
3. Oracle Enterprise Manager

Oracle Enterprise Manager is widely recognized as one of the most powerful and comprehensive database monitoring and management platforms for organizations that rely heavily on Oracle technologies. Its position among the Top 10 Best Database Monitoring Software in 2026 is driven by its deep native integration with Oracle databases, advanced diagnostics, and enterprise-grade control over large and complex database estates.
Oracle-Centric Design and Unified Database Control
Oracle Enterprise Manager is purpose-built for monitoring and managing Oracle databases across on-premises, cloud, and engineered systems such as Exadata. It allows organizations to manage entire database fleets from a centralized console, grouping databases logically and performing bulk operations at scale. This centralized control is especially valuable for large enterprises running hundreds or thousands of Oracle databases, where consistency, governance, and operational efficiency are critical.
Deep Performance Visibility and Native Diagnostics
The platform delivers detailed performance summaries that go beyond surface-level metrics. It provides clear insights into database time, active sessions, I/O bandwidth, and throughput, allowing teams to understand how workloads consume resources over time. Oracle Enterprise Manager integrates tightly with Oracle’s native diagnostic tools, including Automatic Database Diagnostic Monitor, Automatic Workload Repository, and Active Session History. These tools enable deep analysis of performance bottlenecks at a level that third-party tools often cannot match, making OEM particularly effective for complex tuning and troubleshooting scenarios.
Automated SQL Tuning and Intelligent Recommendations
A major strength of Oracle Enterprise Manager is its SQL Tuning Advisor, which automatically analyzes SQL statements and provides concrete optimization recommendations. Instead of requiring manual investigation, the platform identifies inefficient queries, suggests index improvements, and highlights execution plan issues. This automation reduces the workload on database administrators while improving overall database performance and stability.
Provisioning, Patching, and Lifecycle Automation
Beyond monitoring, Oracle Enterprise Manager supports automated provisioning, cloning, and patching of databases. These lifecycle management capabilities help organizations reduce human error, enforce standards, and accelerate deployment cycles. For enterprises operating in regulated or mission-critical environments, this level of automation supports stronger compliance and operational consistency.
Database Platform Coverage Overview
Database Platform | Level of Support
Oracle Database | Full native support
Exadata | Full engineered system support
Oracle Cloud Databases | Full support
MySQL External | Supported with dedicated module
Non-Oracle Databases | Limited and less seamless support
Licensing Complexity and Cost Considerations
Oracle Enterprise Manager is known for its complex licensing model, which can be challenging to navigate. Pricing is typically usage-based, with examples including hourly charges per OCPU for cloud databases and per host CPU for external databases. MySQL external database management follows a separate monthly pricing model. Many users cite licensing cost and complexity as a key concern, particularly when scaling across large environments. As a result, Oracle Enterprise Manager is often best suited for organizations already deeply invested in the Oracle ecosystem, where its advanced capabilities justify the higher cost.
User Satisfaction and Enterprise Perception
Despite its complexity, Oracle Enterprise Manager receives strong ratings from enterprise users. Feedback consistently highlights its performance, security, stability, and unmatched visibility into Oracle workloads. Users value its ability to detect issues within stored procedures, provide detailed reports, and offer centralized management across Oracle products. Criticism typically focuses on a less intuitive user interface, steeper learning curve, higher licensing costs, and limitations when integrating with non-Oracle tools.
User Feedback Summary Matrix
Evaluation Area | User Sentiment
Performance Depth | Very strong
Security and Stability | Highly positive
Ease of Use | Moderate
Licensing and Cost | Frequently criticized
Non-Oracle Integration | Limited effectiveness
Performance Overhead and Real-World Considerations
Oracle claims near zero-overhead diagnostics through efficient data collection and Java thread sampling methods. While this is generally true for core monitoring, some users report slower performance during real-time testing or when alerting configurations are overly aggressive. This suggests that actual overhead can vary depending on environment size, alert volume, and configuration choices. For organizations with large and complex workloads, careful tuning and testing are essential to balance insight depth with performance impact.
Why Oracle Enterprise Manager Remains a Top Choice in 2026
Oracle Enterprise Manager earns its place among the leading database monitoring tools by delivering unmatched depth for Oracle database environments. Its native diagnostics, automated tuning, lifecycle management, and centralized control make it especially valuable for large enterprises with mission-critical Oracle workloads. While its cost, complexity, and limited non-Oracle support may not suit every organization, for Oracle-centric environments it remains one of the most powerful and strategically important database monitoring platforms available in 2026.
4. IBM Instana Observability
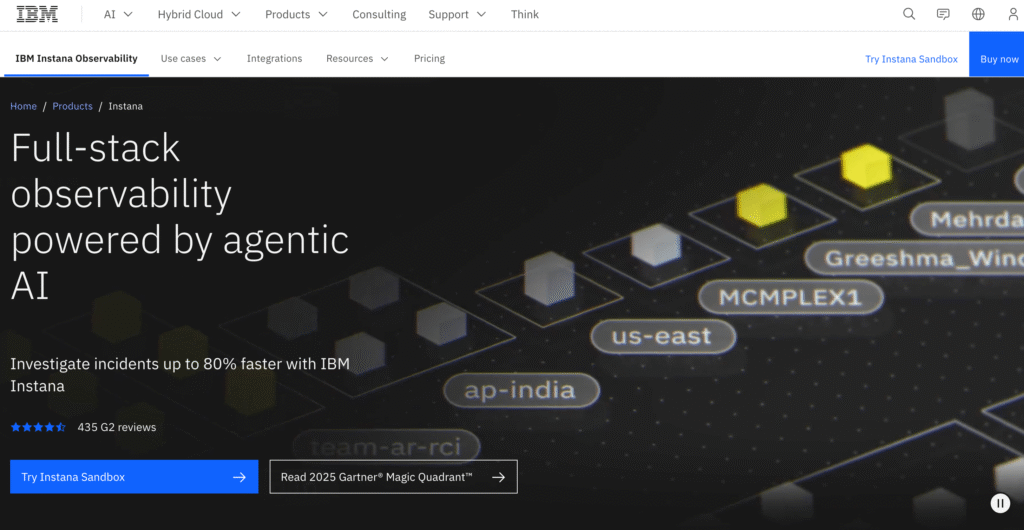
IBM Instana Observability is widely positioned as one of the most advanced observability and database monitoring solutions for modern, distributed systems. Its inclusion among the Top 10 Best Database Monitoring Software in 2026 is strongly driven by its real-time data accuracy, full-fidelity tracing approach, and AI-powered automation designed for complex enterprise environments.
Automatic Discovery and Immediate Visibility
IBM Instana Observability is built around automation from the very first deployment. The platform automatically discovers applications, services, databases, and dependencies without requiring manual configuration. In complex enterprise stacks, this results in up to 80–90 percent immediate visibility out of the box, especially within IBM-centric environments such as IBM ACE and IBM MQ. This automatic discovery significantly reduces setup time and allows teams to gain actionable insights almost immediately after installation.
Real-Time Metrics and Full-Fidelity Tracing
One of Instana’s strongest technical differentiators is its ability to capture real-time metrics at one-second granularity with notifications delivered in approximately three seconds. Unlike many monitoring platforms that rely on sampling, Instana captures 100 percent of all requests in real time. This means no transactions are missed, no traces are approximated, and no blind spots are introduced. For database monitoring, this ensures every query interaction and dependency path is fully observable, which is especially valuable in microservices and highly distributed architectures.
AI-Driven Root Cause Analysis and Faster Resolution
Instana applies artificial intelligence to analyze high-volume telemetry data and automatically identify root causes of performance issues. Because the platform works with complete, unsampled data, its AI-driven insights are more precise and reliable. This allows engineering and operations teams to move directly from detection to resolution, reducing mean time to identify and mean time to repair. Automated incident remediation further strengthens its appeal for organizations operating at scale.
Broad Database and Technology Ecosystem Support
IBM Instana Observability supports a wide range of database technologies across SQL, NoSQL, in-memory, and analytical systems. It integrates seamlessly with more than 300 technologies, enabling unified observability across applications, infrastructure, and databases from a single platform.
Database Support Overview Table
Database Type | Supported
MySQL | Yes
PostgreSQL | Yes
Oracle | Yes
Microsoft SQL Server | Yes
MariaDB | Yes
MongoDB | Yes
Cassandra | Yes
Redis | Yes
Couchbase | Yes
Elasticsearch | Yes
IBM Db2 | Yes
ClickHouse | Yes
Memcached | Yes
Flexible Pricing Model and Cost Perception
Instana follows a pricing approach based on Managed Virtual Servers, offering unlimited users and unlimited applications. Entry-level plans start at a lower monthly rate, while more advanced plans and self-hosted deployments are priced higher. Additional charges may apply for data ingestion beyond included limits. While some organizations view the pricing as competitive compared to other enterprise observability tools, others perceive it as premium, particularly in high-ingestion environments. This makes cost planning an important consideration for large-scale deployments.
User Adoption and Market Feedback
User feedback consistently highlights Instana’s automatic discovery, real-time visibility, and intuitive interface as major strengths. Review data shows strong satisfaction levels, with a very high percentage of users willing to recommend the platform. Users frequently emphasize the value of complete tracing and fast root cause identification. Criticism tends to focus on longer implementation times for certain technologies, limited documentation in some areas, and a desire for more predictive AI capabilities rather than purely reactive insights.
User Feedback Matrix
Evaluation Area | Overall Sentiment
Automatic Discovery | Very strong
Real-Time Visibility | Highly positive
AI Root Cause Analysis | Strong
Ease of Use | Positive
Documentation Depth | Moderate
Implementation Effort | Varies by stack
Low Overhead and Performance Efficiency
IBM Instana Observability is engineered to monitor production systems without creating performance bottlenecks. It uses an efficient custom span exporter designed to minimize system impact while handling high data volumes. The platform emphasizes non-intrusive monitoring, ensuring that metrics and traces are collected without overloading applications or databases. This low-footprint approach makes it suitable for performance-sensitive and mission-critical environments.
Why IBM Instana Observability Ranks Among the Best in 2026
IBM Instana Observability earns its place among the top database monitoring solutions by combining complete real-time visibility, AI-powered intelligence, and broad technology support. Its commitment to capturing 100 percent of all requests provides unmatched accuracy for troubleshooting and performance optimization. While its pricing and implementation depth may not suit every organization, for enterprises managing complex, distributed systems that demand precision, speed, and reliability, Instana stands out as a leading database monitoring and observability platform in 2026.
5. ManageEngine Applications Manager
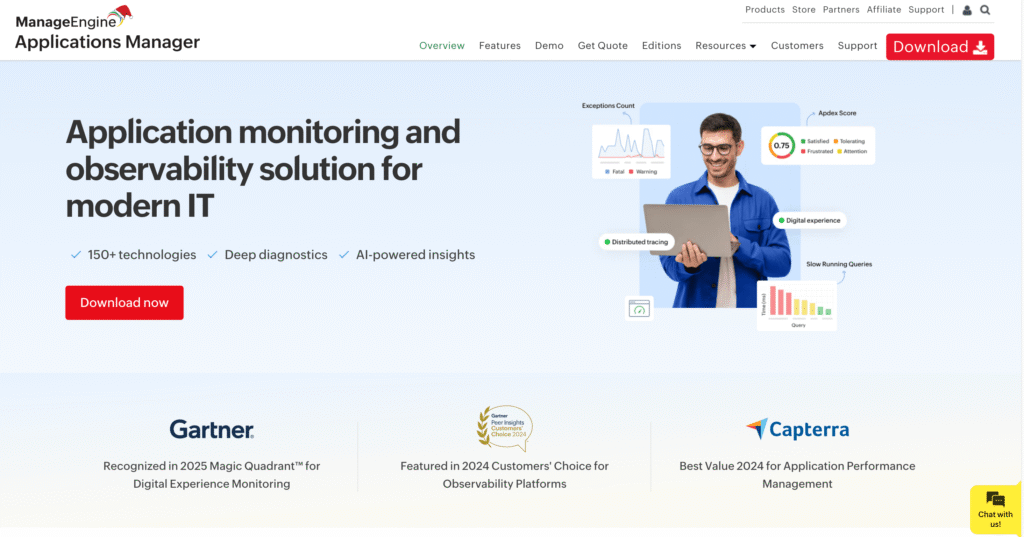
ManageEngine Applications Manager is widely recognized as a powerful and scalable monitoring platform that delivers deep visibility across applications, databases, and infrastructure. Its inclusion among the Top 10 Best Database Monitoring Software in 2026 is driven by its broad database coverage, agentless architecture, strong analytics, and cost-effective licensing that appeals to both mid-sized and large enterprises.
End-to-End Visibility Across Applications and Databases
ManageEngine Applications Manager provides a unified view of application performance, database health, and infrastructure usage from a single console. It continuously tracks critical performance indicators such as CPU and memory usage, active user sessions, database response times, and query execution behavior. This end-to-end visibility allows IT teams to clearly understand how database performance impacts applications and user experience, making it easier to prioritize issues that affect business operations.
Advanced Query Analysis and Root Cause Identification
A key strength of the platform is its ability to analyze slow-running SQL queries in detail. It identifies inefficient queries, locking issues, and resource bottlenecks that lead to performance degradation. By correlating query behavior with system metrics, the platform helps teams quickly pinpoint the true root cause of database slowdowns instead of relying on guesswork. This accelerates troubleshooting and reduces downtime in production environments.
Machine Learning Insights and Capacity Forecasting
ManageEngine Applications Manager uses machine learning-driven trend analysis to support capacity planning and performance forecasting. By analyzing historical usage patterns, it helps organizations predict future resource requirements and avoid unexpected performance constraints. These insights are especially valuable for growing environments where database workloads increase rapidly over time.
Multi-Vendor and Multi-Environment Database Support
The platform supports a wide range of database technologies across on-premises, virtualized, and cloud environments. This multi-vendor approach allows organizations to monitor diverse database ecosystems without maintaining multiple monitoring tools.
Database Support Coverage Table
Database Category | Supported Platforms
Relational Databases | Oracle, Microsoft SQL Server, MySQL, PostgreSQL
NoSQL Databases | MongoDB, Cassandra, Couchbase
In-Memory Databases | Memcached
Key-Value Stores | Redis
Cloud Databases | AWS Aurora, Azure SQL Database, Oracle Autonomous Database
Agentless Architecture and High Scalability
One of the most compelling advantages of ManageEngine Applications Manager is its agentless monitoring model. It collects performance data using secure methods such as JDBC connections, native operating system interfaces, and API calls. This eliminates the need to install and maintain agents on database servers, significantly reducing operational overhead. As a result, the platform can scale efficiently to monitor thousands of database instances while maintaining low system impact, making it suitable for large and complex environments.
Clear Pricing Structure and Cost Efficiency
ManageEngine offers a transparent pricing model that does not charge per attribute, which simplifies budgeting and cost control. The Professional Edition provides an affordable entry point for smaller deployments, while the Enterprise Edition supports large-scale environments with thousands of monitors. Both subscription-based and perpetual licensing options are available, along with optional add-ons for deeper application and end-user monitoring. This flexibility makes the platform accessible to organizations with varying budget and scalability requirements.
Pricing Overview Table
Edition | Typical Use Case
Professional Edition | Small to mid-sized environments
Enterprise Edition | Large-scale, multi-database deployments
Perpetual License | Long-term cost optimization
Add-On Modules | Extended APM and user monitoring
User Satisfaction and Market Feedback
User reviews consistently highlight the platform’s ease of use, customizable alerts, and strong integration with other ManageEngine products. Many users value the intuitive dashboards and responsive customer support. High satisfaction ratings reflect trust in the platform’s reliability and day-to-day usability. While some feedback notes that the interface may feel less refined than premium competitors and that custom integrations are limited, these concerns are often outweighed by the tool’s functionality and pricing advantages.
User Feedback Matrix
Evaluation Area | Overall Sentiment
Ease of Use | Very positive
Alerting and Notifications | Highly rated
Database Visibility | Strong
Customer Support | Excellent
UI Polish | Moderate
Custom Integrations | Limited
Performance Impact and Operational Efficiency
ManageEngine Applications Manager is designed to collect monitoring data without introducing noticeable performance overhead. Its agentless approach minimizes resource consumption and reduces the risk of monitoring-related downtime. This makes it particularly attractive for organizations that require reliable monitoring on critical database systems without compromising performance.
Why ManageEngine Applications Manager Ranks Among the Best in 2026
ManageEngine Applications Manager earns its place among the top database monitoring tools by combining broad database support, intelligent analytics, and an agentless, highly scalable architecture. Its balance of deep functionality, operational simplicity, and transparent pricing makes it an excellent choice for organizations seeking effective database monitoring without the complexity or cost of heavyweight observability platforms. For teams managing diverse and growing database environments, it remains a dependable and high-value solution in 2026.
6. Prometheus and Grafana
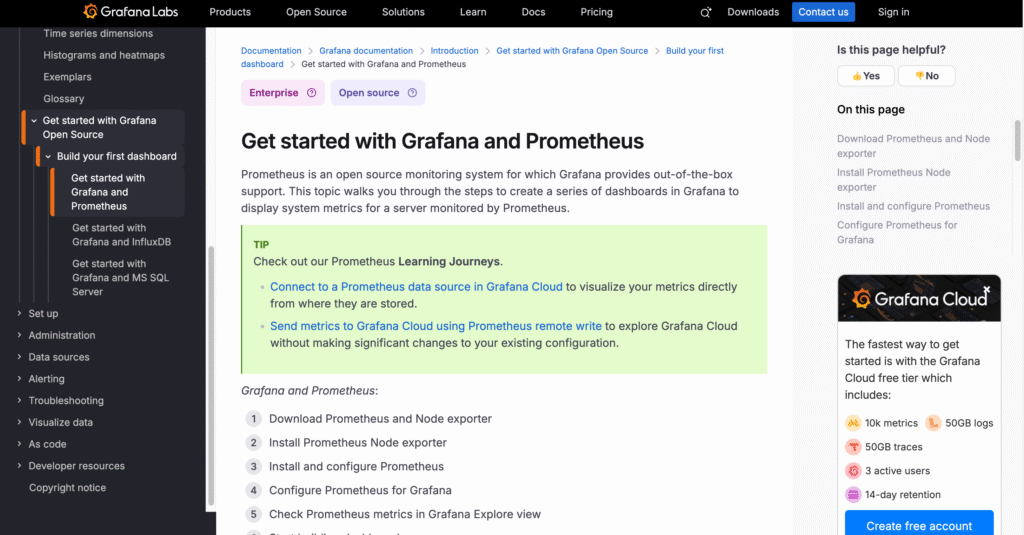
Prometheus and Grafana together form one of the most widely adopted open-source stacks for database monitoring and observability. Their combined flexibility, scalability, and zero licensing cost are the primary reasons this stack consistently ranks among the Top 10 Best Database Monitoring Software options in 2026, especially for engineering-driven organizations.
Open-Source Architecture and Monitoring Philosophy
The Prometheus and Grafana stack is built around openness, modularity, and full control. Prometheus focuses on high-performance metrics collection and storage using a time-series database model, while Grafana specializes in transforming raw metrics into meaningful, visual insights. Together, they enable organizations to design highly customized monitoring systems without being locked into proprietary platforms. This approach strongly appeals to teams that value transparency, extensibility, and long-term architectural freedom.
Real-Time Metrics Collection and Alerting
Prometheus continuously scrapes metrics from monitored systems at defined intervals, delivering near real-time visibility into database health and performance. It supports powerful alerting rules that can notify teams when thresholds are breached or unusual patterns emerge. This makes it effective for detecting database issues such as high query latency, connection saturation, memory pressure, or replication lag before they escalate into outages.
Flexible Dashboards and Cross-Platform Visualization
Grafana complements Prometheus by providing rich, interactive dashboards that are fully customizable. It allows teams to visualize database metrics in real time using graphs, heatmaps, tables, and trend views. A major advantage of Grafana is its ability to unify data from multiple sources into a single interface without forcing data ingestion into a proprietary backend. This enables organizations to combine database metrics with cloud, infrastructure, and application data, creating a shared, data-driven operational view.
Extensive Database Exporter Ecosystem
Prometheus benefits from a large ecosystem of official and community-maintained exporters that expose metrics from popular database platforms. This makes it possible to monitor a wide variety of database technologies using a consistent metrics model.
Database Support Overview Table
Database Platform | Supported via Exporters
MySQL | Yes
PostgreSQL | Yes
MongoDB | Yes
Oracle Database | Yes
Microsoft SQL Server | Yes
ClickHouse | Yes
Couchbase | Yes
Redis | Yes
Cassandra | Yes
Multi-Source Observability with Grafana
Beyond Prometheus, Grafana can directly connect to many other data sources, allowing teams to correlate database performance with broader system behavior. This includes integrations with major cloud providers, log platforms, application monitoring tools, and data warehouses. As a result, Grafana often becomes the central observability layer across engineering, operations, and business teams.
Cost Model and Deployment Flexibility
The core Prometheus and Grafana software is fully open-source and free to use, eliminating licensing fees entirely. This delivers significant cost savings compared to commercial database monitoring platforms. For organizations that prefer managed services, Grafana offers hosted cloud plans with usage-based pricing, while managed Prometheus options are also available. This flexibility allows teams to choose between full self-management and partial outsourcing based on skills and budget.
Pricing Comparison Matrix
Deployment Option | Cost Characteristics
Self-Hosted Prometheus + Grafana | No licensing cost
Grafana Cloud Free Tier | Limited usage, no cost
Grafana Cloud Pro | Low entry cost, usage-based
Grafana Cloud Advanced | Higher cost, enterprise features
User Adoption and Community Feedback
User feedback consistently highlights the stack’s flexibility, scalability, and cost efficiency. Prometheus is frequently praised for its reliable metrics collection and strong alerting model, while Grafana is valued for its powerful visualizations and dashboard customization. At the same time, users often note that Prometheus has a steeper learning curve and that Grafana performance can be impacted in very large alerting environments. These trade-offs reflect the broader reality of open-source tooling, where simplicity is exchanged for control and extensibility.
Operational Skill Requirements and Total Cost of Ownership
While the software itself is free, the total cost of ownership depends heavily on internal expertise. Successful deployments typically require skilled DevOps or Site Reliability Engineering teams to handle setup, exporter configuration, dashboard design, alert tuning, and ongoing maintenance. For organizations with strong technical teams, this investment pays off through unmatched flexibility and independence. For less technical teams, managed services may be necessary to reduce operational burden.
Performance Efficiency and Resource Impact
Prometheus is designed for efficient metrics collection and avoids unnecessary self-monitoring overhead. Grafana includes mechanisms such as alert state compression and optimized persistence to reduce database load when managing large numbers of alerts. When properly configured, the stack delivers high-performance monitoring without becoming a bottleneck itself.
Why Prometheus and Grafana Rank Among the Best in 2026
Prometheus and Grafana earn their place among the top database monitoring solutions by offering unmatched openness, scalability, and cost efficiency. They empower organizations to build custom, vendor-independent monitoring systems that adapt to evolving architectures. While they demand higher technical expertise than fully managed platforms, for teams that prioritize flexibility, transparency, and long-term control, this open-source stack remains one of the most powerful and future-proof database monitoring choices in 2026.
7. Site24x7

Site24x7 is widely regarded as one of the most practical and cost-efficient database monitoring solutions available in 2026. Its inclusion among the Top 10 Best Database Monitoring Software is driven by its full-stack visibility, strong automation capabilities, lightweight design, and pricing model that makes advanced monitoring accessible to organizations of all sizes.
Full-Stack Monitoring with Strong Database Focus
Site24x7 delivers end-to-end visibility across applications, databases, servers, cloud infrastructure, and networks through a single unified platform. This holistic approach allows teams to clearly understand how database performance affects application responsiveness and overall system stability. By centralizing monitoring data in one dashboard, Site24x7 simplifies day-to-day operations and reduces the complexity often associated with managing multiple monitoring tools.
Real-Time Insights and AI-Driven Analysis
The platform provides real-time performance metrics that help teams detect database issues as soon as they arise. AI-powered anomaly detection analyzes historical trends and current behavior to identify unusual patterns such as slow query execution, increased response times, or abnormal load conditions. These insights enable faster troubleshooting and help prevent minor issues from escalating into major outages.
Broad Database Support Across Environments
Site24x7 supports a wide range of databases across on-premises, cloud, and hybrid environments. This flexibility allows organizations to monitor diverse database ecosystems without switching tools as their infrastructure evolves.
Database Support Coverage Table
Database Platform | Supported
MySQL | Yes
PostgreSQL | Yes
Microsoft SQL Server | Yes
Oracle | Yes
Amazon RDS | Yes
Amazon Aurora | Yes
MongoDB | Yes
Cassandra | Yes
Redis | Yes
SAP HANA | Yes
DB2 | Yes
ClickHouse | Yes
CouchDB | Yes
VoltDB | Yes
Unified Dashboards and Customizable Alerts
Site24x7 offers intuitive dashboards that visualize key database metrics such as response time, query throughput, connection usage, and resource consumption. Alerts can be customized to match business priorities, ensuring the right teams are notified at the right time. The availability of a mobile application further enhances responsiveness by allowing teams to monitor database health and receive alerts from anywhere.
Transparent Pricing and Cost Accessibility
One of Site24x7’s strongest advantages is its transparent and affordable pricing structure. Entry-level plans provide essential monitoring at a low monthly cost, while higher-tier plans support larger environments with more monitors. Additional capabilities such as log management and real user monitoring can be added as needed. This flexible pricing model makes Site24x7 particularly attractive to small and mid-sized businesses as well as cost-conscious enterprises.
Pricing Overview Matrix
Plan Type | Typical Use Case
Starter Plan | Small environments and basic monitoring
Pro Plan | Growing systems with moderate scale
Classic Plan | Larger deployments with higher monitor counts
Add-On Modules | Advanced logs and user experience monitoring
User Satisfaction and Market Perception
User feedback consistently highlights Site24x7’s ease of use, comprehensive monitoring scope, and reliable alerting system. High satisfaction ratings reflect confidence in its stability and everyday usability. Users also appreciate the mobile app and customizable dashboards. Some feedback mentions that advanced monitoring features can increase costs and that complex issues may require more responsive support, but overall sentiment remains strongly positive.
Performance Efficiency and Lightweight Architecture
Site24x7 is designed with performance efficiency in mind. Its server monitoring agent is described as very lightweight, ensuring minimal impact on monitored systems. Database metrics are collected using read-only SQL queries, which helps preserve database performance while still providing detailed insights. This low-overhead design is especially valuable for production environments where monitoring tools must not interfere with critical workloads.
Why Site24x7 Ranks Among the Best in 2026
Site24x7 earns its position among the leading database monitoring platforms by combining broad database coverage, real-time visibility, AI-powered insights, and affordable pricing. Its lightweight architecture and unified full-stack approach make it an excellent choice for organizations that want reliable database monitoring without high complexity or excessive cost. For teams seeking a balanced solution that scales efficiently while remaining easy to manage, Site24x7 stands out as a top database monitoring option in 2026.
8. New Relic
New Relic is widely recognized as one of the most comprehensive and intelligent observability platforms available today. Its position among the Top 10 Best Database Monitoring Software in 2026 is driven by its deep analytics, strong AI capabilities, broad database integrations, and its ability to clearly connect database performance with application behavior in real time.
Unified Observability and Database Performance Intelligence
New Relic is designed to act as a single source of truth for observability across applications, databases, infrastructure, and cloud services. It brings database metrics, query behavior, and application performance data into one unified view, helping teams understand how database issues directly impact user experience. By breaking down silos between teams and tools, New Relic enables faster collaboration and more informed decision-making across engineering, operations, and product teams.
Deep Query Insights and Dependency Mapping
A major strength of New Relic lies in its ability to deliver deep visibility into database queries and dependencies. The platform automatically maps how applications interact with databases, services, and external components. This makes it easier to identify which database queries are slowing down specific application transactions. With real-time insights, teams can proactively address database bottlenecks before they cause widespread performance issues.
AI-Powered Analytics and Proactive Issue Prevention
New Relic uses artificial intelligence to analyze large volumes of telemetry data and surface meaningful insights. These AI-driven capabilities help detect anomalies, predict performance degradation, and prioritize issues based on business impact. Instead of reacting to outages, teams can use these insights to prevent problems before they affect customers, making New Relic especially valuable in fast-moving, data-intensive environments.
Extensive Database and Cloud Service Support
New Relic integrates with a broad range of database technologies, covering traditional relational databases, modern NoSQL systems, time-series databases, and cloud-native data services. This wide coverage allows organizations to monitor diverse database environments without switching platforms.
Database Support Coverage Table
Database Category | Supported Platforms
SQL Databases | Microsoft SQL Server, Oracle Database, MySQL, PostgreSQL
NoSQL Databases | MongoDB, Cassandra, Redis, Elasticsearch
Time-Series Databases | InfluxDB, Prometheus
Cloud-Native Databases | Azure Cosmos DB, DynamoDB
Customizable Dashboards and Powerful Query Language
The platform provides flexible dashboards that allow teams to visualize database performance metrics in ways that match their operational needs. New Relic’s proprietary query language is frequently praised for being powerful yet approachable, enabling users to explore performance data without deep query expertise. This balance makes advanced analysis accessible to a wider range of users while still supporting complex use cases.
Pricing Model and Cost Management Considerations
New Relic follows a consumption-based pricing model that charges based on users and data ingestion volume. It offers a free tier that includes a generous amount of data ingest and basic user access, making it easy to get started. Higher tiers unlock advanced features, priority support, and enterprise-grade capabilities. While this model appeals to organizations seeking an all-in-one platform, costs can increase significantly as data volumes and user counts grow. Effective cost monitoring and usage planning are essential in large or complex deployments.
Pricing Structure Overview Matrix
Pricing Element | Key Characteristics
Free Tier | Limited data ingest, basic access
Standard Tier | Per-user pricing with included data
Pro Tier | Higher cost, advanced features and support
Enterprise Tier | Custom pricing for large-scale needs
Data Overages | Additional charges per GB ingested
User Satisfaction and Market Feedback
New Relic consistently receives strong ratings across major review platforms. Users often highlight its powerful analytics, comprehensive feature set, and the flexibility of its query language. At the same time, feedback frequently mentions challenges with pricing transparency, per-user costs, and a steeper learning curve for new users. Some users also express mixed views on post-sales support. Despite these concerns, overall sentiment remains positive, especially among organizations that fully leverage the platform’s capabilities.
System Overhead and Performance Efficiency
New Relic is engineered to collect detailed performance data with minimal system impact. Its monitoring overhead is generally described as very low and barely noticeable in production environments. This allows organizations to gain deep visibility into database and application performance without introducing additional latency or instability.
Why New Relic Ranks Among the Best in 2026
New Relic earns its place among the leading database monitoring solutions by combining AI-driven analytics, deep database insights, and a unified observability experience. Its ability to correlate database performance with application behavior makes it especially valuable for modern, complex systems. While careful cost management is required as usage scales, for organizations seeking a powerful, all-in-one platform that supports proactive performance management, New Relic remains a top-tier database monitoring choice in 2026.
9. AppDynamics

AppDynamics, part of Cisco Systems through its integration with Splunk, is widely regarded as one of the most advanced enterprise-grade monitoring platforms available today. Its position among the Top 10 Best Database Monitoring Software in 2026 is driven by its transaction-centric design, deep database visibility, and its unique ability to directly link technical performance metrics to real business outcomes.
Business Transaction-Centric Monitoring Approach
AppDynamics is built around the concept of business transactions rather than isolated infrastructure metrics. This means database performance is always analyzed in the context of how it affects applications, user journeys, and revenue-impacting processes. By focusing on end-to-end transactions, the platform helps organizations understand not only that a database is slow, but exactly which business processes are being affected and why. This approach is especially valuable for large enterprises where performance issues can have direct financial consequences.
Automatic Topology Discovery and Intelligent Baselining
The platform automatically discovers application architectures, database dependencies, and service interactions without extensive manual configuration. It continuously baselines normal behavior across applications and databases, allowing it to quickly detect anomalies when performance deviates from expected patterns. This automation reduces setup complexity and ensures that monitoring remains accurate even as environments evolve.
Deep Database Visibility and Root Cause Analysis
AppDynamics provides granular insights into database performance, including query execution behavior, response times, connection usage, and contention issues. When a performance problem occurs, the platform correlates database metrics with application behavior to pinpoint the root cause. This reduces troubleshooting time and eliminates the need for teams to manually piece together data from multiple tools.
Broad Database and Cloud Service Coverage
AppDynamics supports an extensive range of database technologies across on-premises, cloud, and hybrid environments. This makes it suitable for organizations running complex, heterogeneous stacks with multiple database engines.
Database Support Coverage Table
Database Category | Supported Platforms
Relational Databases | Microsoft SQL Server, MySQL, MariaDB, PostgreSQL, Oracle, IBM DB2, Sybase ASE/IQ
NoSQL Databases | MongoDB, Cassandra, Datastax Enterprise, Couchbase
In-Memory and Analytics | SAP HANA
Cloud Databases | AWS RDS, Aurora MySQL, Aurora PostgreSQL, DynamoDB, DocumentDB, ElastiCache
Enterprise-Grade AI and Advanced Troubleshooting
AppDynamics uses built-in intelligence to analyze performance trends and automatically surface the most critical issues. Its AI-driven insights help teams prioritize problems based on business impact rather than raw technical severity. This capability is particularly valuable in large, multi-tiered systems where thousands of metrics are generated continuously.
Pricing Structure and Enterprise Positioning
AppDynamics follows a premium pricing model designed for enterprise environments. It offers a limited free tier for evaluation, while paid plans are priced per unit or per CPU core, depending on deployment and feature set. Although users often describe the platform as more expensive than many alternatives, it is commonly viewed as cost-effective for complex environments where rapid root cause analysis and reduced downtime deliver measurable business value.
Pricing Overview Matrix
Pricing Element | Characteristics
Free Tier | Limited units and data retention
Pro Plan | Per-unit annual pricing
CPU-Based Licensing | Monthly pricing per core
Enterprise Deployment | Higher cost, advanced capabilities
User Satisfaction and Market Feedback
User reviews consistently highlight AppDynamics’ deep visibility, automatic detection, and strong troubleshooting capabilities. Many organizations acknowledge a steeper learning curve and higher upfront costs, but emphasize that these challenges are offset by the platform’s ability to resolve issues faster and reduce operational risk. Satisfaction ratings remain strong, particularly among enterprises managing large-scale, mission-critical applications.
Agent-Based and Agentless Monitoring Flexibility
AppDynamics supports both agent-based and agentless monitoring approaches depending on the database technology. For example, MongoDB monitoring can be performed without installing agents, minimizing deployment effort and system overhead. For other databases, lightweight agents collect and aggregate performance data at defined intervals, ensuring detailed insights while maintaining manageable resource usage.
Monitoring Architecture Comparison Table
Monitoring Method | Key Benefit
Agentless Monitoring | Minimal overhead and simpler deployment
Agent-Based Monitoring | Deeper visibility and transaction correlation
Why AppDynamics Ranks Among the Best in 2026
AppDynamics earns its place among the top database monitoring solutions by combining business-context awareness, deep technical insight, and enterprise-grade intelligence. Its ability to connect database performance directly to application behavior and business impact makes it especially valuable for complex, multi-tiered environments. While its pricing and setup complexity may not suit smaller teams, for large organizations that demand precision, scalability, and faster problem resolution, AppDynamics remains one of the most powerful database monitoring platforms available in 2026.
10. SigNoz
SigNoz is increasingly recognized as one of the most compelling modern database monitoring solutions, earning its place among the Top 10 Best Database Monitoring Software in 2026. Its strong focus on open standards, real-time visibility, and cost efficiency makes it especially attractive for cloud-native and engineering-led organizations.
OpenTelemetry-Native Monitoring and Modern Architecture
SigNoz is built natively on OpenTelemetry, which has become the industry standard for collecting metrics, traces, and logs. This foundation allows the platform to capture database calls, query latency, and errors in real time with high accuracy and minimal configuration. By using open standards instead of proprietary agents, SigNoz provides long-term flexibility and avoids vendor lock-in, a key consideration for organizations building future-ready observability stacks.
Deep Database Visibility with Distributed Tracing
A core strength of SigNoz is its distributed tracing capability, which provides an end-to-end view of user requests as they move through applications and databases. Database queries are visualized within the full request context using flame graphs and Gantt-style timelines. This makes it easy for teams to identify slow database queries and understand how they affect overall application performance, rather than troubleshooting databases in isolation.
Real-Time Dashboards and High-Performance Data Storage
SigNoz presents database metrics through highly customizable dashboards that display query latency, throughput, error rates, and connection behavior. Under the hood, it uses a columnar database optimized for fast querying across large datasets. This design enables rapid exploration of historical and real-time data, even in high-volume environments, without sacrificing performance.
Supported Database Platforms Overview
Database Platform | Supported
MySQL | Yes
PostgreSQL | Yes
MongoDB | Yes
Redis | Yes
Flexible Deployment Models and Cost Control
SigNoz can be fully self-hosted as an open-source solution, giving organizations complete control over their monitoring infrastructure and data. This approach eliminates recurring licensing fees and provides predictable costs. For teams that prefer a managed experience, SigNoz Cloud offers a usage-based pricing model that charges only for data ingested. Notably, there are no per-user or per-host fees, and custom metrics are not priced separately. This transparent pricing structure makes SigNoz highly appealing to cost-conscious teams.
Pricing Model Comparison Matrix
Deployment Option | Cost Characteristics
Self-Hosted Open Source | No licensing fees, full control
SigNoz Cloud Teams | Low entry cost, usage-based pricing
SigNoz Cloud Enterprise | Custom pricing for large-scale needs
Strong Developer Adoption and Community Trust
SigNoz has gained strong traction within the developer community, reflected in its large and active open-source following. It is frequently described as developer-friendly due to its clean interface, real-time insights, and alignment with modern DevOps and SRE practices. Engineering teams working with microservices and distributed systems often choose SigNoz for its balance of transparency, flexibility, and performance.
Operational Responsibility and Trade-Offs
While the open-source model offers major advantages in cost and control, it also requires organizations to manage their own infrastructure when self-hosting. This includes deployment, scaling, upgrades, and reliability management. For teams with strong internal engineering capabilities, this trade-off is often acceptable and even preferred. For others, the managed cloud option reduces operational complexity while preserving most of the platform’s benefits.
Low Overhead and Performance Efficiency
SigNoz is designed to ingest metrics and traces with minimal performance impact. Its OpenTelemetry-based architecture ensures efficient data collection without placing heavy load on applications or databases. Compared to many proprietary tools, SigNoz delivers observability with lower resource overhead and more predictable costs.
Why SigNoz Ranks Among the Best in 2026
SigNoz earns its place among the leading database monitoring solutions by combining real-time visibility, distributed tracing, and open-source flexibility. Its native OpenTelemetry support, transparent pricing, and low overhead make it particularly well suited for modern, cloud-native environments. For organizations seeking vendor independence, cost control, and deep insight into database performance within distributed systems, SigNoz stands out as one of the most future-proof database monitoring platforms in 2026.
The Criticality of Database Monitoring
The Rapid Evolution of Enterprise Data Environments
Modern organizations operate in a data environment that is growing at an unprecedented pace. Data volumes continue to expand rapidly, while data types and data sources become more diverse and complex. At the same time, businesses expect databases to deliver consistently fast performance, high availability, and zero disruption. This combination makes database monitoring no longer optional, but a core operational requirement.
Enterprises are steadily moving away from traditional, centralized systems toward cloud-native architectures, microservices-based applications, and hybrid or multi-cloud deployments. While these modern architectures offer flexibility and scalability, they also introduce new layers of complexity. Databases are no longer isolated systems. They are deeply interconnected with applications, APIs, containers, and cloud services. As a result, a performance issue in one part of the stack can quickly cascade into database slowdowns or failures.
Why Traditional Monitoring Is No Longer Enough
In earlier IT environments, database monitoring focused mainly on internal metrics such as CPU usage, memory consumption, disk I/O, and query execution time. While these metrics remain important, they are no longer sufficient on their own. In distributed systems, database performance problems often originate outside the database itself. A poorly optimized application query, network latency, or misconfigured service can all degrade database performance without any obvious internal warning signs.
This shift has changed what organizations expect from database monitoring software. Modern tools must correlate database metrics with application traces, infrastructure data, and user experience signals. Without this broader visibility, teams struggle to identify root causes quickly, leading to longer outages and higher operational costs.
The Rise of Unified Observability for Databases
As systems become more interconnected, database monitoring is evolving into a key component of full-stack observability. Leading platforms now aim to provide a single, unified view that connects databases with applications, services, and infrastructure. This approach allows teams to see how database performance directly impacts application responsiveness and end-user experience.
Unified observability platforms help IT teams move from reactive firefighting to proactive performance management. By correlating metrics, logs, and traces, these tools make it easier to detect anomalies early, understand dependencies, and resolve issues before they escalate into business-critical incidents.
Key Drivers Behind the Demand for Advanced Database Monitoring
Driver | Impact on Database Monitoring
Rapid data growth | Increased risk of performance bottlenecks
Microservices adoption | Greater dependency between apps and databases
Cloud and hybrid environments | Need for cross-platform visibility
User experience expectations | Lower tolerance for latency and downtime
Business-critical applications | Higher cost of database outages
Objectives and Scope of This Analysis
This analysis is designed to serve as a practical and data-driven guide to the Top 10 Best Database Monitoring Software in 2026. It is intended for IT leaders, DevOps professionals, database administrators, and engineering teams who are responsible for maintaining performance, reliability, and scalability across modern database environments.
The scope of this analysis includes an evaluation of leading database monitoring solutions based on their capabilities, supported databases, pricing approaches, scalability, user feedback, and performance impact. It also considers how well each platform aligns with current trends such as cloud-native adoption, AI-driven monitoring, and unified observability.
Decision-Making Focus Areas for 2026
Evaluation Area | Why It Matters
Database coverage | Supports diverse and evolving data stacks
Observability depth | Enables faster root cause analysis
Scalability | Handles growing workloads efficiently
Pricing transparency | Controls long-term operational costs
Low performance overhead | Prevents monitoring from becoming a bottleneck
By examining these factors, this overview helps organizations identify database monitoring solutions that are not only effective today, but also future-ready. As data environments continue to grow in scale and complexity, choosing the right monitoring platform becomes a strategic decision that directly influences system stability, user satisfaction, and business continuity in 2026 and beyond.
Database Monitoring Market Overview & Key Trends
Expanding Market Landscape and Industry Momentum
The global market for database monitoring software is growing rapidly as organizations continue to invest in digital transformation and data-driven operations. As data environments become more complex, the need for advanced monitoring solutions that ensure performance, reliability, and data trust has intensified. In 2026, database monitoring is no longer viewed as a narrow operational tool, but as a strategic capability that supports business continuity, customer experience, and regulatory compliance.
Market growth reflects this shift. Database monitoring software has evolved from basic performance tracking into intelligent platforms that integrate analytics, automation, and observability. At the same time, the broader data observability market is expanding even faster, highlighting a clear industry transition toward holistic data health monitoring rather than isolated database metrics.
Global Market Size and Growth Outlook
The database monitoring software market has shown strong and sustained growth over recent years. Valued at just over two billion US dollars in 2024, the market continued to expand through 2025 and is projected to more than double by the end of the decade. Growth rates remain consistently high, driven by cloud adoption, distributed architectures, and rising expectations for system uptime and performance.
In parallel, the data observability market, which includes database monitoring as a core component, has reached a larger overall size and is growing at a comparable pace. This difference in scale signals that organizations are increasingly prioritizing end-to-end data reliability, covering data quality, lineage, pipelines, and governance alongside database performance.
Global Market Growth Comparison Table
Market Segment | 2024 Market Size (USD Billion) | 2025 Market Size (USD Billion) | 2029 Projection (USD Billion) | Average CAGR
Database Monitoring Software | 2.02 | 2.33 | 4.21 | Approximately 16 percent
Data Observability | 2.53 | 2.94 | 5.27 | Approximately 16 percent
This expansion demonstrates that modern database monitoring tools are expected to operate as part of a broader observability ecosystem rather than as standalone utilities.
Primary Forces Driving Market Growth
Several powerful forces are accelerating demand for advanced database monitoring solutions.
Explosive Data Generation
Global data creation continues to grow at an extraordinary rate. Enterprises now process data from applications, users, sensors, and connected devices around the clock. The rapid expansion of connected devices and streaming data sources has placed unprecedented pressure on databases. Monitoring tools must now handle massive data volumes, high write speeds, and complex query patterns without impacting performance.
Accelerated Cloud and Hybrid Adoption
Organizations are moving workloads to public cloud platforms, hybrid environments, and multi-cloud architectures at scale. Cloud spending continues to rise sharply, and cloud storage volumes are expanding into the hundreds of zettabytes. This shift requires monitoring platforms that are cloud-native, scalable, and capable of delivering real-time insights across distributed environments. Traditional on-premise tools are often unable to cope with the elasticity and geographic distribution of modern cloud systems.
Key Market Drivers and Their Impact
Growth Driver | Market Reality | Impact on Monitoring Tools
Data volume growth | Massive daily data creation | Requires high-throughput, scalable monitoring
Cloud adoption | Rapid increase in cloud spending | Demands cloud-native, distributed visibility
Business critical workloads | Low tolerance for downtime | Increases need for proactive monitoring
User experience expectations | Performance directly affects revenue | Forces faster detection and resolution
Emerging Technology Trends Shaping Database Monitoring
Several technology shifts are redefining what qualifies as a top-tier database monitoring solution in 2026.
AI and Machine Learning as Core Capabilities
Artificial intelligence and machine learning have become foundational rather than optional features. Modern monitoring platforms use AI to automate anomaly detection, predict failures, and optimize queries. These capabilities shift monitoring from reactive alerting to proactive prevention. Organizations report dramatic improvements in query performance and reductions in manual troubleshooting when AI-driven optimization is applied.
This evolution directly improves operational efficiency by reducing mean time to resolution and lowering the risk of outages. As a result, AI-powered monitoring is now a key differentiator among leading vendors.
Transition from Monitoring to Full Observability
The industry is moving decisively toward observability platforms that unify metrics, logs, traces, and user experience data. This approach allows teams to understand not just what failed, but why it failed and how it affected the business. Companies adopting observability report significant reductions in monitoring costs by optimizing data ingestion and focusing on high-value signals.
Cloud-Native and Multi-Cloud Readiness
Monitoring tools are increasingly designed for cloud-native environments, with built-in support for containerization, dynamic scaling, and cross-cloud deployments. Organizations are also shifting from simple on-premise-to-cloud migrations to cloud-to-cloud strategies, requiring monitoring solutions that work consistently across providers and regions.
Growth of Open-Source and Open Standards
Open-source databases and monitoring tools continue to gain trust for business-critical workloads. Standards such as OpenTelemetry are becoming central to telemetry collection, enabling flexibility and interoperability. This trend favors tools that avoid vendor lock-in and integrate easily with modern DevOps workflows.
Expansion of Specialized Databases and Architectures
The database ecosystem itself is diversifying. Vector databases, graph-based querying, data lakehouses, and data mesh architectures are becoming more common. Monitoring tools must now support a wide variety of data models and usage patterns, far beyond traditional relational databases.
Emerging Trends and Their Implications
Trend Area | What Is Changing | Implication for Monitoring Software
AI-driven optimization | Predictive and automated tuning | Faster resolution and higher reliability
Observability platforms | Unified view across the stack | Holistic understanding of data health
Open-source adoption | Greater flexibility and control | Requires extensibility and standards support
Specialized databases | New data models and workloads | Demands broader database compatibility
Strategic Relevance for Top Database Monitoring Software in 2026
The convergence of rapid data growth, cloud expansion, AI-driven automation, and observability has reshaped the database monitoring market. The Top 10 Best Database Monitoring Software in 2026 are those platforms that move beyond basic performance metrics and deliver intelligent, scalable, and holistic insights into data systems.
Organizations selecting monitoring tools in 2026 are not just choosing software for visibility, but investing in platforms that support long-term scalability, operational resilience, and data trust. As data becomes more central to competitive advantage, advanced database monitoring is now a strategic requirement rather than a technical afterthought.
Top Database Monitoring Software Solutions
Strategic Importance of Selecting the Right Database Monitoring Tool
Choosing the right database monitoring software has become a strategic decision rather than a purely technical one. In 2026, databases support mission-critical applications, real-time analytics, and customer-facing digital services. Any performance degradation, outage, or data inconsistency can directly affect revenue, customer trust, and operational stability. As a result, organizations are increasingly investing in advanced database monitoring platforms that go beyond basic metrics and deliver deep visibility, automation, and intelligent insights.
The leading database monitoring solutions available today reflect this shift. They combine performance monitoring with observability, AI-driven analytics, scalability for cloud and hybrid environments, and broad database compatibility. The Top 10 Best Database Monitoring Software in 2026 are those that consistently deliver reliability, actionable insights, and strong user satisfaction across diverse and complex infrastructures.
Overview of Leading Database Monitoring Solutions
The following platforms are widely recognized for their strengths in database monitoring, observability, and operational intelligence. Each solution addresses different organizational needs, from enterprise-scale observability to cost-efficient open-source flexibility.
Datadog
SolarWinds Database Performance Analyzer
Oracle Enterprise Manager
IBM Instana Observability
ManageEngine Applications Manager
Prometheus and Grafana
Site24x7
New Relic
AppDynamics
SigNoz
Comparative Overview of Top Database Monitoring Software
The table below summarizes the leading solutions, highlighting their core strengths, supported database types, and pricing approaches. This comparison helps organizations quickly assess which tools align best with their technical and budgetary requirements.
Rank | Software | Average User Rating | Core Strength | Supported Database Types | Pricing Approach
1 | Datadog | Very high across multiple platforms | Full-stack observability with AI insights and deep integrations | Relational, NoSQL, cloud-native databases | Modular and usage-based
2 | SolarWinds Database Performance Analyzer | Strong enterprise ratings | Agentless SQL performance tuning with very low overhead | Relational and major cloud databases | Annual subscription
3 | Oracle Enterprise Manager | High enterprise satisfaction | Deep lifecycle management for Oracle ecosystems | Primarily Oracle databases | Complex, usage-based licensing
4 | IBM Instana Observability | Consistently positive reviews | Real-time tracing with automatic discovery | SQL, NoSQL, and modern cloud databases | Per managed server with data usage
5 | ManageEngine Applications Manager | Excellent value ratings | Affordable, agentless end-to-end monitoring | Relational, NoSQL, in-memory, cloud databases | Per monitor and user
6 | Prometheus and Grafana | Strong community adoption | Flexible open-source metrics and visualization stack | Wide range via exporters | Free open-source or usage-based cloud
7 | Site24x7 | Very high SMB satisfaction | Lightweight, cost-effective full-stack monitoring | Relational, NoSQL, cloud databases | Per monitor subscription
8 | New Relic | High enterprise adoption | Unified observability with deep query insights | SQL, NoSQL, time-series, cloud databases | Consumption-based
9 | AppDynamics | Strong enterprise trust | Business transaction-centric monitoring | Broad enterprise and cloud databases | Per unit or per CPU pricing
10 | SigNoz | Strong developer community support | OpenTelemetry-native, cost-efficient observability | Core relational and NoSQL databases | Open-source or usage-based cloud
Key Differentiation Factors Across Leading Tools
The top database monitoring platforms in 2026 differentiate themselves across several critical dimensions.
Differentiation Area | What It Means for Organizations
Observability depth | Faster root cause analysis across apps and databases
AI and automation | Proactive detection and performance optimization
Database coverage | Support for diverse and modern data platforms
Pricing flexibility | Better long-term cost control
Operational overhead | Minimal impact on production workloads
How Organizations Use This Comparison
This overview is designed to support informed decision-making for IT leaders, DevOps teams, and database administrators. Some organizations prioritize deep enterprise observability and are willing to invest in premium platforms. Others focus on cost efficiency, open-source flexibility, or simplicity for smaller teams. There is no single “best” solution for every use case, but the tools listed here consistently rank among the strongest options available.
Why These Platforms Define the Top 10 in 2026
The Top 10 Best Database Monitoring Software in 2026 share a common set of characteristics: scalability for modern architectures, intelligent analytics, strong user satisfaction, and the ability to adapt to rapidly evolving data environments. As databases continue to sit at the core of digital operations, these platforms provide the visibility and control organizations need to maintain performance, reliability, and competitive advantage in the years ahead.
Comparative Analysis and Strategic Considerations
Understanding the Competitive Landscape
The database monitoring software market in 2026 is defined by diversity. Solutions vary widely in scope, depth, pricing, and intended audience. Some platforms focus on enterprise-scale observability, others prioritize SQL-level optimization, while open-source tools emphasize flexibility and control. A structured comparison across features, performance, scalability, cost, and usability helps organizations identify which tools best align with their technical maturity and business objectives.
Feature Capability Comparison Across Leading Platforms
Modern database monitoring tools now share a common foundation of core capabilities. Real-time performance metrics, query analysis, resource utilization tracking, and historical trend analysis are considered baseline features. What separates leading solutions is how deeply they extend beyond these basics.
Full-stack observability platforms such as Datadog and IBM Instana Observability excel at correlating database metrics with application traces, logs, and infrastructure data. Instana’s ability to capture all traces in real time provides especially deep visibility in microservices environments.
Database-centric tools such as SolarWinds Database Performance Analyzer specialize in SQL performance tuning, wait-event analysis, and query optimization. These tools are often preferred by database administrators who need granular insight rather than broad observability.
Broader monitoring suites like ManageEngine Applications Manager and Site24x7 emphasize ease of use, agentless deployment, and affordability. Open-source stacks such as Prometheus combined with Grafana provide unmatched customization for teams with strong internal expertise. SigNoz stands out for its OpenTelemetry-native approach and distributed tracing.
Business-impact-driven platforms such as New Relic and AppDynamics differentiate themselves by linking database performance directly to application behavior and business transactions.
Feature Differentiation Matrix
Platform Type | Core Strength | Ideal Users
Full-stack observability | End-to-end visibility and tracing | Large enterprises, microservices teams
Database-centric tuning | SQL optimization and wait analysis | DBAs and performance engineers
Affordable monitoring suites | Ease of use and broad coverage | SMBs and mid-sized IT teams
Open-source observability | Customization and vendor independence | DevOps and SRE teams
Business-transaction monitoring | Performance tied to business impact | Revenue-critical applications
Performance Overhead and Scalability Considerations
Monitoring tools must deliver insight without becoming a performance burden. Agentless platforms such as SolarWinds DPA and ManageEngine Applications Manager are frequently cited for extremely low overhead, often close to one percent CPU usage or less. Datadog agents typically consume minimal system resources, while New Relic’s monitoring footprint is commonly described as barely noticeable in production environments.
Oracle Enterprise Manager advertises near-zero overhead diagnostics, although some users report performance challenges in real-time testing or with excessive alerting. IBM Instana emphasizes non-intrusive data collection with a minimal footprint, even in highly dynamic environments.
Scalability is equally critical as data volumes grow. Cloud-native architectures and agentless designs tend to scale more effectively. Some platforms are proven to monitor hundreds or thousands of database instances. Open-source solutions can scale very well but often require careful tuning and strong internal expertise to manage large deployments.
Scalability Comparison Table
Scalability Factor | Commercial Platforms | Open-Source Platforms
Deployment speed | Fast, out-of-the-box | Requires setup and customization
Large-scale monitoring | Proven enterprise limits | High but expertise-dependent
Operational overhead | Low and predictable | Depends on configuration
Cloud readiness | Built-in cloud-native support | Requires architecture design
Cost Effectiveness and Return on Investment
Pricing models across database monitoring tools vary significantly. Open-source solutions eliminate licensing costs but require investment in skilled personnel for deployment, maintenance, and customization. Commercial platforms charge subscription or usage-based fees but offer faster time to value, professional support, and managed services.
Return on investment is strongly linked to reduced downtime, faster root cause analysis, improved query performance, and higher developer productivity. AI-driven optimization features, which can dramatically accelerate query performance and reduce manual tuning, significantly increase ROI. While premium platforms such as Datadog or AppDynamics are often viewed as expensive, their ability to prevent outages and streamline operations can justify the cost in complex enterprise environments. More affordable tools like Site24x7 and ManageEngine provide strong ROI for cost-sensitive organizations.
Cost and ROI Evaluation Matrix
Cost Model | Financial Impact | Best Fit
Open-source | Low license cost, higher staffing cost | Teams with strong in-house skills
Usage-based SaaS | Scales with consumption | Dynamic, cloud-native environments
Subscription-based | Predictable budgeting | Stable, long-term deployments
User Experience and Support Quality
Ease of use and support quality heavily influence adoption success. Platforms such as ManageEngine Applications Manager and Site24x7 consistently receive positive feedback for intuitive interfaces and responsive support. Datadog and New Relic are praised for polished dashboards but may present a learning curve due to feature depth. Oracle Enterprise Manager is often perceived as powerful but complex, requiring specialized expertise.
Open-source tools rely on community support and documentation. While communities are active and knowledgeable, the learning curve can be steep for teams without prior experience.
Open-Source Versus Commercial Strategy
The decision between open-source and commercial database monitoring solutions depends on organizational priorities. Open-source platforms offer flexibility, transparency, and freedom from vendor lock-in. They are ideal for teams that value control and have the technical resources to manage their own observability stack.
Commercial platforms emphasize ease of deployment, integrated features, and reduced operational burden. Licensing costs are offset by faster issue resolution, improved reliability, and lower internal workload. Many organizations now adopt hybrid approaches, using open standards such as OpenTelemetry while leveraging either managed commercial platforms or self-hosted solutions.
Strategic Guidance for 2026
The Top 10 Best Database Monitoring Software in 2026 reflect a market that has matured beyond simple metrics collection. The strongest platforms combine observability, intelligence, scalability, and usability. Organizations should evaluate tools not only on features and cost, but also on how well they align with internal expertise, data architecture, and long-term digital strategy. Selecting the right solution is no longer a tactical choice, but a foundational decision that directly impacts system resilience, operational efficiency, and business performance.
Recommendations
Evolving Market Context and Decision Complexity
The database monitoring market in 2026 is shaped by rapid data growth, widespread cloud adoption, and the deep integration of artificial intelligence into monitoring workflows. Database monitoring has expanded beyond basic performance tracking into full data observability, where performance, reliability, data quality, and lineage are monitored together. Organizations evaluating the Top 10 Best Database Monitoring Software in 2026 must therefore look beyond traditional metrics and consider long-term scalability, automation depth, operational impact, and strategic alignment with modern architectures.
Key Market Conclusions for 2026
Sustained Market Growth and Strategic Investment
Database monitoring software continues to attract strong investment as organizations recognize data as a mission-critical asset. Growth in both database monitoring and broader data observability confirms that enterprises are prioritizing data health, resilience, and reliability as core business enablers rather than optional IT functions.
AI and Machine Learning as Core Capabilities
Artificial intelligence and machine learning have become essential components of leading monitoring platforms. These technologies enable predictive issue detection, automated anomaly identification, and intelligent query optimization. Platforms that effectively apply AI consistently deliver faster issue resolution, lower operational workload, and stronger return on investment through reduced downtime and improved system efficiency.
Observability as a Competitive Requirement
Modern database environments are deeply interconnected with applications, services, and infrastructure. Tools that unify metrics, logs, and traces across the full stack provide a clear advantage. Observability-driven platforms enable teams to understand not only what failed, but why it failed and how it impacted users or business processes. This holistic visibility directly contributes to faster root cause analysis and lower operational costs.
Cloud-Native and Hybrid Readiness
As cloud storage volumes and hybrid deployments continue to expand, monitoring tools must be built for elastic, distributed environments. Cloud-native design, multi-cloud compatibility, and support for dynamic workloads are no longer optional. Tools that cannot scale seamlessly across cloud and hybrid infrastructures risk becoming bottlenecks as environments grow.
Monitoring Overhead as a Critical Selection Factor
The performance impact of monitoring tools themselves remains a decisive factor. Low-overhead architectures, including agentless approaches or highly optimized agents, help preserve system performance while controlling infrastructure costs. Monitoring solutions that consume excessive resources can undermine their own value.
Key Conclusions Summary Matrix
Conclusion Area | Strategic Implication
Market expansion | Monitoring is now a long-term strategic investment
AI-driven monitoring | Higher ROI through automation and prediction
Observability adoption | Faster resolution and lower operational risk
Cloud-native design | Essential for scalability and future readiness
Low overhead | Protects performance and cost efficiency
Strategic Recommendations for Organizations
Shift from Isolated Monitoring to Full Observability
Organizations should prioritize platforms that offer unified observability rather than siloed database-only monitoring. Integrated visibility across databases, applications, infrastructure, and user experience enables faster troubleshooting and more proactive performance management in complex environments.
Adopt AI-Driven Monitoring as a Baseline Requirement
When evaluating tools, decision-makers should closely examine AI and machine learning capabilities. Predictive analytics, automated anomaly detection, and intelligent recommendations are no longer advanced extras. They are essential for maintaining reliability at scale and reducing manual operational effort.
Evaluate Total Cost of Ownership, Not Just License Price
Cost evaluation must extend beyond subscription or licensing fees. Deployment effort, maintenance complexity, infrastructure usage, and staffing requirements all contribute to total cost of ownership. Open-source tools may reduce licensing costs but often require higher internal investment, while premium commercial platforms can deliver strong ROI through reduced downtime and operational efficiency.
Test Real-World Performance Impact
Proof-of-concept testing in production-like environments is critical. Vendor performance claims do not always reflect real-world behavior under specific workloads. Validating overhead, alert noise, and scalability during testing helps avoid unexpected performance issues after deployment.
Demand Broad Database and Deployment Support
Given the diversity of modern data environments, organizations should choose platforms that support multiple database types, including relational, NoSQL, and specialized databases. Support for on-premises, cloud, and hybrid deployments from a single interface reduces complexity and future-proofs the monitoring strategy.
Favor Open Standards for Long-Term Flexibility
Solutions that support open standards such as OpenTelemetry offer greater flexibility and reduce the risk of vendor lock-in. This approach allows organizations to retain control over telemetry data while maintaining the freedom to evolve their monitoring stack over time.
Recommendation Alignment Matrix
Recommendation Area | Business Benefit
Unified observability | Faster root cause analysis and lower downtime
AI-driven insights | Proactive issue prevention and higher efficiency
TCO-focused evaluation | Predictable costs and better ROI
Performance validation | Reduced operational risk
Multi-database support | Long-term scalability and flexibility
Open standards adoption | Vendor independence and adaptability
Final Guidance for 2026 and Beyond
Selecting database monitoring software in 2026 is a strategic decision with direct implications for performance, reliability, and business continuity. The Top 10 Best Database Monitoring Software in 2026 are those platforms that combine observability, intelligence, scalability, and efficiency while minimizing operational overhead. By aligning tool selection with evolving market trends and internal capabilities, organizations can protect critical data assets, improve operational resilience, and gain lasting competitive advantage in the data-driven economy.
Conclusion
As organizations enter 2026, database monitoring has evolved from a technical necessity into a strategic pillar of modern IT and data operations. Databases now sit at the core of digital products, analytics platforms, AI pipelines, and customer-facing applications. Any performance degradation, data inconsistency, or downtime can quickly translate into revenue loss, damaged user trust, and operational disruption. This reality makes the selection of the right database monitoring software one of the most important infrastructure decisions for technology leaders today.
Why Database Monitoring Matters More Than Ever
The scale and complexity of data environments continue to grow at an unprecedented pace. Cloud-native architectures, microservices, distributed databases, and hybrid or multi-cloud deployments have become the norm rather than the exception. In these environments, database issues rarely exist in isolation. A slow query might originate from inefficient application logic, a misconfigured API, or unexpected workload spikes driven by user behavior or automated systems.
The best database monitoring software in 2026 addresses this complexity by going beyond basic health metrics. Leading platforms provide deep visibility into query performance, resource utilization, dependencies, and real-time behavior across the entire stack. This holistic approach allows teams to understand not only what is happening inside the database, but also why it is happening and how it affects applications and users.
Key Themes That Define the Best Database Monitoring Tools in 2026
Across the Top 10 Best Database Monitoring Software in 2026, several common themes clearly stand out.
Observability over isolated monitoring
Modern solutions emphasize observability rather than siloed monitoring. By unifying metrics, logs, and traces, these tools enable faster root cause analysis and more accurate troubleshooting in distributed systems. This shift is critical for reducing mean time to resolution and minimizing business impact during incidents.
AI-driven intelligence and automation
Artificial intelligence and machine learning are no longer optional enhancements. They are core capabilities that power anomaly detection, predictive alerts, intelligent baselining, and automated query optimization. Tools that effectively leverage AI help teams move from reactive firefighting to proactive performance management, improving stability while reducing manual workload.
Cloud-native scalability and flexibility
The best platforms are designed to scale effortlessly across cloud, hybrid, and on-premise environments. Elastic architectures, usage-based pricing models, and support for modern deployment patterns ensure that monitoring solutions can grow alongside the business without becoming bottlenecks.
Low performance overhead and operational efficiency
Monitoring tools must deliver insight without compromising performance. Solutions with agentless designs or highly optimized lightweight agents consistently stand out for their ability to collect rich telemetry while maintaining minimal system impact. This balance is especially important for mission-critical production databases.
Broad database and ecosystem support
Modern organizations rarely rely on a single database technology. The leading monitoring tools support a wide range of relational, NoSQL, cloud-managed, and specialized databases, allowing teams to manage diverse environments from a single platform. This flexibility future-proofs monitoring strategies as data architectures continue to evolve.
No One-Size-Fits-All, but Clear Best-Fit Choices
There is no universal “best” database monitoring tool for every organization. Enterprises with complex, high-scale environments may prioritize deep observability, advanced AI, and enterprise-grade support. Mid-sized organizations and growing teams may focus on ease of use, affordability, and fast deployment. Engineering-driven teams may prefer open-source or OpenTelemetry-native solutions that offer maximum flexibility and vendor independence.
What defines the Top 10 Best Database Monitoring Software in 2026 is not just feature depth, but the ability to align with specific organizational needs, technical maturity, and long-term strategy. The strongest platforms consistently deliver measurable value by preventing outages, optimizing performance, improving developer productivity, and ensuring data reliability.
Strategic Takeaway for Decision Makers
Selecting database monitoring software in 2026 should be treated as a strategic investment rather than a routine tooling decision. Decision makers should evaluate solutions based on total cost of ownership, scalability, performance impact, automation capabilities, and alignment with modern observability practices. Proof-of-concept testing, clear success metrics, and realistic workload simulations are essential steps before committing to any platform.
Organizations that invest in the right database monitoring solution position themselves to operate with greater confidence, resilience, and agility. They gain the visibility needed to support continuous growth, deliver consistent user experiences, and maintain trust in their data systems.
Final Perspective
The Top 10 Best Database Monitoring Software in 2026 represent the forefront of how organizations manage, protect, and optimize their most critical data assets. These platforms reflect a broader shift toward intelligent, scalable, and observability-driven operations. By choosing a solution that matches both current requirements and future ambitions, organizations can transform database monitoring from a reactive necessity into a proactive competitive advantage in an increasingly data-driven world.
If you find this article useful, why not share it with your hiring manager and C-level suite friends and also leave a nice comment below?
We, at the 9cv9 Research Team, strive to bring the latest and most meaningful data, guides, and statistics to your doorstep.
To get access to top-quality guides, click over to 9cv9 Blog.
To hire top talents using our modern AI-powered recruitment agency, find out more at 9cv9 Modern AI-Powered Recruitment Agency.
People Also Ask
What is database monitoring software in 2026?
Database monitoring software in 2026 tracks database performance, availability, and health in real time, helping teams detect issues early, optimize queries, and prevent downtime in modern cloud and hybrid environments.
Why is database monitoring important for modern businesses?
Database monitoring ensures stable application performance, faster query execution, and high availability, which directly impacts user experience, revenue, and business continuity.
What features should the best database monitoring tools include in 2026?
Top tools offer real-time metrics, query analysis, anomaly detection, AI-driven insights, low overhead, and support for cloud, hybrid, and multi-database environments.
How does database monitoring improve application performance?
By identifying slow queries, resource bottlenecks, and connection issues, monitoring tools help teams fix problems quickly before they affect applications or users.
What is the difference between database monitoring and observability?
Database monitoring focuses on database metrics, while observability connects database data with application traces, logs, and infrastructure for full root cause analysis.
Are AI-powered database monitoring tools worth it?
Yes, AI-driven tools help predict issues, detect anomalies automatically, and optimize queries faster, reducing downtime and manual troubleshooting.
Which databases are commonly supported by monitoring software?
Most tools support relational databases like MySQL and PostgreSQL, NoSQL databases like MongoDB and Redis, and cloud-managed databases.
Can database monitoring tools work in cloud environments?
Yes, leading database monitoring software in 2026 is cloud-native and supports public cloud, hybrid, and multi-cloud deployments.
What is low-overhead database monitoring?
Low-overhead monitoring collects performance data using lightweight agents or agentless methods without slowing down production databases.
How do monitoring tools help reduce database downtime?
They provide early alerts, performance trends, and root cause insights, allowing teams to fix issues before outages occur.
Is open-source database monitoring software reliable?
Open-source tools are reliable when properly configured and maintained, but they often require more internal expertise compared to commercial solutions.
What is agentless database monitoring?
Agentless monitoring collects database metrics without installing agents on database servers, reducing maintenance effort and performance impact.
How do database monitoring tools support DevOps teams?
They provide real-time visibility, automated alerts, and performance insights that help DevOps teams deploy faster and resolve issues quickly.
What pricing models are common for database monitoring software?
Common models include usage-based pricing, subscription plans, per-host pricing, and free open-source options with paid managed services.
How does database monitoring help with scalability?
Monitoring tools track resource usage and performance trends, helping teams plan capacity and scale databases efficiently.
What is query performance monitoring?
Query performance monitoring analyzes execution time, frequency, and resource usage of queries to identify and optimize slow SQL operations.
Can database monitoring tools prevent performance issues?
Yes, predictive analytics and anomaly detection help identify potential problems before they impact performance.
How do monitoring tools handle hybrid database environments?
They provide unified dashboards that monitor on-premises and cloud databases together for consistent visibility.
What role does OpenTelemetry play in database monitoring?
OpenTelemetry standardizes how metrics and traces are collected, improving interoperability and reducing vendor lock-in.
Are database monitoring tools suitable for small businesses?
Yes, many tools offer affordable plans and simple setups designed for small and mid-sized businesses.
What is real-time database monitoring?
Real-time monitoring provides immediate visibility into database performance, enabling faster alerts and quicker responses.
How do database monitoring tools improve security?
They detect unusual activity, performance anomalies, and access patterns that may indicate security issues.
What metrics are commonly tracked by database monitoring software?
Common metrics include query latency, CPU usage, memory, disk I/O, connections, and error rates.
How long does it take to set up database monitoring software?
Setup time ranges from minutes for cloud-based tools to days for complex enterprise or open-source deployments.
Can database monitoring tools integrate with alerting systems?
Yes, most tools integrate with email, messaging apps, and incident management systems for real-time alerts.
What is the ROI of using database monitoring software?
ROI comes from reduced downtime, faster troubleshooting, improved performance, and lower operational costs.
How often should database performance be reviewed?
Performance should be monitored continuously, with regular reviews of trends and alerts to maintain stability.
Do database monitoring tools support microservices architectures?
Yes, modern tools are designed to monitor databases within distributed microservices environments.
What should be considered when choosing database monitoring software?
Consider database compatibility, scalability, pricing, overhead, AI features, and ease of use.
Is database monitoring a one-time setup or ongoing process?
It is an ongoing process that requires tuning alerts, reviewing trends, and adapting to changing workloads.
Sources
The Business Research Company
Research and Markets
SigNoz
Baremon
Middleware
Apptad
Redgate
Data Insights Market
CloudZero
Google Cloud Blog
Forrester
AI2SQL
Ataccama
Datafold
Secoda
TechChannel
Gartner
TrustRadius
Last9
Datadog
Uptrace
PeerSpot
SolarWinds
Info-Tech
Oracle
IBM
Amazon Web Services
Softacus
ManageEngine
G2
GitHub
Prometheus
Grafana
AppDynamics
Splunk
Crozdesk
Spendflo
ClickHouse
eInfochips
Pantheon
Dynatrace

")


