

























Key Takeaways
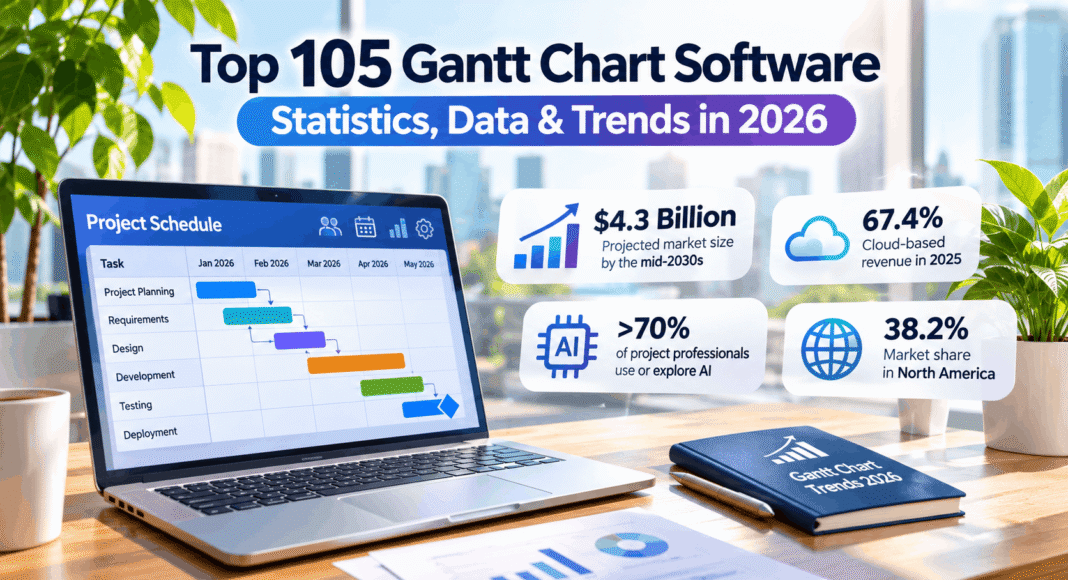
- Gantt Chart Software Market Growth: The global Gantt chart software market is projected to grow from $1.8 billion in 2025 to approximately $4.3 billion by the mid-2030s, driven by increasing demand for project scheduling and automation.
- AI and Cloud Adoption: Cloud-based solutions accounted for an estimated 67.4% of Gantt chart software revenue in 2025, while over 70% of project professionals work in organizations using or exploring AI-powered project management tools.
- Project Efficiency and Future Trends: With 97% of project professionals managing complex projects, businesses are increasingly prioritizing Gantt chart software featuring real-time collaboration, dependency tracking, predictive analytics, and resource optimization.
Gantt chart software statistics for 2026 highlight growing demand for AI-powered scheduling, cloud collaboration, and project management automation. The global market is projected to reach $4.3 billion by the mid-2030s, while cloud solutions account for approximately 67.4% of revenue. Explore 105 statistics covering market growth, software adoption, pricing, and project performance.
Gantt chart software has become an essential tool for modern project management, helping businesses plan complex projects, visualize timelines, manage task dependencies, allocate resources, and monitor progress in real time. As organizations face increasing pressure to deliver projects on schedule and within budget, demand for cloud-based project scheduling software, AI-powered automation, and collaborative project management platforms continues to grow.
Also, read our article on the Top 10 Best Gantt Chart Software To Know.
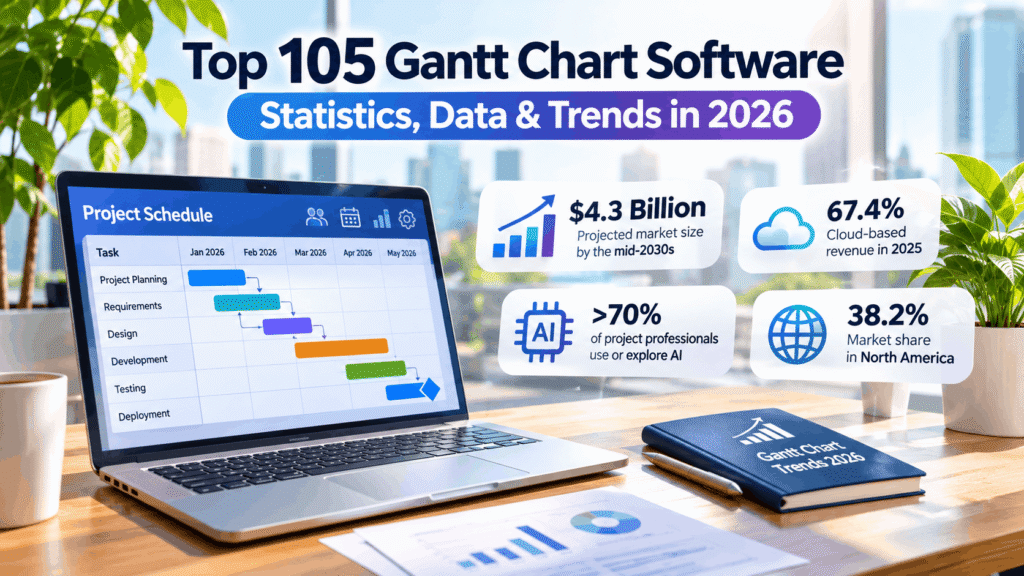
In 2026, the Gantt chart software market is undergoing significant transformation, driven by artificial intelligence, hybrid work arrangements, digital transformation initiatives, and the growing complexity of business projects. Market research estimates place the global Gantt chart software market at approximately $1.8 billion in 2025, with projections suggesting it could reach $4.3 billion by the mid-2030s. Depending on market definitions and research methodologies, industry forecasts indicate compound annual growth rates ranging from 8.9% to 15.6%, highlighting sustained demand for advanced project planning and scheduling solutions.
Cloud adoption is another major factor shaping the Gantt chart software industry. According to the market estimates compiled for this report, cloud-based solutions accounted for approximately 67.4% of global Gantt chart software revenue in 2025, reflecting businesses’ increasing preference for accessible, scalable, and collaborative project management tools. North America led the market with an estimated 38.2% revenue share, followed by Europe at approximately 27.5%.
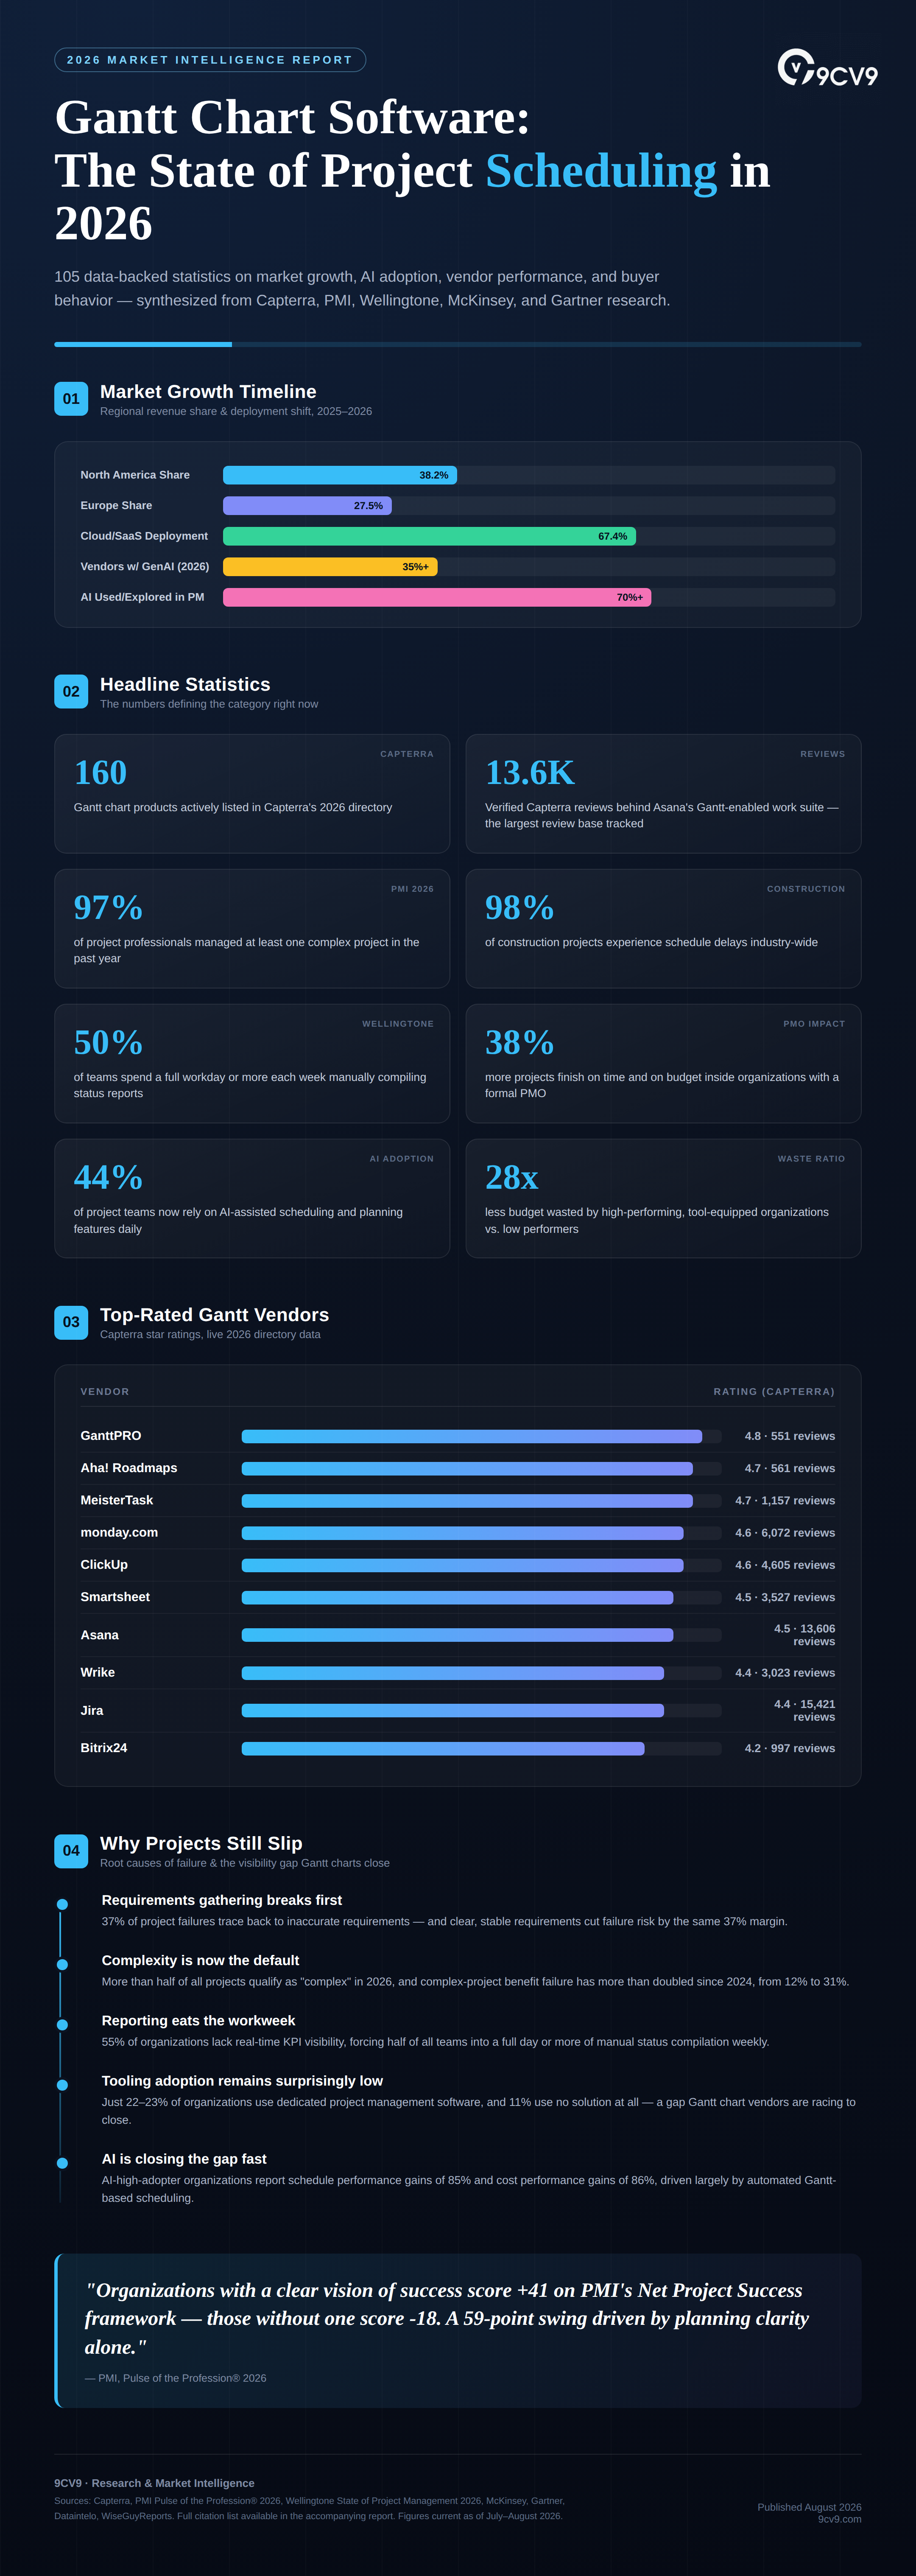
Meanwhile, artificial intelligence is fundamentally changing how project managers create schedules, predict delays, and optimize resources. Industry research referenced in this report suggests that more than 70% of project professionals work in organizations that are using or exploring AI in project management, while 47% report that AI is already having a measurable impact on project delivery. AI-powered Gantt chart software increasingly incorporates automated scheduling, predictive analytics, intelligent resource allocation, and natural-language project planning capabilities.
Despite these technological advancements, project execution remains a significant challenge. Research compiled from the Project Management Institute (PMI) and other industry studies highlights persistent problems involving project complexity, budget overruns, missed deadlines, and inefficient resource management. PMI’s 2026 research indicates that 97% of project professionals managed at least one complex project during the previous year, while approximately 80% of complex projects experienced negative consequences associated with poorly managed complexity.
These challenges help explain why organizations are investing in more sophisticated project management software. Modern Gantt chart tools extend beyond traditional timeline visualization, offering real-time collaboration, critical path analysis, milestone tracking, workload management, automated reporting, and integrations with enterprise business systems.
The competitive landscape is also expanding. Leading Gantt chart software providers such as Microsoft Project, Smartsheet, Asana, monday.com, ClickUp, Wrike, GanttPRO, and TeamGantt are competing through AI capabilities, flexible pricing, integrations, and improved user experiences. Capterra’s 2026 Gantt chart software directory includes approximately 160 products, illustrating the variety of solutions available to businesses of different sizes and industries.
Understanding these developments is increasingly important for project managers, business leaders, construction companies, software development teams, IT departments, and organizations evaluating project scheduling technology.
This comprehensive guide explores the top 105 Gantt chart software statistics, data, and trends in 2026, covering global market size, industry growth forecasts, AI adoption, cloud deployment, software pricing, user preferences, project success rates, and emerging project management technologies.
By examining these Gantt chart software statistics and industry insights, businesses can better understand the evolving project management software market, compare available solutions, identify opportunities to improve project delivery, and make more informed technology investment decisions in 2026 and beyond.
Before we venture further into this article, we would like to share who we are and what we do.
About 9cv9
9cv9 is a business tech startup based in Singapore and Asia, with a strong presence all over the world.
With over ten years of startup and business experience, and being highly involved in connecting with thousands of companies and startups, the 9cv9 team has listed some of the top and best companies/tools in this review.
If you like to get your company listed in our top B2B software reviews, check out our world-class 9cv9 Media and PR service and pricing plans here.
Top 105 Gantt Chart Software Statistics, Data & Trends in 2026
1. Market Size, Growth & Category Landscape
- The Gantt chart software segment sits inside a broader project-scheduling market valued between roughly $500 million and $2.6 billion depending on scope definition, with most forecasts pointing to double-digit annual growth through the early 2030s. Market sizing for niche categories like Gantt charts varies widely by research firm, but the consistent thread across reports is sustained double-digit CAGR growth.
- Multiple market analysts project a compound annual growth rate (CAGR) between 8.9% and 15.6% for Gantt/project-scheduling software through 2030–2035. This growth trajectory signals that demand for visual project-scheduling tools is accelerating rather than plateauing.
- One widely cited estimate places the global Gantt chart software market at $1.8 billion in 2025, forecast to reach approximately $4.3 billion by the mid-2030s. The near 2.4x growth multiple underscores how central Gantt-based scheduling has become to modern project delivery.
- North America accounted for roughly 38.2% of global Gantt chart software revenue in 2025, the largest of any region. North America’s dominance reflects its concentration of SaaS-native enterprises and early cloud-project-management adoption.
- Europe followed as the second-largest regional market, capturing approximately 27.5% of global Gantt chart software revenue in 2025. Europe’s strong share reflects widespread PMO formalization and regulatory-driven project governance across the EU.
- Cloud-based deployments represented roughly 67.4% of total Gantt chart software revenue in 2025, confirming SaaS as the dominant delivery model. The shift away from on-premises scheduling tools mirrors the broader SaaS migration seen across enterprise software categories.
- By early 2026, more than 35% of top-tier Gantt software vendors had incorporated generative AI assistants capable of drafting project plans from plain-language prompts. This rapid AI integration is compressing the time required to move from project kickoff to a working schedule.
- The wider project management software market — of which Gantt chart tools are a core feature set — is projected by several analysts to approach $9.8 billion by 2026. Gantt chart functionality remains one of the most requested features across this broader project management software category.
- Key players repeatedly named across Gantt chart market reports include Microsoft, Smartsheet, Asana, monday.com, Wrike, TeamGantt, GanttPRO, ClickUp, Atlassian (Jira), and Trello. This competitive spread shows the category is contested by both dedicated Gantt specialists and broad-suite project management platforms.
- Segmentation by deployment type, enterprise size, vertical, and geography is now standard across Gantt chart software market reports. This granular segmentation reflects how differently a solo freelancer, an SMB, and a Fortune 500 PMO shop for Gantt chart capability.
2. Capterra Category & Directory Landscape (Live Data)
- Capterra’s Gantt chart software directory currently lists 160 filterable products as of mid-2026. This breadth of options makes independent, review-based comparison shopping essential rather than optional for buyers.
- Capterra’s Gantt chart software category page was last substantively updated on July 14, 2026, reflecting an actively maintained, current buyer’s guide. Regular content refreshes on major directories signal continuous vendor churn and feature evolution in this space.
- GanttPRO holds a 4.8-star Capterra rating across 551 verified reviews, one of the highest-rated dedicated Gantt tools on the platform. GanttPRO’s consistently high rating reflects strong user sentiment toward its auto-scheduling and dependency-update features.
- 91% of Capterra reviewers recommend GanttPRO to other buyers. A 91% recommendation rate is a strong buy signal for teams evaluating dedicated, standalone Gantt chart software.
- Aha! Roadmaps carries a 4.7-star Capterra rating from 561 reviews and ships with more than 10 built-in Gantt chart templates. Aha!’s template depth caters especially to product management teams layering Gantt views on top of roadmap planning.
- 88% of Capterra reviewers recommend Aha! Roadmaps. This high recommendation rate places Aha! among the more trusted product-Gantt hybrid tools on the market.
- Asana’s Gantt-enabled project management suite has accumulated 13,606 Capterra reviews at a 4.5-star average — the largest review volume of any Gantt-capable tool tracked. Asana’s review volume alone signals it is among the most widely adopted work-management platforms with native Gantt/timeline views.
- monday.com holds a 4.6-star Capterra rating across 6,072 reviews for its Gantt chart feature set. monday.com’s strong rating-to-volume ratio reflects broad satisfaction with its visual timeline and dependency-mapping tools.
- ClickUp’s Gantt chart capability is rated 4.6 stars from 4,605 Capterra reviews, with an 84% recommendation rate. ClickUp markets itself as a converged AI workspace, and its Gantt rating suggests that positioning is resonating with reviewers.
- Smartsheet carries a 4.5-star Capterra rating across 3,527 reviews for Gantt and work-execution features. Smartsheet’s consistent 4.5-star performance across thousands of reviews cements its position as an enterprise-grade Gantt and work-management platform.
- Wrike’s AI-powered Gantt charts are rated 4.4 stars from 3,023 Capterra reviews. Wrike’s explicit AI-powered Gantt positioning reflects the broader industry shift toward predictive, automation-assisted scheduling.
- Jira is rated 4.4 stars across 15,421 Capterra reviews, the second-highest review volume in the Gantt-capable category, largely driven by agile software teams. Jira’s massive review count illustrates how deeply Gantt-adjacent timeline views have penetrated software development workflows.
- Miro’s Gantt-capable “AI Innovation Workspace” holds a 4.7-star rating from 1,693 Capterra reviews with an 86% recommendation rate. Miro’s high rating shows visual-collaboration-first tools are increasingly credible alternatives to traditional Gantt software.
- Procore, a construction-focused platform with Gantt scheduling, carries a 4.5-star Capterra rating across 2,665 reviews and an 82% recommendation rate. Procore’s strong construction-vertical rating confirms Gantt charts remain foundational to job-site scheduling software.
- Bitrix24’s Gantt-enabled project management platform is rated 4.2 stars from 997 Capterra reviews. Bitrix24 markets itself as the #1 project management platform with Gantt charts and task dependencies, a claim its substantial review base helps substantiate.
3. Vendor Feature Set & Buyer Preferences (Capterra Data)
- The nine most-valued Gantt chart features cited by Capterra reviewers are Alerts/Notifications, Dependency Tracking, Drag & Drop, Milestone Tracking, Prioritization, Project Planning, Resource Management, Search/Filter, and Task Scheduling. This consistent nine-feature core defines the minimum viable feature set buyers now expect from any Gantt chart tool.
- Dependency tracking appears as a top-valued feature across virtually every reviewed Gantt product on Capterra, regardless of vendor size. Dependency tracking’s universal presence confirms it is now a baseline expectation rather than a differentiator.
- Drag-and-drop scheduling is consistently ranked among the top features Capterra reviewers cite when evaluating Gantt chart software. The premium placed on drag-and-drop usability reflects how much buyers prioritize ease of use over raw feature count.
- AI Copilot and Generative AI are now listed as filterable key features within Capterra’s Gantt chart software directory. The formal addition of AI-related filters on Capterra signals AI has moved from novelty to a standard purchasing criterion.
- Capterra’s Gantt chart directory allows filtering across ten deployment types, including Cloud/SaaS/Web-Based, Desktop (Mac, Windows, Linux), On-Premise (Windows, Linux), Chromebook, and Mobile (Android, iPhone, iPad). This deployment breadth confirms Gantt chart software buyers now expect true cross-platform availability as standard.
- 85% of professionals opt for a 30-day free trial before purchasing project management or Gantt chart software. The dominance of the 30-day trial window shows vendors have converged on a near-universal evaluation period for buyer confidence.
- Project management software with native Gantt chart capabilities ranges from roughly $4 to $31 per user, per month, when billed annually across publicly priced tools. This near 8x price spread means procurement teams should benchmark multiple tiers rather than assume a single market rate.
- Most Gantt-capable vendors offer free trials ranging from 15 to 30 days, giving teams a low-risk evaluation window before committing to a subscription. A generous trial window has become a competitive necessity rather than a bonus in the crowded Gantt software market.
- Capterra’s own pricing research places most entry-level Gantt chart software offerings in three tiers: $0–$7, $7–$25, and $25+ per user per month. These three pricing bands give budget-conscious teams a clear framework for shortlisting vendors by cost tier.
- Zoho, Smartsheet, monday.com, Asana, ClickUp, Businessmap, Hive, Odoo, and Paymo were named among Capterra’s top 10 project management tools with native Gantt charts for 2026. This shortlist reflects the current consensus “best of” list that most buyer’s guides converge around in 2026.
4. AI & Automation Transforming Gantt/Project Scheduling
- 70%+ of project professionals report their organizations are using or exploring AI within project management workflows, including scheduling tools. This majority-adoption figure confirms AI is no longer experimental in project scheduling but a mainstream capability.
- By 2026, up to 80% of Project Management Offices (PMOs) are expected to use AI for decision-making support. This projected surge in AI-assisted PMO decision-making will likely accelerate demand for AI-native Gantt chart features like auto-scheduling and risk flagging.
- 44% of project teams now rely on AI-assisted project management features in their daily workflows. Nearly half of teams leaning on AI-assisted features shows the technology has crossed from pilot to production use.
- 32% of organizations report AI tools are already fully integrated into their project management workflows. This integration rate suggests roughly a third of organizations have moved past experimentation into operational AI reliance.
- The AI-enabled project management software market is projected to grow at a CAGR near 40%, far outpacing the broader project management software market. This growth differential shows AI-enabled scheduling tools are the fastest-expanding subcategory within project management software overall.
- 54% of project professionals report using generative AI in 16–50% of their projects, while 20% use it in more than half. This distribution shows GenAI use in project management is becoming routine rather than occasional.
- PMI research shows the top perceived AI benefit in project management is automation of routine tasks (27%), followed by improved data-driven decision-making (17%) and generation of additional insights (11%). Task automation being the leading benefit highlights why AI-driven auto-scheduling is such a high-priority Gantt chart feature.
- In 2025, the top barrier to AI adoption in project management was resistance to change (26%); by 2026, that barrier shifted to lack of understanding (32%). This shift from cultural resistance to a knowledge gap suggests vendor-led training and onboarding are now the key adoption unlock.
- A third of high-performing organizations now commit more than 20% of their digital budgets to AI initiatives, including project and scheduling tools. This budget commitment reflects how central AI capability has become to competitive project delivery strategy.
- 47% of project management respondents agree AI is currently having a measurable impact on their organization’s project delivery. Nearly half reporting measurable AI impact indicates the technology has moved beyond hype into demonstrable value.
- AI-high-adopter organizations report gains of 91% in quality, 87% in scope adherence, 86% in cost performance, and 85% in schedule performance. These gains across all four core project dimensions make a compelling case for prioritizing AI-capable Gantt and scheduling tools.
- 85% of project managers believe AI has meaningful potential to improve project outcomes. This overwhelming professional confidence in AI’s potential signals continued vendor investment in AI-powered scheduling features is well justified.
5. Project Success, Failure & Financial Impact
- PMI’s Pulse of the Profession® 2026 found that 97% of project professionals managed at least one complex project in the past year. Near-universal exposure to project complexity explains why visual tools like Gantt charts, which simplify complexity, remain indispensable.
- More than half of all projects now qualify as “complex” according to PMI’s 2026 research, up sharply from prior years. This tipping point toward majority-complex projects reinforces the growing need for dependency-aware scheduling tools rather than static spreadsheets.
- Roughly 31% of complex projects fail to achieve their originally intended scope of benefits in 2026, more than double the 12% failure rate recorded in 2024. This steep year-over-year jump in complex-project failure highlights an urgent, growing need for better scheduling and dependency visibility.
- Four out of five (80%) complex projects experience some negative fallout from poorly managed complexity. This 80% figure shows negative outcomes from complexity are now closer to the norm than the exception.
- Only about 35–50% of projects worldwide are considered fully successful, depending on the strictness of the success definition used. This wide success-rate range underscores how measurement methodology significantly shapes reported project outcomes.
- PMI’s Net Project Success Score (NPSS) framework shows having a clear vision of success drives a +41 score, while lacking one produces -18 — a 59-point swing. This dramatic swing demonstrates that upfront planning clarity, which Gantt charts help visualize, is one of the single biggest predictors of project success.
- Organizations waste an estimated 9.9–12 cents of every dollar spent on projects due to poor project performance. At scale, this waste rate translates into trillions of dollars in lost value across the global project economy every year.
- For a mid-sized company running a $10 million project portfolio, roughly $1.1 million is lost annually to poor project performance. This concrete dollar figure makes the ROI case for investing in proper scheduling and Gantt chart tooling tangible for budget owners.
- High-performing organizations — those completing 80%+ of projects on time, on budget, and on goal — waste up to 28 times less money than low-performing peers. This 28x waste differential is one of the strongest data points supporting investment in disciplined, tool-supported project scheduling.
- Organizations with a Project Management Office (PMO) complete 38% more projects on time and on budget than organizations without one. PMO-backed organizations’ outsized on-time performance strengthens the case for centralized, Gantt-chart-driven scheduling governance.
- Only 43% of projects are completed within their originally approved budget. With fewer than half of projects staying on budget, real-time cost-tracking integration within Gantt tools has become a critical buying criterion.
- 37% of project failures are linked directly to inaccurate or poorly gathered requirements. Requirements-driven failure being the top cause reinforces why Gantt charts’ upfront planning and dependency-mapping stage is so critical.
- Clear, stable requirements have been shown to reduce project failure risk by 37%. This risk-reduction figure gives project leaders a concrete, evidence-based reason to invest more time in the planning phase before scheduling begins.
- Only 23% of organizations use standardized project management practices consistently across their entire portfolio. This low standardization rate suggests significant room remains for broader Gantt-chart-based process consistency across enterprises.
- Projects with clearly tracked metrics over their full lifecycle are nearly twice as likely to succeed as those without. Continuous metric tracking — a core Gantt chart software capability — nearly doubles the odds of project success.
- The Standish Group’s CHAOS Report found only 29.7% of software development projects were fully successful in meeting time, budget, and quality goals simultaneously. Fewer than 3 in 10 software projects hitting all three success criteria highlights the scale of the scheduling and planning challenge software teams face.
- 70% of digital transformation projects fail to meet their original objectives, according to McKinsey research. This high digital-transformation failure rate makes visual, dependency-aware scheduling tools a critical risk-mitigation investment for transformation programs.
6. PMO, Methodology & Organizational Practices
- Only 22–23% of organizations use dedicated project management software at all, according to Wellingtone’s research. This surprisingly low adoption rate signals a large addressable market still relying on spreadsheets or ad hoc tracking instead of purpose-built Gantt tools.
- 55% of organizations report they lack access to real-time project KPIs. More than half operating without real-time KPI visibility underscores the value proposition of live, cloud-synced Gantt dashboards.
- 50% of respondents say they spend one or more full working days per week manually collating project status reports. Losing an entire workday weekly to manual reporting is a direct, quantifiable productivity case for automated Gantt chart reporting features.
- 77% of high-performing projects use dedicated project management software, compared to significantly lower usage among underperforming projects. This correlation between tool adoption and high performance is one of the clearest data-backed arguments for investing in Gantt chart software.
- 66% of project managers say they would use project management software more extensively if they received adequate organizational support. This gap between willingness and enablement points to training and change management, not tool availability, as a key adoption bottleneck.
- Between 2017 and 2018, spreadsheet usage for managing agile projects dropped from 74% to 67% as teams migrated to specialized PM tools — a trend that has continued through 2026. This multi-year decline in spreadsheet reliance illustrates the steady, structural shift toward dedicated Gantt and PM software.
- As of 2026, 14% of project teams still rely on Microsoft Excel for project planning. With over 1 in 8 teams still on spreadsheets, meaningful headroom remains for dedicated Gantt chart software adoption.
- 11% of project teams report using no project management solution at all. This persistent adoption gap represents a clear greenfield opportunity for Gantt chart software vendors targeting under-tooled teams.
- 24.6% of companies now use Agile project management practices such as Scrum, up from 23% in 2020. Agile’s gradual but steady growth means Gantt chart vendors increasingly need to support hybrid Agile-Waterfall timeline views.
- 31.5% of companies use hybrid project management models that blend predictive and Agile practices. This hybrid-methodology majority explains why modern Gantt chart tools increasingly ship with both timeline and Kanban-board views in one platform.
- 43.9% of organizations still rely primarily on predictive (Waterfall) project management approaches, down from 58% in 2020. Despite the decline, Waterfall’s continued near-44% share confirms traditional Gantt chart scheduling remains foundational rather than obsolete.
- Only 36% of organizations mostly or always complete projects on time, according to Wellingtone’s 2026 report. With fewer than 4 in 10 organizations reliably on-time, schedule-visibility tools like Gantt charts remain a critical performance lever.
- Hybrid project management methodology adoption increased by 57% between two consecutive Wellingtone annual reports. This sharp rise in hybrid methodology adoption is reshaping what buyers expect from modern Gantt chart feature sets.
- Only 45% of PMOs report having clearly defined roles and responsibilities. Unclear PMO structure is frequently cited as a root cause of the reporting and visibility gaps that Gantt-chart-centric software is designed to close.
- 42% of project managers don’t follow a defined project management methodology, making their projects 15% less likely to meet goals and stay within budget. This methodology gap and its measurable performance cost make a strong case for structured, tool-enforced scheduling discipline.
- 56% of organizations have already developed a digital transformation strategy that explicitly incorporates AI. More than half embedding AI into transformation strategy signals continued acceleration of AI-powered Gantt and scheduling feature adoption.
7. Construction & Industry-Specific Gantt Chart Usage
- 98% of construction projects experience schedule delays, with average project duration extending 37% longer than originally planned. This near-universal delay rate makes Gantt-chart-based schedule and critical-path tracking essential rather than optional in construction.
- 35% of construction professionals’ working time goes toward non-productive activities, according to industry research. Roughly a third of construction labor time being non-productive highlights the scheduling-visibility gap that Gantt charts are specifically designed to close.
- The U.S. construction industry recorded roughly $280 billion in costs tied to slow payments in 2024 alone. This massive figure shows how closely schedule slippage and cash-flow disruption are linked in the construction sector.
- 82% of contractors now face payment delays stretching beyond 30 days, up from 49% just two years earlier. This near-doubling of payment-delay prevalence underscores why integrated schedule-and-billing visibility inside Gantt tools has become a priority feature for construction firms.
- Construction scheduling software buyers consistently rank Gantt charts, critical path analysis, and task dependency mapping as their top three must-have features. This consistent feature ranking confirms Gantt charts remain the backbone of construction project scheduling technology.
- GanttPRO’s construction-focused users report Capterra and G2 ratings of 4.8 out of 5 as of January 2026. This top-tier rating from construction-sector users reflects strong satisfaction with dedicated Gantt scheduling tools in the built environment.
- Construction management platforms with native Gantt charts, like Procore, now integrate scheduling directly with financials, RFIs, and daily field logs. This convergence of scheduling and financial data in one platform reflects growing demand for end-to-end construction project visibility.
- Mobile field-update capability is now considered a baseline requirement across leading construction Gantt and scheduling software. The universal expectation of mobile schedule updates reflects how distributed and job-site-driven construction project management has become.
8. Remote & Hybrid Work Driving Gantt Software Demand
- 52% of remote-capable U.S. employees now work in a hybrid arrangement, with 27% fully remote and only 21% fully on-site. This hybrid-majority workforce distribution is a direct driver of demand for cloud-based, real-time Gantt chart collaboration tools.
- In 2026, 54% of knowledge workers globally work in a hybrid model, while 17% are fully remote. Over half of the global knowledge workforce operating hybrid reinforces cloud-native Gantt software as the default rather than the exception.
- Well-organized hybrid teams are approximately 5% more productive than fully remote teams, according to workplace research. This modest but meaningful productivity edge highlights the value of structured, visual coordination tools like shared Gantt timelines for hybrid teams.
- 90% of employees say they need better technology to work effectively, yet only about 1 in 3 companies are actively investing in it. This gap between employee need and organizational investment represents a clear opportunity for better-equipped teams using modern Gantt chart tools to outperform peers.
- 75% of employees globally say their remote or hybrid work software needs improvement. With three-quarters of the workforce unsatisfied with their current tools, Gantt chart software vendors focused on usability have a clear opening to win market share.
- “Tool fatigue” is cited by 49% of employees as a top-three frustration with hybrid work. This finding suggests Gantt chart platforms that consolidate scheduling, communication, and reporting into a single interface hold a meaningful competitive advantage.
- Virtual whiteboard tools like Miro have seen 156% growth since 2023, reflecting rising demand for visual, collaborative planning tools that often incorporate Gantt-style timelines. This surge in visual-collaboration tool adoption parallels and reinforces the growth of Gantt chart software more broadly.
9. Buyer Behavior, Pricing & Procurement Trends
- Gantt chart and project management software buyers overwhelmingly favor per-user, per-month subscription pricing over one-time licenses. This subscription-first pricing preference reflects the broader SaaS-ification of project management software procurement.
- Free-version or freemium plans are now offered by a majority of Gantt chart software vendors targeting solo users and small teams. Widespread freemium availability has significantly lowered the barrier to entry for individuals and micro-businesses evaluating Gantt chart tools.
- API access is now listed as a filterable, in-demand feature within Capterra’s Gantt chart software directory. The formal inclusion of API access as a buyer filter reflects growing enterprise demand for Gantt tools that integrate into broader tech stacks.
- Capterra scores every listed Gantt chart product on two dimensions — user ratings and popularity — combining verified reviews with public data and vendor-submitted information. This dual-dimension scoring methodology gives buyers a more balanced signal than star ratings alone.
- Templates are now a standard filterable feature across Gantt chart software listings, reflecting demand for faster project setup. Built-in templates have become a competitive differentiator for vendors targeting time-constrained project managers.
- Resource management functionality is consistently ranked among the top features Gantt chart software buyers filter for on Capterra. This consistent demand shows buyers increasingly view Gantt charts as workforce-capacity tools, not just timeline visualizers.
- The project management profession is projected to require 25–30 million additional professionals globally by the early 2030s. This projected talent gap will likely accelerate demand for intuitive, low-learning-curve Gantt chart software that can onboard new project managers quickly.
- 67% of organizations prioritize project management skills as a key leadership competency. With PM skills increasingly viewed as core leadership capability, proficiency with Gantt chart and scheduling tools is becoming a career differentiator.
- Organizations that invest in structured project management training see roughly 28 times less waste than those that don’t. This dramatic training ROI reinforces that tool adoption alone isn’t enough — pairing Gantt chart software with proper training multiplies its value.
- The proportion of organizations using no project management solution at all has remained flat at around 11% year-over-year, highlighting a persistent, static pocket of unaddressed market opportunity. This stubborn adoption gap suggests continued room for vendor-led education on the ROI of even basic Gantt chart software.
Conclusion
The top 105 Gantt chart software statistics, data, and trends in 2026 highlight an industry undergoing significant transformation as businesses increasingly prioritize project efficiency, automation, real-time collaboration, and data-driven decision-making. With market estimates projecting the global Gantt chart software market to grow from approximately $1.8 billion in 2025 to $4.3 billion by the mid-2030s, demand for advanced project scheduling and management solutions is expected to remain strong.
One of the most important trends shaping the Gantt chart software market is the rapid adoption of artificial intelligence and cloud-based project management platforms. Cloud solutions accounted for an estimated 67.4% of Gantt chart software revenue in 2025, while industry research indicates that more than 70% of project professionals work in organizations already using or exploring AI-powered project management capabilities. These developments are accelerating the adoption of intelligent scheduling, automated dependency tracking, predictive analytics, and resource optimization.
However, the statistics also reveal persistent challenges in project execution. According to PMI’s 2026 research, 97% of project professionals managed at least one complex project during the previous year, demonstrating the growing importance of effective planning and coordination. Additional industry findings suggest that many organizations continue to struggle with project delays, budget overruns, inadequate reporting, and limited visibility into project performance.
These challenges create substantial opportunities for Gantt chart software providers to deliver greater business value through automation, intuitive interfaces, integrated reporting, and improved collaboration. Organizations are increasingly looking beyond basic timeline visualization toward comprehensive project management solutions that connect scheduling with financial management, workforce planning, risk assessment, and operational performance.
The competitive landscape is also evolving. Established platforms such as Microsoft Project, Smartsheet, Asana, monday.com, ClickUp, Wrike, and GanttPRO continue to expand their capabilities, while specialized solutions address the unique requirements of construction, software development, manufacturing, professional services, and enterprise project management.
Looking ahead, several developments are expected to influence the future of Gantt chart software:
- AI-powered project scheduling: Greater use of predictive analytics, automated timeline adjustments, and intelligent risk identification.
- Cloud-first collaboration: Increasing demand for real-time project visibility across remote, hybrid, and geographically distributed teams.
- Integrated project management: Stronger connections between Gantt charts, resource allocation, financial tracking, and enterprise applications.
- Hybrid project methodologies: Growing support for organizations combining Agile, Waterfall, and other project management approaches.
- User-friendly automation: Continued emphasis on intuitive interfaces, customizable dashboards, and automated project reporting.
- Industry-specific solutions: More specialized scheduling capabilities for construction, engineering, IT, manufacturing, and other complex industries.
Ultimately, the Gantt chart software statistics for 2026 demonstrate that effective project scheduling is becoming increasingly important to organizational productivity, operational transparency, and successful project delivery.
For businesses evaluating the best Gantt chart software, the priority should be selecting solutions that align with their project complexity, team size, integration requirements, budget, and long-term growth objectives. Features such as dependency management, critical path analysis, resource planning, AI-powered automation, and real-time collaboration can provide meaningful operational benefits when supported by effective project management practices.
As artificial intelligence, cloud technology, and digital transformation continue to reshape project management, Gantt chart software will remain an important component of modern project planning and execution. Organizations that combine the right technology with standardized processes, skilled project managers, and data-driven decision-making will be better positioned to improve scheduling accuracy, reduce inefficiencies, and achieve more consistent project outcomes in 2026 and beyond.
If you find this article useful, why not share it with your hiring manager and C-level suite friends and also leave a nice comment below?
We, at the 9cv9 Research Team, strive to bring the latest and most meaningful data, guides, and statistics to your doorstep.
To get access to top-quality guides, click over to 9cv9 Blog.
To hire top talents using our modern AI-powered recruitment agency, find out more at 9cv9 Modern AI-Powered Recruitment Agency.
People Also Ask
What is Gantt chart software?
Gantt chart software is a project management tool that visually displays tasks, timelines, milestones, and dependencies. It helps teams plan projects, allocate resources, track progress, and manage deadlines efficiently.
What is the global Gantt chart software market size in 2026?
The global Gantt chart software market was estimated at approximately $1.8 billion in 2025. Industry forecasts suggest continued growth in 2026, driven by cloud adoption, AI-powered scheduling, and digital transformation.
How fast is the Gantt chart software market growing?
Industry forecasts estimate compound annual growth rates between 8.9% and 15.6% for Gantt chart and project scheduling software through 2030–2035, depending on market definitions and research methodologies.
What is the projected Gantt chart software market size by 2035?
Some industry forecasts project the global Gantt chart software market will reach approximately $4.3 billion by the mid-2030s, supported by growing demand for automated scheduling, resource management, and cloud collaboration.
Which region dominates the Gantt chart software market?
North America leads the global Gantt chart software market, accounting for approximately 38.2% of revenue in 2025. Europe follows with an estimated 27.5% market share.
What percentage of Gantt chart software is cloud-based?
Cloud-based Gantt chart software accounted for approximately 67.4% of global market revenue in 2025, reflecting increasing demand for accessible, scalable, and collaborative project management solutions.
What are the best Gantt chart software platforms in 2026?
Popular Gantt chart software platforms include Microsoft Project, Smartsheet, Asana, monday.com, ClickUp, Wrike, GanttPRO, and TeamGantt. The best choice depends on project complexity, budget, integrations, and team requirements.
How many Gantt chart software products are available in 2026?
Capterra’s Gantt chart software directory listed approximately 160 products in 2026, offering businesses numerous options for project scheduling, dependency tracking, resource allocation, and collaboration.
How much does Gantt chart software cost in 2026?
Gantt chart software typically costs between $4 and $31 per user monthly for many publicly priced subscription plans. Pricing varies by vendor, features, billing frequency, and enterprise requirements.
Is free Gantt chart software available in 2026?
Yes. Several project management platforms offer free plans with basic Gantt chart or timeline functionality. Advanced features such as resource management, automation, and detailed reporting may require paid subscriptions.
How is artificial intelligence transforming Gantt chart software?
AI-powered Gantt chart software helps automate project scheduling, identify potential delays, optimize resource allocation, predict risks, and generate project plans from natural-language instructions.
What percentage of project managers use AI in 2026?
Industry research suggests that more than 70% of project professionals work in organizations using or exploring AI in project management. Adoption includes automated scheduling, reporting, forecasting, and decision support.
What are the biggest Gantt chart software trends in 2026?
Major trends include AI-powered scheduling, cloud collaboration, predictive analytics, automated reporting, resource optimization, mobile accessibility, and integration with Agile and hybrid project management methodologies.
What are the most important Gantt chart software features?
Essential features include task scheduling, dependency tracking, drag-and-drop editing, milestone management, resource allocation, progress monitoring, automated notifications, and project reporting.
Why is dependency tracking important in Gantt chart software?
Dependency tracking identifies relationships between project tasks. It helps project managers understand how delays affect subsequent activities, adjust schedules, and coordinate teams more effectively.
What is the difference between Gantt charts and project management software?
Gantt charts visualize project schedules and task dependencies, while project management software provides broader capabilities such as budgeting, collaboration, reporting, resource management, and workflow automation.
How does Gantt chart software improve project management efficiency?
Gantt chart software improves efficiency by centralizing project schedules, automating updates, tracking dependencies, reducing manual reporting, and providing real-time visibility into deadlines and resource availability.
What percentage of projects are completed on time in 2026?
Wellingtone’s 2026 project management research indicates that only 36% of organizations mostly or always complete projects on time, highlighting persistent challenges in scheduling and project execution.
What percentage of projects stay within budget?
Industry research cited in the report indicates that approximately 43% of projects finish within their originally approved budgets, emphasizing the importance of financial monitoring and resource planning.
How common are complex projects in 2026?
PMI’s Pulse of the Profession 2026 reports that 97% of project professionals managed at least one complex project during the previous year, highlighting the growing need for structured planning and scheduling tools.
How does Gantt chart software help prevent project delays?
Gantt chart software helps teams identify critical tasks, monitor deadlines, visualize dependencies, detect scheduling conflicts, and adjust project timelines before delays affect overall delivery.
What industries use Gantt chart software the most?
Gantt chart software is widely used in construction, engineering, software development, manufacturing, IT, marketing, healthcare, and professional services for scheduling, resource planning, and project coordination.
How is Gantt chart software used in construction projects?
Construction teams use Gantt chart software to schedule activities, coordinate contractors, track milestones, manage task dependencies, allocate resources, and monitor project timelines.
What percentage of construction projects experience delays?
Industry research cited in the report suggests that up to 98% of construction projects experience scheduling delays, with average project durations extending approximately 37% beyond initial plans.
Is Gantt chart software suitable for Agile project management?
Yes. Modern Gantt chart platforms increasingly support Agile and hybrid methodologies by combining timeline visualization with Kanban boards, sprint planning, task dependencies, and flexible scheduling.
What percentage of organizations use hybrid project management?
Industry research referenced in the report indicates that approximately 31.5% of companies use hybrid project management methodologies combining predictive planning with Agile practices.
How does remote work affect Gantt chart software adoption?
Remote and hybrid work increases demand for cloud-based Gantt chart software that supports real-time collaboration, shared project timelines, centralized task tracking, and communication across distributed teams.
What is the difference between cloud-based and on-premise Gantt chart software?
Cloud-based Gantt chart software provides online access, automatic updates, and remote collaboration. On-premise solutions run on company-managed infrastructure and may offer greater control over deployment and data management.
What should businesses consider when choosing Gantt chart software?
Businesses should evaluate pricing, usability, task dependencies, resource management, automation, reporting, integrations, scalability, security, and support before selecting Gantt chart software.
What is the future of Gantt chart software beyond 2026?
The future of Gantt chart software will likely emphasize AI-driven scheduling, predictive project analytics, automated resource planning, cloud collaboration, and deeper integration with enterprise project management systems.
Sources
- Verified Market Research
- Verified Market Reports
- WiseGuyReports
- Dataintelo
- HTF Market Insights
- Market Intel Reports
- Capterra
- Project Management Institute
- pmwares
- Institute of Project Management
- Gitnux
- Apollo Technical
- Plaky
- ProProfs Project
- CollabCRM
- Rockstar Developer University
- SpeakWise
- Kissflow
- Wellingtone
- Fine Media
- The Business Dive
- PMWorld Library
- Xergy
- Proteus
- Breeze
- Coursera
- ProjectManager
- Buildern
- The Digital Project Manager
- TeamGantt
- Planera
- GanttPRO
- Celoxis
- Paymo
- SQ Magazine
- Thunderbit
- Neat
- Sci-Tech Today
- Archie
- Searchlab
- Pumble
- SearchEngineInsight