



























Key Takeaways
- Flowchart Software Market Growth: The global flowchart software market is projected to reach USD 3.2 billion by 2033, growing at a 9.8% CAGR, driven by digital transformation, workflow optimization, and enterprise automation.
- AI-Powered Flowchart Software Adoption: Artificial intelligence is transforming diagramming tools through automated flowchart generation, intelligent process mapping, and natural-language visualization, improving productivity and operational efficiency.
- Cloud-Based Diagramming and Collaboration Trends: Cloud-based solutions account for approximately 74.5% of the broader online diagram software market, reflecting growing demand for real-time collaboration, hybrid work support, and integrated business process management tools.
Flowchart software is transforming business process management in 2026 through AI-powered diagramming, workflow automation, and cloud collaboration. The global market is projected to reach USD 3.2 billion by 2033, growing at a 9.8% CAGR. Businesses increasingly adopt these tools to improve productivity, streamline operations, and support remote teams.
Flowchart software has become an essential tool for businesses, software developers, project managers, and organizations seeking to improve workflow efficiency, streamline business processes, and enhance team collaboration. As digital transformation accelerates and artificial intelligence (AI) reshapes workplace productivity, the demand for intuitive, cloud-based flowchart and diagramming software continues to grow across industries worldwide.
Also, read our article on the Top 10 Best Flowchart Software To Use.
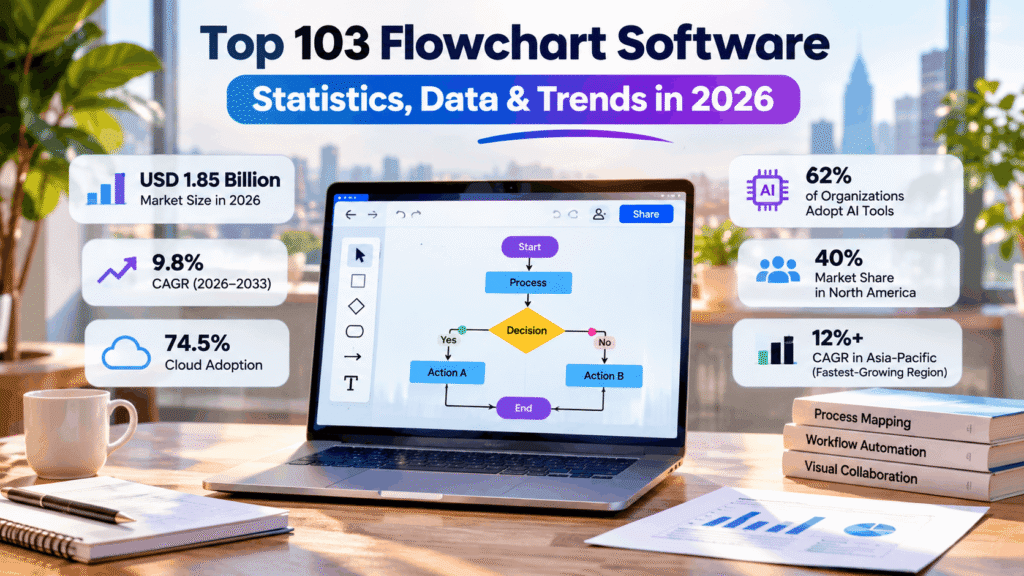
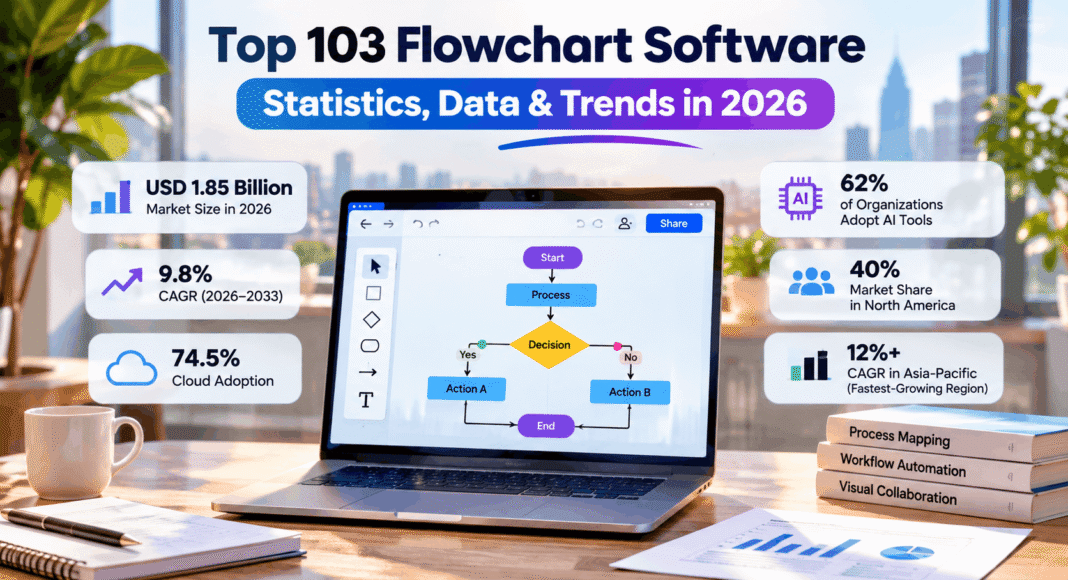
In 2026, the global flowchart software market is experiencing significant expansion, driven by increasing investments in business process automation, visual collaboration platforms, and AI-powered diagramming tools. Market estimates place the global flowchart software industry at approximately USD 1.5 billion in 2024, with projections suggesting it could reach USD 3.2 billion by 2033, representing a compound annual growth rate (CAGR) of 9.8%. Meanwhile, the broader flowchart and diagramming tools market is estimated at USD 1.85 billion in 2026, with forecasts indicating growth to USD 4.89 billion by 2035. These varying market estimates reflect differences in industry definitions and research methodologies but collectively highlight the growing importance of visual workflow management technologies.
One of the most influential flowchart software trends in 2026 is the integration of artificial intelligence and automation into diagram creation. AI-powered flowchart generators increasingly enable users to transform natural-language descriptions, documents, and complex workflows into structured visual diagrams. With 62% of organizations experimenting with or scaling AI agents, demand for intelligent diagramming solutions is expanding as businesses seek more efficient ways to document processes, visualize automation, and communicate technical information.
Cloud adoption and remote collaboration are also transforming the flowchart software landscape. Recent market assessments indicate that cloud-based solutions account for approximately 74.5% of the broader online diagram software market, reflecting growing preferences for accessibility, real-time collaboration, and integration with existing productivity platforms. At the same time, 52% of remote-capable U.S. employees work in hybrid arrangements, reinforcing the importance of shared visual documentation and collaborative workflow tools for geographically distributed teams.
Leading flowchart software platforms such as Microsoft Visio, Lucidchart, Miro, SmartDraw, Creately, Whimsical, and Diagrams.net continue to compete through advanced visualization capabilities, AI-assisted diagram generation, extensive template libraries, and integrations with enterprise applications. Microsoft Visio reportedly serves more than 12 million users globally, while Miro reports over 100 million users across 250,000 customers, demonstrating the substantial reach of visual collaboration and diagramming technologies.
Beyond traditional flowchart creation, organizations increasingly rely on diagramming software for business process mapping, workflow automation, software development, organizational planning, employee onboarding, compliance documentation, and enterprise architecture. These applications are particularly relevant as businesses seek to reduce operational inefficiencies, improve process transparency, and support data-driven decision-making. However, research indicating that only approximately 15% of organizations have achieved advanced business process management maturity suggests considerable opportunities remain for more effective adoption and utilization of these technologies.
Understanding the latest flowchart software statistics is therefore increasingly important for business leaders, IT professionals, software developers, educators, and technology buyers evaluating digital productivity investments. From market growth and regional adoption to AI integration, software pricing, vendor performance, and enterprise productivity, industry data provides valuable insights into how flowchart solutions are evolving and where future opportunities may emerge.
This article explores the top 103 flowchart software statistics, data, and trends in 2026, covering global market size, growth forecasts, cloud deployment, artificial intelligence, business process management, remote collaboration, software development, education, and competitive market dynamics. These insights offer a comprehensive overview of the flowchart software industry, helping organizations understand emerging technologies, evaluate software solutions, and make informed decisions about their workflow visualization and process optimization strategies.
Before we venture further into this article, we would like to share who we are and what we do.
About 9cv9
9cv9 is a business tech startup based in Singapore and Asia, with a strong presence all over the world.
With over ten years of startup and business experience, and being highly involved in connecting with thousands of companies and startups, the 9cv9 team has listed some of the top and best companies/tools in this review.
If you like to get your company listed in our top B2B software reviews, check out our world-class 9cv9 Media and PR service and pricing plans here.
Top 103 Flowchart Software Statistics, Data & Trends in 2026
1. Market Size & Growth
- The global flowchart software market was valued at approximately USD 1.5 billion in 2024 and is projected to reach USD 3.2 billion by 2033, growing at a CAGR of 9.8% from 2026 to 2033 — a clear signal that demand for visual process documentation continues to accelerate well into the next decade.
- The online (cloud-based) flowchart software segment specifically was valued at USD 1.5 billion in 2025 and is estimated to reach USD 3.2 billion by 2034, expanding at an 8.8% CAGR, underscoring how cloud delivery has become the default consumption model for diagramming tools.
- The broader flowchart and diagramming tools market was valued at USD 1.85 billion in 2026 and is forecast to reach USD 4.89 billion by 2035 at an 11.40% CAGR, reflecting sustained enterprise IT budget allocation toward visual workflow tools.
- Another market assessment pegs the flowchart and diagramming tools category at USD 2.17 billion in 2024, growing to USD 12.07 billion by 2035 at a striking 16.88% CAGR, driven largely by AI-powered automation and cloud suite adoption in corporate and academic sectors.
- The flowchart and diagramming tool market was valued at USD 3.73 billion in 2025 and is projected to reach USD 6.0 billion by 2035 at a 4.9% CAGR, illustrating how methodology differences across analyst firms produce a wide but consistently upward-trending valuation range.
- The dedicated diagramming software market (a closely related category) was valued at USD 2.17 billion in 2025 and is projected to hit USD 4.79 billion by 2034 at a 9.2% CAGR, with analysis based on primary and secondary research verified through May 2026.
- The Business Process Mapping application segment alone was valued at USD 1.05 billion in 2024, highlighting how process-mapping use cases represent a substantial and independently trackable slice of the wider flowchart software economy.
- The general diagramming software market was valued at USD 700 million in 2021 and was projected to reach USD 1.31 billion by 2028 at a 9.4% CAGR, showing that even conservative pre-pandemic-recovery estimates pointed to durable, long-term category growth.
- The visual collaboration platform market — which overlaps significantly with flowchart and diagramming tools — is forecast to grow from USD 9.8 billion in 2025 to USD 28.6 billion by 2034 at a 12.6% CAGR, fueled by the institutionalization of hybrid work models.
- The visual collaboration platforms software market was valued at USD 12.7 billion in 2026 and is projected to expand to USD 41.96 billion by 2035 at a 14.20% CAGR, with growth concentrated among enterprise procurement teams in financial services and industrial engineering sectors.
- The design collaboration software market’s visualization and simulation functionality specifically is expected to grow from USD 3.7 billion in 2024 to USD 14.7 billion by 2035, showing outsized demand for visual, diagram-driven collaboration features within the broader design tooling space.
2. Regional & Deployment Trends
- North America currently commands roughly 40% of the global flowchart software market share, making it the single largest regional market due to mature SaaS infrastructure and high enterprise IT spend.
- A separate regional breakdown of the flowchart and diagramming tools market attributes approximately 35% of 2023 revenue to North America, followed by Asia Pacific at 30%, Europe at 20%, Latin America at 8%, and the Middle East & Africa at 7%.
- North America is estimated to hold 40% of flowchart and diagramming tools revenue in 2024, driven by rapid integration of AI-powered productivity suites and a dense concentration of technology-driven enterprises.
- Europe is expected to command a projected valuation of USD 1.667 billion by 2035 in flowchart software revenue for North America alone, while Europe follows closely behind, aided by strong enterprise process-optimization initiatives.
- Asia-Pacific is consistently flagged as the fastest-growing regional market for flowchart and diagramming tools, with a projected CAGR exceeding 12%, supported by digital transformation programs such as India’s Business Reforms Action Plan.
- Commercial (business) users account for approximately 60% of total flowchart and diagramming tools revenue, while private/individual users represent the remaining 40%, reflecting the category’s dual appeal to enterprises and solo professionals alike.
- Cloud-based deployment continues to expand its lead in the broader online diagram software space, holding roughly 74.5% share as of the most recent assessment, with on-premises solutions steadily declining as legacy customers migrate.
- In the wider BPM software category, cloud deployment reached 63.8% adoption, indicating that flowchart and process-mapping tools are following the same enterprise-wide cloud migration trajectory as adjacent business software.
- On-premises deployment still held the largest overall diagramming software market share as of 2023 in at least one major analysis, showing that data-security-sensitive enterprises — particularly in regulated sectors — have not fully abandoned self-hosted diagram tooling.
- Type 3 (cloud-based) diagramming tools represent the fastest-growing deployment segment overall, propelled directly by increasing remote collaboration needs and distributed team structures.
- Educational institutions represent a “significant share” of the diagramming software market by end-user segment, confirming that flowchart tools are as embedded in classrooms and curricula as they are in corporate workflows.
3. Competitive Landscape & Vendor Ratings
- Lucidchart earned an average user rating of 4.8 out of 5 across major review platforms including G2 and Capterra, positioning it among the highest-rated tools in the entire flowchart software category.
- On Capterra specifically, Lucidchart carries a 4.5-star aggregate rating drawn from 2,246 verified user reviews as of March 2026, making it one of the most extensively reviewed diagramming products on the platform.
- Creately holds a 4.6 out of 5 rating on Capterra according to comparative vendor analysis, with users specifically praising its modern interface and collaborative capabilities.
- A separate Capterra listing places Creately’s rating at 4.4 out of 5 based on 216 verified reviews, illustrating that exact scores can vary slightly depending on the review sample and update cycle.
- Draw.io (now Diagrams.net) holds a 4.6 out of 5 rating on Capterra based on 756 reviews, reinforcing its reputation as a strong free, cost-effective alternative to subscription-based diagramming tools.
- Whimsical carries a notably high 4.8 out of 5 Capterra rating based on 56 reviews, reflecting strong satisfaction among teams that prioritize speed and simplicity in visual planning.
- Microsoft reports that more than 12 million users rely on Visio globally for process documentation needs, cementing its position as the dominant enterprise standard, particularly within Microsoft 365-centric organizations.
- SmartDraw’s template library spans more than 4,500 templates covering business process, engineering, and architectural diagram types, giving it one of the broadest out-of-the-box content libraries in the category.
- On Gartner Peer Insights’ Visual Collaboration Applications market, Lucid Software holds a 4.5-star rating from 1,046 verified reviews, while Miro holds an equal 4.5-star rating from 1,679 verified reviews.
- Miro reports serving more than 100 million users across 250,000 customers on its AI-first collaborative canvas, making it one of the largest visual collaboration user bases in the industry.
- Independent technology-detection data shows Miro deployed across 6,477 active company domains as of a March 2026 crawl, with verified adoption at Fortune 500 organizations including Deloitte, Samsung, Ford, and PepsiCo.
- Lucidchart users report an average 25% increase in project delivery speed, according to vendor-reported enterprise deployment data, suggesting measurable productivity gains tied to structured diagramming adoption.
- Businesses using Lucidchart specifically cite superior collaboration, template variety, and integration depth with Google Workspace, Confluence, and Jira as primary reasons for continued platform loyalty.
- Reviewers consistently flag Lucidchart’s free-tier limitation of just three documents as a notable adoption barrier, showing how freemium constraints continue to shape purchasing decisions in the category.
4. AI & Automation in Diagramming
- AI-powered flowchart generation tools can now transform unstructured documents into presentation-ready visual diagrams with reported accuracy rates as high as 94.4% on independent benchmarks, dramatically reducing manual diagram creation time.
- McKinsey’s 2026 State of AI report found that 62% of organizations are experimenting with or scaling AI agents, a trend directly feeding into demand for AI-assisted, prompt-to-diagram generation tools.
- Roughly 23% of organizations report they are already scaling agentic AI within at least one business function, a cohort increasingly turning to AI flowchart generators to visualize and operationalize those agent workflows.
- Independent 2026 testing identified at least 13 distinct AI flowchart generator tools now competing in the market, spanning text-to-diagram, whiteboard-integrated, and diagram-as-code approaches.
- Diagrams.net (formerly Draw.io) added native AI diagram generation in 2025 and refined the capability through 2026, making free, browser-based AI-assisted flowcharting broadly accessible without a paid plan.
- Mermaid’s diagram-as-code approach has become a de facto standard for engineering documentation in 2026, allowing developers to pair any AI assistant with a text prompt to generate version-controllable flowcharts alongside source code.
- FigJam’s AI-powered flowchart generator allows users to type a plain-language process description and receive an auto-generated starting diagram, reflecting the broader industry shift toward natural-language diagram creation.
- A 2017 survey found that 54.5% of professionals cited “time-consuming” manual diagramming as their primary pain point when creating use case diagrams — a friction point that current AI generation tools are directly designed to eliminate.
- The same research found only 13% of system engineers generated UML diagrams using fully automatic methods, while 40.2% still created diagrams entirely manually, indicating substantial remaining headroom for AI-assisted diagramming adoption.
- AI-powered BPM tools have been shown to improve process accuracy to as high as 93% and reduce manual operational effort by 73.3% across banking and healthcare institutions specifically adopting automated workflow visualization.
- AI-enabled workflow automation adoption has exceeded 64% among surveyed enterprises, with a parallel rise in demand for diagram tools capable of visualizing increasingly automated, AI-driven business processes.
5. Business Process Mapping & BPM Adoption
- Low-code BPM suites achieved 86% enterprise adoption in 2025, as drag-and-drop process modelers shortened build cycles from months to weeks for business teams automating approvals and document routing.
- Cloud-native BPM systems now support more than 50 connected workflow endpoints within typical enterprise environments, reflecting the growing complexity that visual process maps must accommodate.
- Low-code workflow adoption within BPM platforms has crossed 58% globally, while AI-assisted operational orchestration has expanded to 71% of surveyed enterprises.
- Automation-focused BPM implementations represented 21.6% of total BPM deployment activity in 2025, driven by rising use of robotic process automation and intelligent document processing.
- More than 60% of enterprise workflow modernization projects in 2025 focused specifically on document-centric automation involving invoices, contracts, and compliance reporting — all use cases reliant on clear process flowcharts.
- In the United States specifically, 66% of enterprises identified productivity optimization as their leading reason for BPM integration, while 57% adopted automated documentation and compliance management platforms.
- Hybrid operational infrastructure has expanded across 77% of U.S. enterprises, a shift that is directly increasing demand for centralized, visually accessible workflow documentation.
- On-premise BPM deployment is projected to hold 52.16% market share in 2026, even as cloud deployment grows at a faster 20.8% CAGR, showing a gradual but not yet complete shift toward cloud-hosted process mapping.
- Large enterprises are expected to account for 52.28% of BPM platform market share in 2026, while small and medium enterprises are projected to grow fastest at a 20.9% CAGR as low-code tools lower the adoption barrier.
- Process documentation delivers its strongest measurable business impact in onboarding and training (74% of organizations), followed by process optimization (70%), digitalization (63%), compliance (57%), and cross-department collaboration (53%).
- Only around 15% of organizations have reached an advanced level of BPM maturity as of the most recent industry study, despite widespread adoption, revealing a persistent gap between BPM tool ownership and effective utilization.
- The BPM market overall is projected to expand at a CAGR of 19.9% from 2023 to 2030, according to industry statistics compilations, reinforcing flowchart software’s role as core infrastructure within the broader BPM ecosystem.
6. Remote & Hybrid Work Driving Diagramming Demand
- 52% of remote-capable U.S. employees now work in a hybrid arrangement, while 27% work fully remotely and only 21% remain fully on-site, according to Gallup’s most recent workplace data.
- 88% of employers now offer some form of hybrid work arrangement, with just 27% having returned to fully in-person requirements and 6% operating fully remote — a workforce structure that inherently depends on shared visual documentation tools.
- Virtual whiteboards such as Miro and FigJam have seen 156% growth since 2023, becoming essential infrastructure for hybrid brainstorming, process design, and flowchart collaboration sessions.
- 80% of employees report using AI in the workplace, up from 72% in 2024, with 27% reporting daily use — a trend directly increasing demand for AI-assisted diagram and flowchart generation features.
- AI copilots embedded within productivity and diagramming tools are now used by 43% of knowledge workers, a sharp increase from just 11% two years earlier.
- Roughly 50–55% of knowledge workers globally now operate in hybrid roles, making hybrid work the dominant employment model for the exact knowledge-based industries that rely most heavily on flowchart software.
- Employers cite collaboration (68%), productivity (64%), and communication (61%) as their top three reasons for supporting flexible work arrangements — the same three benefits most commonly attributed to visual process mapping tools.
- “Tool fatigue” is cited by 49% of employees as a top-three frustration with hybrid work, a finding that underscores why consolidated, all-in-one diagramming and collaboration platforms are gaining preference over fragmented point solutions.
- Asynchronous communication practices — closely tied to shared visual documentation like flowcharts — have been shown to reduce meeting time by 29% and increase deep work time by 18%.
- Microsoft Teams holds approximately 44% of the team collaboration software market, with Slack at roughly 18.6% and Zoom at about 10%, forming the communication backbone into which flowchart tools are increasingly integrated.
- 76% of companies report improved employee retention specifically attributable to offering remote or hybrid work, a benefit closely linked to organizations that invest in clear, accessible process documentation to support distributed teams.
- Nearly 75% of companies with fewer than 500 employees offer remote or flexible work options, compared to just 17% of large enterprises with more than 5,000 employees, revealing meaningfully different diagramming-tool procurement dynamics by company size.
7. Enterprise Use Cases & Productivity Impact
- Process inefficiency is estimated to cost the average employee 240 work hours per year, a figure that directly underpins the business case for investing in clear, visual process-mapping software.
- According to a 2024 digital transformation study, 70% of digital transformation initiatives fail not because of technology limitations but due to a lack of clear process documentation — precisely the gap flowchart software is designed to close.
- Organizations without proper process maps are estimated to lose approximately USD 2,000 per employee per day in productivity and rework costs, underscoring the tangible financial upside of investing in diagramming tools.
- Financial institutions using swimlane process mapping have discovered previously invisible complexity, such as customer onboarding processes requiring approvals from seven different departments.
- Process maps are widely cited as one of the fastest ways to identify bottlenecks, redundancies, and handoff failures that would otherwise remain hidden in day-to-day departmental silos.
- HR and training teams are among the heaviest users of process mapping software, relying on visual workflow diagrams to document onboarding steps, explain policy compliance, and accelerate new-hire time-to-productivity.
- IT and enterprise architecture teams use flowchart and diagramming software to map system integrations and data flows, directly supporting software development planning and automation initiatives.
- Management consultants rely on process mapping tools to help client organizations visualize current-state operations and design future-state, more efficient workflows — a use case central to 9CV9’s own market-intelligence content practice.
- Well-documented workflow maps are frequently repurposed as compliance documentation, simplifying audit preparation and regulatory reporting across finance, healthcare, and manufacturing sectors.
- Organizations using structured business process maps report improved employee job satisfaction, attributed to greater clarity around individual roles, responsibilities, and decision points.
8. Software Development & Technical Diagramming (UML/ERD)
- UML remains recognized as the most widely used modeling language in software development, according to systematic literature reviews of model-based software development practices.
- Class diagrams are the most commonly used UML diagram type, used by 88% of surveyed practitioners, followed by use case diagrams (54%) and sequence diagrams (53%).
- A separate practitioner survey found 96% of software architects rely on functional viewpoint modeling and 99% rely on information viewpoint modeling when constructing UML-based system diagrams.
- 88% of surveyed practitioners confirmed they actively use UML in modeling their software systems across multiple architectural viewpoints, though usage depth and consistency vary considerably by team maturity.
- Enterprise Architect was identified as the top UML modeling tool across all measured architectural viewpoints in a multi-country practitioner survey spanning 34 countries.
- Agile development teams frequently either avoid UML entirely or apply it in a compressed, lightweight form, reflecting an industry-wide shift toward more flexible, less formal diagramming approaches.
- One of the most persistent challenges identified in UML research is that diagrams are often created early in a project and never updated, creating a documented disconnect between design intent and final implementation.
- Keeping diagrams synchronized with evolving codebases remains one of the top cited difficulties among practitioners, a gap that modern diagram-as-code tools like Mermaid are specifically designed to solve.
9. Education & Training Applications
- Educational institutions represent a significant and growing end-user segment within the diagramming software market, with demand accelerating as digital learning normalization expands integration with learning management systems.
- K-12 and higher education adoption of cloud-based diagramming tools is expected to accelerate meaningfully as educational institutions increasingly standardize on digital-first curricula.
- Process maps and flowcharts are widely used in corporate training environments specifically because recognizable colors, shapes, and symbols make complex procedures easy to understand at a glance for new learners.
- Simplified visual training materials created with flowchart software are consistently cited as one of the fastest ways to reduce new-employee ramp-up time across HR and learning & development functions.
- Educational institutions held a significant market share of the diagramming software category as of 2023, per enterprise-size segmentation data, alongside corporate and personal-use segments.
10. Pricing, Templates & Feature Trends
- SmartDraw’s entry-level pricing starts at USD 5 per user per month for its Site plan, with Team pricing at USD 6.95 per user per month (minimum three users) and an Individual plan at USD 7.95 per month.
- SmartDraw integrates with more than 20 third-party platforms spanning Microsoft, Google Workspace, and major cloud storage and development tools.
- Enterprise-tier visual collaboration software licensing has historically ranged from roughly USD 4,350 for single-user licenses up to USD 8,700 for enterprise-wide licenses, illustrating the wide pricing spread across the category.
- Lucidchart supports direct data import from Excel, Google Sheets, and CSV files, alongside export to PDF, PNG, and native Visio formats — a flexibility increasingly considered table stakes in 2026 buying decisions.
- SmartDraw’s template library spans more than 4,500 pre-built diagram templates, one of the largest ready-made content libraries among mainstream flowchart tools.
- Creately’s “Smart Shapes” and automated connector features are specifically highlighted by users for dramatically accelerating the construction of complex, multi-branch flowcharts compared to manual drawing tools.
- Real-time, multiplayer collaborative editing — once a differentiator — is now considered a standard baseline feature across nearly all major flowchart and diagramming platforms evaluated in 2026 comparative reviews.
- Cross-platform export compatibility, particularly bidirectional Visio file support, remains one of the most frequently requested features among enterprise buyers evaluating a switch away from legacy desktop diagramming software.
- Integration depth with productivity suites (Microsoft 365, Google Workspace) and developer tools (Jira, Confluence, GitHub) is now one of the top three purchase-decision criteria cited across flowchart software buyer reviews.
Conclusion
The top 103 flowchart software statistics, data, and trends in 2026 highlight the growing importance of visual process management, workflow automation, and digital collaboration in modern business environments. As organizations increasingly prioritize operational efficiency, process transparency, and technology-driven productivity, flowchart software has evolved from a basic diagramming tool into an essential component of enterprise digital transformation strategies.
The global flowchart software market continues to demonstrate strong growth potential, with industry estimates projecting expansion from approximately USD 1.5 billion in 2024 to USD 3.2 billion by 2033, representing a compound annual growth rate (CAGR) of 9.8%. Broader market forecasts also indicate substantial opportunities for diagramming and visual collaboration platforms, particularly as businesses invest in cloud-based solutions, artificial intelligence, and integrated workflow management systems. Although market valuations vary depending on research methodologies and software classifications, the overall trajectory points toward sustained demand for advanced flowchart and diagramming technologies.
One of the most significant flowchart software trends in 2026 is the rapid integration of artificial intelligence into visual workflow creation. AI-powered flowchart generators, automated process mapping, and natural-language diagramming capabilities are transforming how businesses document, analyze, and optimize their operations. With 62% of organizations experimenting with or scaling AI agents, intelligent diagramming solutions are becoming increasingly relevant for visualizing complex workflows, supporting automation initiatives, and improving cross-functional communication.
Cloud-based deployment and collaborative functionality are also reshaping the competitive landscape. With cloud solutions accounting for approximately 74.5% of the broader online diagram software market, organizations are increasingly prioritizing accessibility, real-time collaboration, and seamless integration with existing enterprise applications. The continued prevalence of remote and hybrid work arrangements further reinforces the value of centralized visual documentation, particularly for geographically distributed teams managing complex projects and business processes.
The competitive landscape remains dynamic, with established platforms such as Microsoft Visio, Lucidchart, Miro, SmartDraw, Creately, and Diagrams.net expanding their capabilities to address changing customer expectations. From AI-assisted diagram generation and extensive template libraries to collaborative editing and integrations with productivity suites, software providers are increasingly competing on usability, automation, flexibility, and enterprise compatibility.
Beyond market growth, the statistics reveal substantial opportunities for organizations to improve business process management, workflow efficiency, employee onboarding, software development, and regulatory compliance. Research suggesting that only approximately 15% of organizations have achieved advanced business process management maturity highlights a significant gap between software adoption and effective implementation. Businesses that combine appropriate diagramming technologies with standardized processes, employee training, and continuous workflow optimization may be better positioned to achieve measurable operational improvements.
Looking ahead, the future of flowchart software will likely be shaped by several interconnected developments, including AI-driven process visualization, cloud-native collaboration, diagram-as-code technologies, low-code automation, and deeper integration with enterprise software ecosystems. As these capabilities mature, flowchart platforms are expected to play an increasingly important role in helping organizations manage operational complexity, communicate information clearly, and support more efficient decision-making.
Ultimately, the flowchart software statistics for 2026 demonstrate that visual workflow management is becoming an increasingly valuable business capability rather than simply a documentation function. Organizations that strategically adopt modern flowchart software, embrace intelligent automation, and establish effective process management practices can strengthen collaboration, reduce operational friction, and improve their ability to respond to changing business requirements.
For business leaders, IT decision-makers, software developers, and project managers, understanding these 103 flowchart software statistics and trends provides a valuable foundation for evaluating technology investments, identifying emerging opportunities, and developing more effective workflow optimization strategies. As digital transformation continues across industries, businesses that leverage the right combination of visual collaboration, process automation, and AI-powered diagramming tools will be better equipped to build efficient, scalable, and adaptable operations in 2026 and beyond.
If you find this article useful, why not share it with your hiring manager and C-level suite friends and also leave a nice comment below?
We, at the 9cv9 Research Team, strive to bring the latest and most meaningful data, guides, and statistics to your doorstep.
To get access to top-quality guides, click over to 9cv9 Blog.
To hire top talents using our modern AI-powered recruitment agency, find out more at 9cv9 Modern AI-Powered Recruitment Agency.
People Also Ask
What is flowchart software?
Flowchart software is a digital tool that helps users create visual diagrams of processes, workflows, decisions, and systems. Businesses use it to improve communication, document procedures, identify inefficiencies, and streamline operations.
How big is the global flowchart software market in 2026?
The global flowchart and diagramming tools market is estimated at USD 1.85 billion in 2026, with projections reaching USD 4.89 billion by 2035. Market estimates vary depending on software categories and research methodologies.
What is the projected growth rate of the flowchart software market?
The global flowchart software market is projected to grow at a compound annual growth rate (CAGR) of 9.8% from 2026 to 2033, driven by digital transformation, workflow automation, and increasing demand for visual collaboration tools.
What are the biggest flowchart software trends in 2026?
Major trends include AI-powered flowchart generation, cloud-based diagramming, real-time collaboration, workflow automation, natural-language diagram creation, and integration with enterprise productivity platforms.
How is artificial intelligence transforming flowchart software?
Artificial intelligence enables automatic diagram generation, intelligent process mapping, and natural-language workflow visualization. AI-powered tools help businesses reduce manual diagramming work and simplify complex process documentation.
What is the best flowchart software in 2026?
Popular flowchart software options include Lucidchart, Microsoft Visio, Miro, SmartDraw, Creately, Whimsical, and Diagrams.net. The best choice depends on collaboration requirements, pricing, integrations, diagram complexity, and business needs.
What percentage of diagramming software is cloud-based?
Cloud-based solutions account for approximately 74.5% of the broader online diagram software market, reflecting growing demand for accessible, collaborative platforms that support distributed teams and digital workflows.
Which region has the largest flowchart software market share?
North America leads the global flowchart software market, accounting for approximately 40% of market revenue. Strong enterprise technology investments, mature SaaS infrastructure, and digital transformation initiatives support its position.
Which region is experiencing the fastest flowchart software market growth?
Asia-Pacific is identified as the fastest-growing regional market for flowchart and diagramming tools, with projected annual growth exceeding 12%, supported by expanding digital infrastructure and enterprise automation investments.
How many people use Microsoft Visio worldwide?
Microsoft Visio reportedly serves more than 12 million users globally. Its integration with Microsoft productivity applications makes it a widely adopted solution for enterprise process mapping, organizational diagrams, and technical documentation.
How many users does Miro have in 2026?
Miro reports serving more than 100 million users across approximately 250,000 customers. Its collaborative visual workspace supports brainstorming, workflow planning, diagramming, and distributed team collaboration.
What are the benefits of using flowchart software for businesses?
Flowchart software improves process visibility, communication, workflow documentation, and collaboration. It helps organizations identify bottlenecks, clarify responsibilities, standardize procedures, and support operational efficiency.
How does flowchart software improve business productivity?
Flowchart software visualizes workflows, helping employees identify unnecessary steps, reduce communication gaps, and understand responsibilities. Structured process documentation can also improve onboarding, training, and project coordination.
What is AI-powered flowchart generation?
AI-powered flowchart generation uses artificial intelligence to convert written instructions, documents, or process descriptions into visual diagrams. It reduces manual drawing requirements and helps users create structured workflows more efficiently.
Can AI automatically create flowcharts from text?
Yes. AI-powered diagramming tools can transform plain-language descriptions into flowcharts. Platforms such as FigJam and AI-enabled diagram generators provide automated starting diagrams that users can review, customize, and refine.
What is the difference between flowchart software and diagramming software?
Flowchart software primarily visualizes processes, decisions, and workflows. Diagramming software covers a broader range of visualizations, including organizational charts, UML diagrams, network architectures, database models, and technical systems.
How does flowchart software support business process management?
Flowchart software supports business process management by documenting workflows, identifying inefficiencies, visualizing decision points, and standardizing procedures. It helps organizations analyze existing processes and design improvements.
What percentage of organizations have advanced business process management maturity?
Approximately 15% of organizations have achieved advanced business process management maturity, according to industry research. This highlights opportunities to improve process standardization, documentation, and workflow optimization.
Why is cloud-based flowchart software becoming more popular?
Cloud-based flowchart software provides accessibility, real-time collaboration, centralized storage, and integration with productivity applications. These capabilities support remote teams and reduce dependence on locally installed software.
How does flowchart software support remote and hybrid teams?
Flowchart software enables distributed employees to collaborate on diagrams, document processes, and communicate complex information visually. Shared workflows improve coordination and support asynchronous communication across locations.
What industries use flowchart software the most?
Flowchart software is widely used in information technology, financial services, healthcare, manufacturing, education, consulting, and human resources. Common applications include process mapping, compliance documentation, training, and system design.
How is flowchart software used in software development?
Developers use flowchart software to visualize algorithms, system architecture, application workflows, and decision logic. UML diagrams, sequence diagrams, and process maps help teams plan systems and communicate technical requirements.
What is UML diagramming software?
UML diagramming software helps developers create Unified Modeling Language diagrams to represent software structures and behaviors. Common diagram types include class diagrams, use case diagrams, sequence diagrams, and activity diagrams.
What percentage of software developers use UML class diagrams?
Research cited in the industry data indicates that 88% of surveyed UML practitioners use class diagrams, compared with 54% using use case diagrams and 53% using sequence diagrams. These figures reflect the surveyed sample.
What is diagram-as-code software?
Diagram-as-code software generates visual diagrams from text-based definitions. Tools such as Mermaid allow developers to maintain flowcharts alongside source code, supporting version control, collaboration, and easier documentation updates.
How much does flowchart software cost in 2026?
Flowchart software pricing varies by platform, features, and subscription type. Free options are available, while paid plans may charge monthly per-user fees. SmartDraw’s cited individual pricing starts at USD 7.95 per month.
Are there free flowchart software tools available?
Yes. Diagrams.net offers free diagramming capabilities, while several commercial platforms provide limited free plans. Free tools are suitable for basic process mapping, workflow visualization, and individual diagramming projects.
How does flowchart software help with employee onboarding?
Flowchart software helps HR teams visualize onboarding procedures, training requirements, approval processes, and employee responsibilities. Clear workflow diagrams reduce confusion and support consistent onboarding experiences.
What features should businesses look for in flowchart software?
Important features include intuitive diagram editors, customizable templates, real-time collaboration, AI-assisted generation, cloud storage, export compatibility, access controls, and integrations with existing business applications.
What is the future of flowchart software beyond 2026?
The future of flowchart software will likely involve more advanced AI-generated diagrams, automated process mapping, cloud collaboration, low-code workflow integration, and diagram-as-code capabilities that support increasingly complex business operations.
Sources
- Verified Market Reports
- MarkWide Research
- WiseGuy Reports
- DataIntelo
- Grand View Research
- Fortune Business Insights
- Mordor Intelligence
- Capterra
- Gartner Peer Insights
- Microsoft
- SmartDraw
- McKinsey
- Gallup
- Independent AI Flowchart Generator Benchmark Testing
- UML/BPMN Adoption Practitioner Surveys
- Industry BPM Adoption and Process-Mapping ROI Studies