




























Key Takeaways
- The global data visualization software market is projected to reach approximately $13.71 billion in 2026, driven by rapid adoption of AI-powered analytics, cloud-based business intelligence, and embedded analytics across enterprises worldwide.
- Artificial intelligence is transforming data visualization, with organizations reporting faster insights, higher productivity, automated reporting, and growing adoption of natural language analytics and machine learning-powered dashboards.
- Modern data visualization platforms deliver measurable business value through improved decision-making, higher ROI, cloud scalability, self-service analytics, and growing enterprise adoption across industries including finance, healthcare, retail, manufacturing, and technology.
Data visualization software is transforming how organizations turn complex information into actionable insights. This collection of 110 statistics highlights market growth, AI adoption, cloud analytics, business intelligence trends, and enterprise usage in 2026, helping business leaders understand the technologies, investments, and strategies shaping the future of data-driven decision-making.
Data visualization software has become one of the most critical pillars of the modern digital economy, transforming the way organizations analyze, interpret, and communicate increasingly complex datasets. As businesses continue to generate unprecedented volumes of structured and unstructured information, the ability to convert raw data into meaningful visual insights has shifted from being a competitive advantage to an operational necessity. In 2026, organizations across industries are investing heavily in advanced data visualization platforms to accelerate decision-making, improve collaboration, democratize analytics, and unlock measurable business value. From executive dashboards and interactive business intelligence reports to AI-powered analytics and embedded visualization capabilities, the market is experiencing one of the fastest growth trajectories in enterprise software.
Also, read our top guide on the Top 10 Best Data Visualization Software.

The rapid expansion of artificial intelligence, cloud computing, self-service business intelligence, and embedded analytics has fundamentally redefined the expectations placed on modern visualization tools. Today’s platforms no longer focus solely on creating charts and dashboards; they increasingly incorporate predictive analytics, natural language querying, machine learning algorithms, automated insight generation, and generative AI capabilities that empower users of all technical skill levels to explore data more efficiently than ever before. As organizations seek faster and smarter ways to derive insights from massive datasets, visualization software has evolved into a central component of enterprise digital transformation strategies.
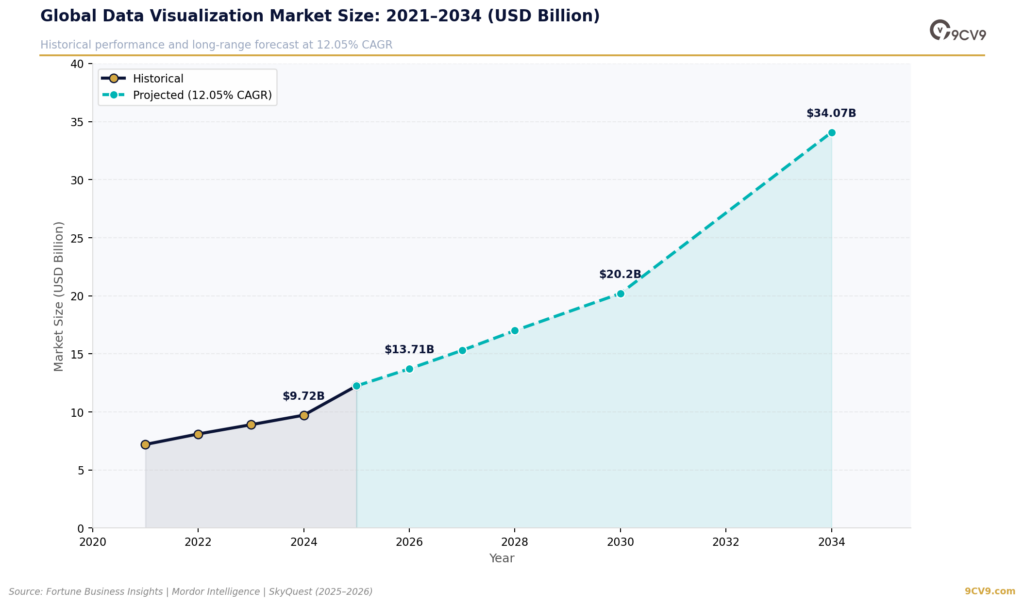
The numbers clearly illustrate this remarkable momentum. The global data visualization software market is projected to reach approximately $13.71 billion in 2026 after growing steadily from around $9.72 billion in 2024 and more than $12 billion in 2025. Looking even further ahead, multiple industry forecasts anticipate the market exceeding $34 billion by 2034 while maintaining double-digit annual growth rates. Such sustained expansion demonstrates that organizations are moving well beyond experimental analytics initiatives and are instead institutionalizing data-driven decision-making throughout every level of their operations.

One of the primary catalysts behind this explosive growth is the increasing volume of enterprise data. Global digital information is expected to reach approximately 181 zettabytes by the end of 2026, creating unprecedented challenges for organizations attempting to extract actionable insights from vast collections of transactional, operational, financial, customer, and machine-generated data. Without effective visualization software, much of this information would remain inaccessible, overwhelming decision-makers with spreadsheets, reports, and disconnected databases. Modern visualization platforms simplify this complexity by presenting data through intuitive charts, heat maps, geographical visualizations, interactive dashboards, and AI-generated summaries that significantly improve comprehension and decision speed.
The shift toward cloud-native analytics platforms has further accelerated enterprise adoption worldwide. Cloud deployments now represent the dominant deployment model for data visualization software, enabling organizations to scale analytics infrastructure quickly while reducing maintenance costs and improving accessibility across distributed workforces. Businesses increasingly favor cloud-based visualization platforms because they support real-time collaboration, automatic software updates, AI integration, and seamless connectivity with modern data warehouses and SaaS applications. At the same time, regulated industries continue to maintain hybrid and on-premises deployments where data sovereignty and compliance requirements remain critical considerations.
Artificial intelligence has emerged as perhaps the most transformative force shaping the future of data visualization in 2026. AI-powered dashboards can automatically detect anomalies, generate predictive forecasts, recommend key performance indicators, summarize trends using natural language, and answer business questions conversationally without requiring SQL expertise. Organizations increasingly report faster insight generation, improved analyst productivity, and stronger return on investment after integrating AI capabilities into their visualization workflows. Industry projections also indicate that AI will soon become a standard feature across nearly all enterprise analytics platforms, fundamentally changing how businesses interact with their data.
The competitive landscape continues to evolve rapidly as established business intelligence leaders compete alongside open-source technologies and specialized analytics vendors. Microsoft Power BI, Tableau, D3.js, Grafana, SAP BusinessObjects, and Qlik remain among the most influential platforms serving millions of users worldwide. Meanwhile, hundreds of additional vendors continue introducing innovations focused on embedded analytics, operational monitoring, developer-centric visualization libraries, industry-specific dashboards, and AI-assisted reporting. This increasingly competitive environment has accelerated product innovation while simultaneously lowering adoption barriers for organizations of every size.
Self-service analytics has become another defining trend reshaping enterprise data strategies. Rather than relying exclusively on centralized data teams or business intelligence specialists, organizations increasingly empower business users to create dashboards, perform exploratory analysis, and generate reports independently. Modern visualization software combines drag-and-drop interfaces, low-code functionality, natural language querying, and automated recommendations to make sophisticated analytics accessible to employees across finance, marketing, operations, human resources, healthcare, manufacturing, retail, telecommunications, government, and education. This democratization of analytics enables faster decisions while reducing pressure on technical teams.
Embedded analytics is also becoming a major growth engine within the broader visualization ecosystem. Instead of requiring users to switch between operational applications and standalone business intelligence platforms, organizations increasingly integrate interactive dashboards directly into CRM systems, ERP software, HR platforms, financial applications, customer portals, and SaaS products. This seamless integration allows users to consume insights within their existing workflows, increasing adoption rates while improving productivity across the enterprise. Industry forecasts suggest embedded analytics will continue expanding at one of the fastest growth rates across enterprise software throughout the coming decade.
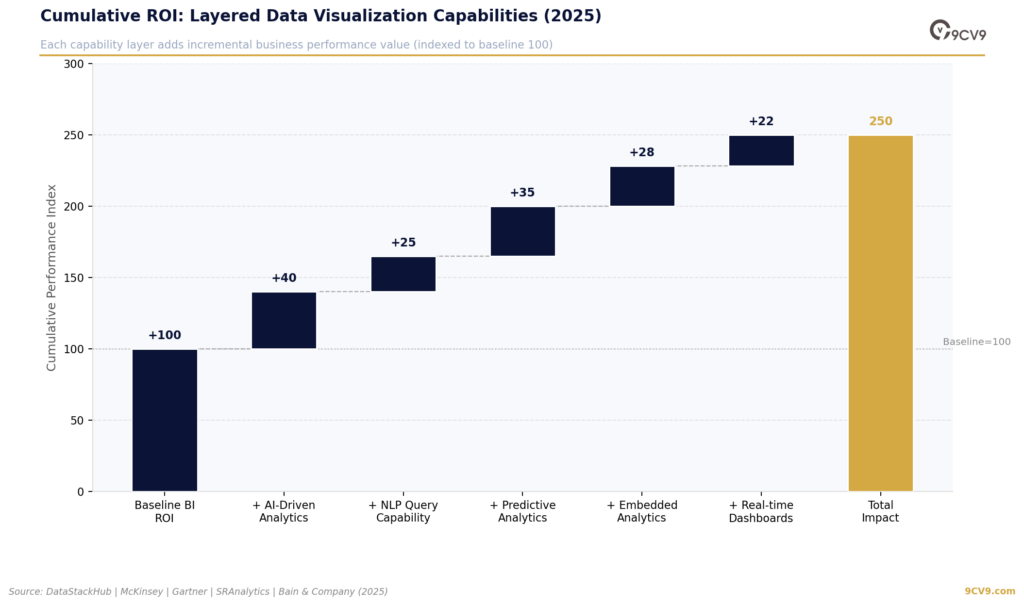
The business impact of effective data visualization extends well beyond attractive dashboards. Organizations consistently report significant improvements in decision-making speed, operational efficiency, customer acquisition, revenue growth, and strategic execution after adopting modern visualization platforms. Research highlighted throughout this collection of statistics demonstrates substantial returns on investment, shorter meeting durations, improved collaboration, and higher organizational performance among companies that successfully integrate business intelligence and visualization into their daily operations. At the same time, visualization tools play a critical role in identifying poor data quality, uncovering hidden patterns, supporting predictive analytics, and reducing costly business errors before they escalate.
Regional adoption patterns further illustrate the global expansion of visualization software. North America continues to dominate market share due to mature enterprise technology ecosystems and widespread analytics adoption, while Asia-Pacific represents the fastest-growing region as organizations across China, India, Japan, Southeast Asia, and other emerging markets accelerate digital transformation initiatives. Europe continues benefiting from increasing regulatory requirements surrounding data governance and compliance, while Latin America, the Middle East, and Africa are experiencing growing investments in cloud-based analytics and business intelligence infrastructure.
Industry-specific demand remains equally strong across sectors including banking, financial services, insurance, healthcare, retail, manufacturing, telecommunications, government, logistics, and technology. Organizations leverage visualization platforms to monitor cybersecurity threats, optimize supply chains, improve customer experiences, detect fraud, manage financial risk, monitor operational performance, support ESG reporting, and analyze market trends. As digital transformation accelerates worldwide, visualization software continues expanding from traditional reporting functions into mission-critical operational systems that support both strategic planning and real-time decision-making.
Another noteworthy trend in 2026 is the growing emphasis on data literacy. Although business intelligence platforms have achieved widespread organizational adoption, many enterprises continue investing heavily in training employees to interpret data accurately and communicate findings effectively. The combination of intuitive visualization interfaces, AI-assisted analysis, and self-service capabilities is helping bridge the skills gap, allowing more employees to make informed decisions based on reliable evidence rather than intuition alone. As organizations continue cultivating data-driven cultures, visualization software serves as the interface that connects complex analytical models with everyday business users.
The convergence of artificial intelligence, business intelligence, cloud computing, embedded analytics, automation, and human-centered design is positioning data visualization software as one of the most strategically important enterprise technologies of the decade. Rather than serving simply as reporting tools, modern visualization platforms have become intelligent decision-support systems capable of transforming vast amounts of raw information into actionable business intelligence within seconds.
This comprehensive collection of the Top 110 Data Visualization Software Statistics, Data & Trends in 2026 brings together the latest market figures, growth forecasts, adoption rates, competitive landscape insights, cloud deployment trends, artificial intelligence developments, business impact metrics, regional analyses, workforce statistics, cognitive science research, embedded analytics data, and future outlook projections. Whether you are a business executive, technology leader, software buyer, investor, analyst, developer, consultant, marketer, or researcher, these carefully curated statistics provide a data-driven overview of one of the fastest-growing segments within the global enterprise software industry, helping you understand where the market stands today and where it is heading in the years ahead.
Before we venture further into this article, we would like to share who we are and what we do.
About 9cv9
9cv9 is a business tech startup based in Singapore and Asia, with a strong presence all over the world.
With over ten years of startup and business experience, and being highly involved in connecting with thousands of companies and startups, the 9cv9 team has listed some important and crucial software tools in this review.
If you like to get your company listed in our top B2B software reviews, check out our world-class 9cv9 Media and PR service and pricing plans here.
Top 110 Data Visualization Software Statistics, Data & Trends in 2026
MARKET SIZE & GROWTH
- $9.72 billion — The global data visualization market was valued at $9.72 billion in 2024, establishing a strong foundation for the explosive growth projected through 2034. (Mordor Intelligence)
- $10.92 billion — By 2025, the data visualization market reached approximately $10.92 billion, reflecting accelerating enterprise demand for real-time dashboards and visual analytics platforms. (Mordor Intelligence)
- $12.24 billion — Fortune Business Insights estimates the global data visualization market at $12.24 billion in 2025, driven by AI integration and cloud-native platform maturation. (Fortune Business Insights)
- $13.71 billion — In 2026, the global data visualization market is projected to reach $13.71 billion, marking a pivotal inflection point as embedded analytics and self-service tools reach mass adoption. (Fortune Business Insights)
- $18.36 billion by 2030 — Mordor Intelligence forecasts the data visualization market will reach $18.36 billion by 2030, driven by cloud migration, AI-powered analytics, and growing data literacy investment. (Mordor Intelligence)
- $34.07 billion by 2034 — The global data visualization market is set to reach $34.07 billion by 2034, representing nearly a 3× expansion over a decade and making it one of enterprise software’s most dynamic growth sectors. (Fortune Business Insights)
- 10.95% CAGR (2025–2030) — A sustained 10.95% compound annual growth rate positions data visualization software as a high-conviction investment area, outpacing broader enterprise software growth and tracking closely with AI adoption curves. (Mordor Intelligence)
- 12.05% CAGR (2026–2034) — The longer-term CAGR of 12.05% underscores the structural nature of demand — organizations are not experimenting with data visualization; they are institutionalizing it. (Fortune Business Insights)
- $8.48 billion in 2026 (tools segment) — A narrower sizing of standalone visualization tools pegs the segment at $8.48 billion in 2026, reflecting the specialized but rapidly growing market for purpose-built charting and dashboarding software. (Industry Research Biz)
- $20.20 billion self-service BI by 2030 — The worldwide self-service BI market is expected to grow from $5.71 billion in 2023 to $20.22 billion by 2030, as non-technical users demand direct access to analytics without relying on data teams. (G2)
- $54.9 billion global BI market by 2026 — The broader business intelligence market — within which data visualization is a core pillar — is projected at $54.9 billion by 2026, growing at 12.4% CAGR from 2021. (DataStackHub)
- $15.46 billion by 2029 (13.0% CAGR) — The Business Research Company forecasts data visualization tools reaching $15.46 billion by 2029, with big data proliferation identified as a primary catalyst. (The Business Research Company)
- $7.95 billion market growth — Technavio projects the data visualization tools market will add $7.95 billion in absolute value between 2025 and 2029, growing at 11.2% CAGR — validating continued strong multi-year investment momentum. (Technavio)
- 11.6% CAGR (2021–2026) — MarketsandMarkets previously pegged the market’s CAGR at 11.6% between 2021 and 2026, a forecast that has largely proved accurate and reinforces credibility in current long-range projections. (MarketsandMarkets)
- $20,198 million by 2035 — Industry Research Biz projects the data visualization tools market reaching $20.2 billion by 2035, growing at a 9.07% CAGR, with BFSI, IT/Telecom, and retail as lead verticals. (Industry Research Biz)
COMPETITIVE LANDSCAPE & MARKET SHARE
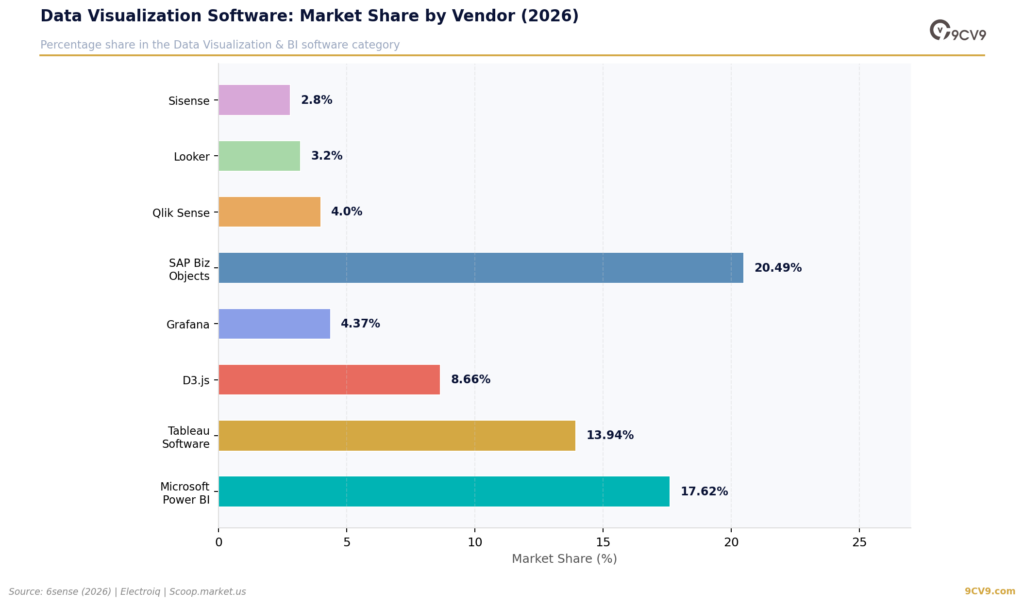
- Microsoft Power BI — 17.62% share — Power BI holds 17.62% of the global data visualization market, making it the clear category leader with over 120,000 organizational users and unmatched Microsoft ecosystem integration. (6sense, 2026)
- Tableau Software — 13.94% share — Tableau claims the second-largest share at 13.94% in the data visualization category, with a loyal enterprise following prizing its advanced visual analytics and design flexibility. (6sense, 2026)
- D3.js — 8.66% share — D3.js holds 8.66% of the market, reflecting strong developer adoption of the open-source library for custom, web-embedded visualizations that traditional BI tools cannot replicate. (6sense, 2026)
- Grafana — 4.37% share — Grafana’s 4.37% market share underscores the growing importance of operational and infrastructure monitoring as a key data visualization use case, particularly in DevOps and SRE teams. (6sense, 2026)
- SAP BusinessObjects — 20.49% in analytics & BI platforms — SAP BusinessObjects commands a 20.49% share in the broader analytics and BI platform category, reflecting decades of enterprise entrenchment in regulated industries. (Electroiq / 6sense)
- Power BI — 23.07% in Business Intelligence category — In the broader BI category, Power BI’s 23.07% share represents a decisive lead — its deep integration with Microsoft 365 and Azure gives it unmatched distribution reach. (6sense, 2026)
- Tableau — 120,000+ customer organizations — Tableau has surpassed 120,000 organizational customers globally, cementing its position as the preferred platform for enterprise teams requiring sophisticated data storytelling capabilities. (Electroiq)
- Power BI — 30 million+ monthly active users — Power BI’s 30 million+ monthly active users make it one of the most widely used analytics platforms globally, driven by accessible pricing and Microsoft ecosystem lock-in. (Electroiq)
- Power BI — 97% Fortune 500 adoption — Near-universal Fortune 500 adoption of Power BI reflects its status as a trusted enterprise standard — organizations deploying it benefit from proven scalability and regulatory compliance support. (Electroiq)
- 215 competitors to Power BI — Power BI competes with 215 other tools in the data visualization space, reflecting the market’s vibrant innovation ecosystem and the ongoing fragmentation of analytics use cases across industries. (6sense)
- 63% of Tableau customers in North America — Tableau’s geographic concentration — with approximately 63% of its global customer base in North America — signals an opportunity for vendors to capture growth in underserved APAC and EMEA markets. (DataBridge)
- Qlik — 50,000+ customers — Qlik’s 50,000+ customer base across enterprise tiers demonstrates the enduring appeal of its associative analytics engine for complex, cross-source data exploration tasks. (Electroiq)
- 677,000+ companies use data visualization tools globally — More than 677,000 companies worldwide now use at least one data visualization tool, up from 330,000+ in early 2025 — a remarkable acceleration in mainstream adoption. (6sense, 2026)
- 54.30% of data viz users are US-based — The United States hosts over half of all global data visualization software users, confirming North America’s dominance as both the largest market and primary innovation hub. (6sense)
- Top 3 DV vendor countries: US (54.3%), UK (7.81%), India (7.63%) — The UK and India’s emergence as major data visualization markets signals growing global maturity, with each country increasingly developing native data talent and infrastructure. (6sense)
CLOUD & DEPLOYMENT
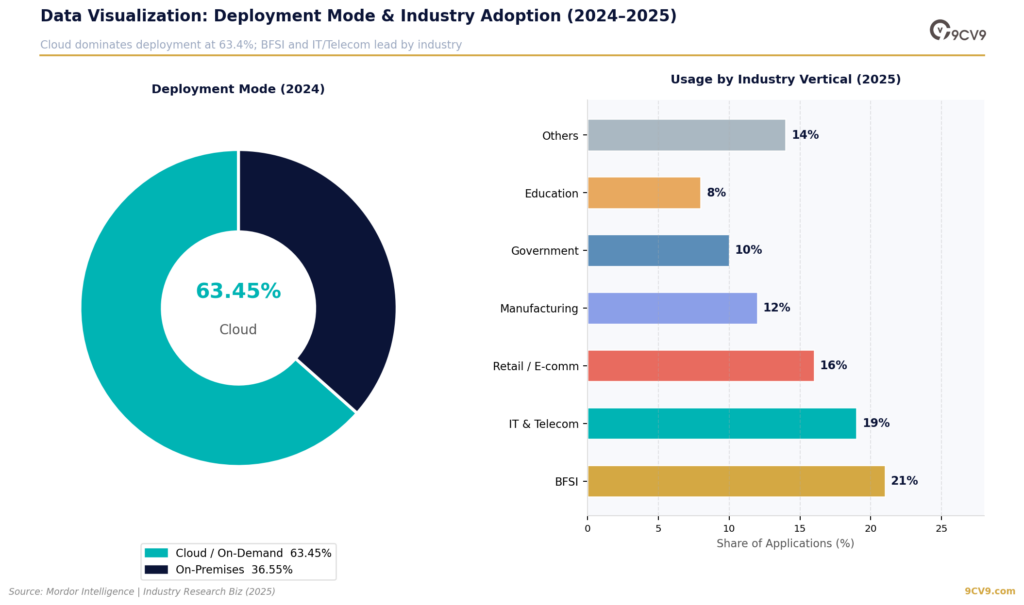
- 63.45% cloud market share (2024) — Cloud deployments captured 63.45% of the data visualization market in 2024, reflecting enterprises’ preference for elastic compute, zero-maintenance updates, and bundled AI services. (Mordor Intelligence)
- 12.65% CAGR for cloud segment — The cloud data visualization segment is growing at 12.65% CAGR through 2030 — faster than the overall market — as even traditionally on-premise industries migrate analytics workloads to the cloud. (Mordor Intelligence)
- 65% of BI deployments are cloud-based — Cloud BI deployments reached 65% globally in 2025, up sharply from 46% in 2023, demonstrating a fundamental infrastructure shift happening faster than most forecasts predicted. (DataStackHub)
- 85% of organizations expected to adopt cloud by 2025 — With near-universal cloud adoption materializing, data visualization vendors that fail to offer cloud-native experiences face structural competitive disadvantage. (ScaleUpAlly)
- 58% of enterprises say cloud BI is critical — More than half of enterprise IT decision-makers rate cloud BI as either critical or very important to their current and future strategic initiatives. (G2)
- 64% embedded analytics market on cloud (2025) — Cloud leads embedded analytics deployment at 64% share, enabling organizations to integrate dashboards into business applications without costly hardware provisioning. (PrecedenceResearch)
- On-premises still represents 42% of data viz tools — Despite cloud’s dominance, 42% of data visualization deployments remain on-premises — often in regulated sectors like healthcare, defense, and government where data sovereignty concerns persist. (Industry Research Biz)
AI & MACHINE LEARNING INTEGRATION
- 65% of organizations adopted AI for data analytics — Approximately 65% of organizations had either adopted or were actively investigating AI technologies for data and analytics as of 2025, marking AI as a mainstream rather than emerging practice. (SRAnalytics)
- 78% say AI improved their work — 78% of data professionals report that AI has already meaningfully improved their analytical work — a finding that validates continued enterprise investment in AI-powered visualization platforms. (Luzmo)
- 70% believe AI will be a differentiator in product insights — 70% of analytics professionals believe AI will create meaningful competitive differentiation in how products deliver data insights — signaling urgency around AI roadmap investments. (Luzmo)
- 73% faster insights with AI visualization — AI-powered data visualization delivers 73% faster insights compared to traditional analytics workflows, compressing the time from raw data to actionable decision from days to minutes. (SRAnalytics)
- Analysts save 8+ hours per week via AI tools — AI visualization tools save data analysts more than 8 hours per week — the equivalent of an additional full working day that can be redirected toward higher-value strategic analysis. (SRAnalytics)
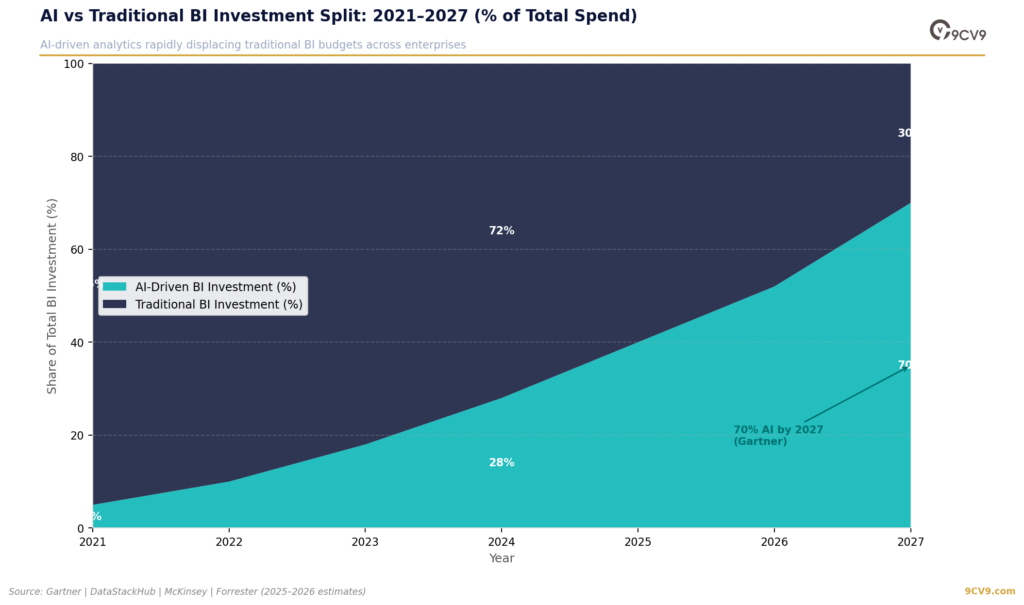
- 40% of all BI investment is AI-driven in 2025 — AI now commands 40 cents of every dollar invested in business intelligence, reflecting C-suite conviction that predictive and generative analytics capabilities are essential for competitive survival. (DataStackHub)
- 48% increase in ML integration in BI dashboards — Machine learning integration in business intelligence dashboards surged 48% in 2025, driven by vendor competition to embed predictive capabilities as a table-stakes feature. (DataStackHub)
- 80% of software vendors will embed AI by 2026 (Gartner) — Gartner’s forecast that 80%+ of software vendors will embed generative AI capabilities by 2026 means AI-powered visualization will rapidly shift from differentiator to commodity. (Gartner via ScaleUpAlly)
- 59% of employees query data via NLP — Natural language processing has empowered 59% of employees to ask data questions conversationally, eliminating the SQL knowledge barrier and democratizing analytics access across non-technical roles. (DataStackHub)
- 50% of report creation automated by AI by 2027 — Generative AI is projected to automate half of all report creation and visualization tasks by 2027, fundamentally shifting the analyst’s role from data preparer to insights curator. (DataStackHub)
- 27.67% CAGR of enterprise AI data tools market — The enterprise AI data tools market is growing at a 27.67% CAGR toward $826.70 billion by 2030, representing one of the fastest wealth creation opportunities in the technology sector. (SRAnalytics)
- Over 80% of enterprise data is unstructured — With more than 80% of enterprise data existing in unstructured formats like PDFs and scans, AI-native visualization platforms that can process unstructured inputs hold a dramatic capability advantage. (PatrickFrank.com)
- AI visualization tools reduce integration costs by 30–50% — Integrating AI visualization tools with existing cloud infrastructure can lower overall integration expenses by 30–50%, making the business case for AI analytics even more compelling. (PatrickFrank.com)
- 88% of businesses report AI-boosted annual revenue — 88% of businesses implementing AI-powered analytics tools report measurable revenue increases, with 30% experiencing growth exceeding 10% — a compelling ROI argument for visualization investment. (PatrickFrank.com)
- 87% say AI reduced annual costs — 87% of organizations leveraging AI analytics report annual cost reductions, with 25% achieving reductions of more than 10% — confirming AI-driven data visualization as both a growth and efficiency lever. (PatrickFrank.com)
ROI & BUSINESS IMPACT
- $13.01 ROI per $1 spent on BI visualization — The Wharton School of Business found data visualization BI delivers $13.01 in return for every dollar invested — one of the highest documented ROIs in enterprise software. (Wharton / South Oregon University via Spiralytics)
- 127% average ROI within 3 years of BI deployment — Organizations that deploy BI platforms report 127% average return on investment within three years, with the compounding benefit of better decisions accelerating value over time. (DataStackHub)
- 112% ROI with 1.6-year payback period — Nucleus Research documented an average 112% ROI and 1.6-year payback period for BI investments — making data visualization tools among the fastest-payback enterprise technology purchases. (Nucleus Research via Scoop.market.us)
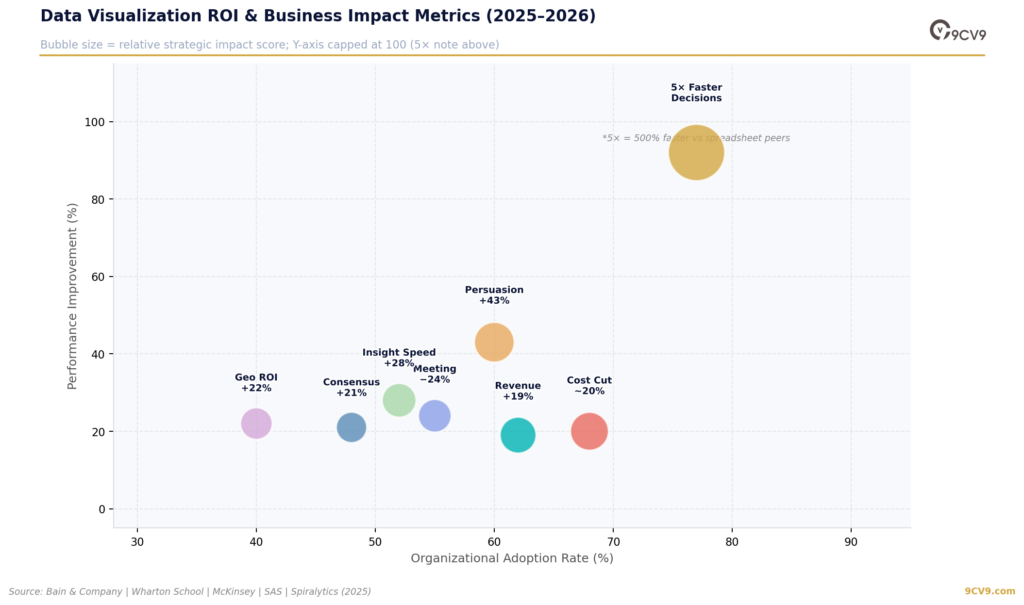
- 5× faster decision-making — Companies using decision-driven visualization make choices five times faster than competitors relying on spreadsheets, according to Bain & Company — a speed advantage that compounds significantly in fast-moving markets. (Bain & Company via SRAnalytics)
- 3× more effective strategy execution — Bain & Company also found that organizations using strategic visualization execute decisions three times more effectively than those using traditional tabular analysis — affecting not just speed but quality. (Bain & Company)
- 77% of organizations optimize decision-making via visualization — More than three-quarters of companies using data visualization tools report measurably optimized decision-making outcomes — a benchmark figure for vendor ROI conversations. (SAS / Scribd via Spiralytics)
- 43% more persuasive with visualization tools — Teams using data visualization are 43% more effective at persuading audiences to take action — a finding with direct implications for sales presentations, board reports, and change management initiatives. (Amanet.org via Spiralytics)
- 24% shorter meeting times — Data visualization shortens meeting times by 24% on average, improving organizational efficiency and freeing up thousands of person-hours annually that can be redirected to productive work. (Amanet.org via Spiralytics)
- 21% faster consensus with visual language — Groups using visual language in discussions reach consensus 21% faster than those using text-only communication — a measurable productivity benefit that scales with organizational size. (Amanet.org)
- 67% of audiences convinced with visuals vs. 50% with verbal — Wharton School research confirms visuals boost persuasion rates from 50% to 67% — a 34% improvement that justifies investing in high-quality data visualization for executive communications. (Wharton School)
- $12.9M average annual cost of poor data quality — Gartner estimates organizations lose $12.9 million annually due to poor data quality — a cost that effective data visualization pipelines can substantially reduce by surfacing anomalies and inconsistencies earlier. (Gartner via SRAnalytics)
- 53% of collected data goes unanalyzed — Salesforce research reveals that over half of all business data collected is never analyzed — a colossal missed opportunity that modern data visualization platforms are specifically designed to close. (Salesforce via SRAnalytics)
- 19% higher revenue growth for customer analytics users — Companies using BI tools for customer analytics consistently achieve 19% higher revenue growth than competitors who do not — validating customer data visualization as a direct revenue driver. (DataStackHub)
- 2.5× faster decisions for advanced BI maturity organizations — Organizations that have achieved high BI maturity operate at 2.5 times the decision-making speed of early-adoption peers — demonstrating the compounding returns of sustained BI investment. (DataStackHub)
- 40% higher ROI on analytics investment — Advanced BI maturity organizations also report 40% higher ROI on their analytics investments — reinforcing the argument that organizational capability matters as much as software selection. (DataStackHub)
- 22% higher ROI on locations using geographic data visualization — McKinsey found that companies using multi-layer geographic visualizations for expansion decisions achieved 22% better returns on new location investments compared to spreadsheet-based analysis. (McKinsey via SRAnalytics)
- 18–22% operational cost reduction — Organizations that deploy BI analytics tools report 18–22% reductions in operational costs through better forecasting, inventory optimization, and process efficiency improvements. (DataStackHub)
- 35% reduction in decision latency — Predictive BI analytics reduces the time between insight generation and business action by 35% — dramatically compressing the decision cycle in fast-moving competitive environments. (DataStackHub)
- Data-driven organizations 23× more likely to acquire customers — Harvard Business Review research shows data-driven organizations are 23 times more likely to acquire customers and 6 times more likely to retain them — the ultimate argument for investing in robust data visualization infrastructure. (HBR cited via DataStackHub)
- Companies with BI are 2× more likely in top financial quartile — Organizations using business intelligence tools are twice as likely to rank in the top quartile of financial performance within their industries. (WifiTalents)
- BI adoption reduces customer churn significantly — Companies using BI for customer analytics report 19% higher revenue growth, with customer retention identified as the primary driver — making churn prediction dashboards among the highest-value visualization investments. (DataStackHub)
REGIONAL & INDUSTRY TRENDS
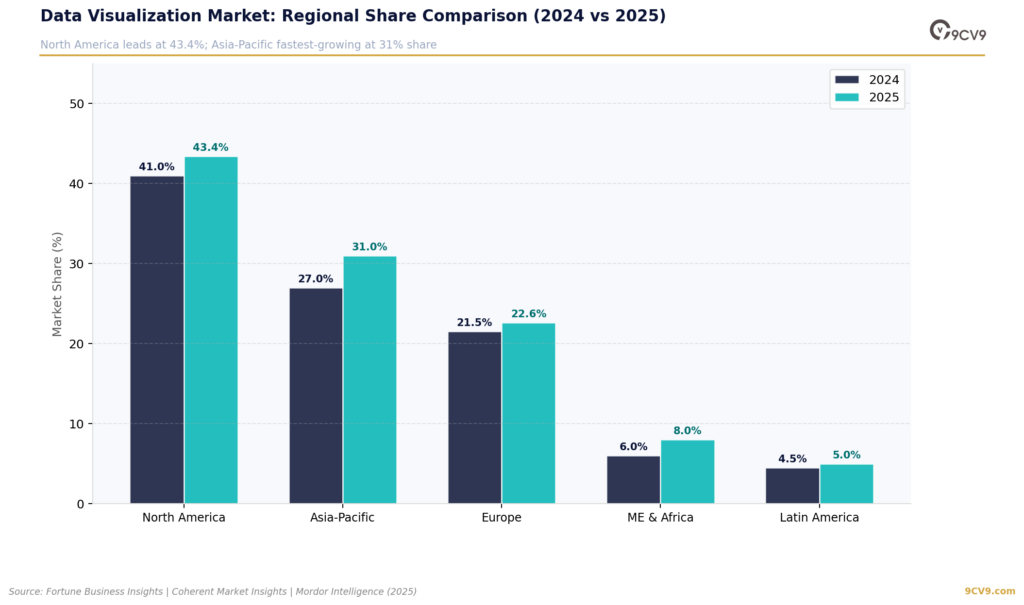
- North America — 43.39% global share (2025) — North America dominates the global data visualization market with a 43.39% share, driven by a dense concentration of technology-forward enterprises, mature data infrastructure, and strong analytics talent pipelines. (Fortune Business Insights)
- Asia-Pacific — 31% share and fastest-growing — Asia-Pacific’s 31% share and fastest-growing status reflects the region’s rapid digital transformation, with China, India, and Japan leading enterprise analytics modernization programs. (Coherent Market Insights)
- Europe — 22.6% market share — Europe holds a 22.6% share of the global data visualization market, with growth supported by strong enterprise digitization mandates and increasingly stringent data governance regulations like GDPR driving analytics investment. (Coherent Market Insights)
- Middle East & Africa — 33% cloud BI growth in 2025 — Cloud BI demand in the Middle East and Africa surged 33% in 2025, propelled by ambitious government smart city and digital transformation initiatives across Saudi Arabia, UAE, and South Africa. (DataStackHub)
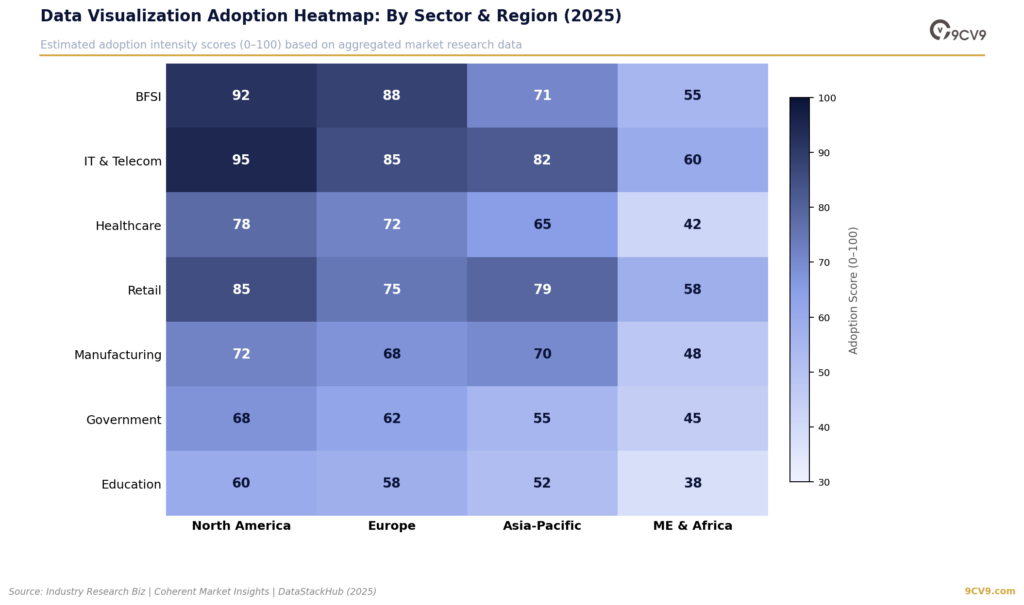
- IT & Telecom — #1 industry vertical for data visualization — IT and telecommunications organizations lead enterprise data visualization adoption, driven by the need to monitor complex network performance, visualize cybersecurity threats, and track real-time service metrics. (Coherent Market Insights)
- BFSI — 21% of data visualization applications — The banking, financial services, and insurance sector accounts for 21% of data visualization use — risk dashboards, compliance reporting, and customer analytics make visualization a regulatory and competitive necessity. (Industry Research Biz)
- IT & Telecom — 19% of applications — IT and telecom organizations claim 19% of data visualization application use cases, including network topology visualization, anomaly detection dashboards, and real-time performance monitoring. (Industry Research Biz)
- Retail/E-commerce — 16% share — Retail organizations account for 16% of data visualization deployments, using dashboards for inventory management, customer behavior analytics, sales performance tracking, and omnichannel attribution. (Industry Research Biz)
- SME BI adoption growing at 12% CAGR — Small and medium enterprises represent the fastest-growing BI adopter segment at 12% CAGR, as subscription pricing, no-code interfaces, and cloud deployment lower barriers to entry for smaller organizations. (WifiTalents)
- Latin America — 61% BI adoption rate — 61% of Latin American firms have adopted BI tools, with financial services and retail leading investment — signaling significant remaining growth potential as digitalization accelerates in Brazil and Mexico. (DataStackHub)
- BFSI holds 18% of global BI market revenue — The banking, financial services, and insurance sector accounts for nearly 18% of global BI revenue — the highest concentration of any single industry — reflecting risk management, regulatory, and customer analytics demands. (WifiTalents)
EMBEDDED ANALYTICS
- Embedded analytics market — $50.64 billion in 2025 — The global embedded analytics market reached $50.64 billion in 2025, reflecting organizations’ preference for analytics delivered within existing workflows rather than separate BI applications. (GlobalGrowthInsights)
- $56.89 billion embedded analytics in 2026 — The embedded analytics market is projected to reach $56.89 billion in 2026, accelerating toward $162.12 billion by 2035 as every major SaaS platform embeds analytics as a core feature. (GlobalGrowthInsights)
- 68% of organizations adopting embedded analytical tools — More than two-thirds of organizations now embed analytics directly into their operational software, fundamentally changing the expectation that analytics requires switching to a dedicated BI tool. (GlobalGrowthInsights)
- 70% of SaaS vendors integrate built-in analytics — Approximately 70% of SaaS vendors have integrated built-in analytics into their products, effectively commoditizing basic visualization and raising the bar for standalone visualization software vendors. (GlobalGrowthInsights)
- $100.98 billion embedded analytics by 2035 — Precedence Research forecasts embedded analytics reaching $100.98 billion by 2035, growing at 15.74% CAGR — among the fastest growth rates in the entire enterprise software landscape. (PrecedenceResearch)
- 64% cloud share in embedded analytics — Cloud-based deployment accounts for 64% of embedded analytics implementations, as organizations prioritize scalability and seamless integration over the data control benefits of on-premise solutions. (PrecedenceResearch)
- 57% SME increase in embedded analytics in ERP/HRM — The integration of embedded analytics into ERP and HRM systems among SMEs has increased by 57%, creating new revenue opportunities for analytics vendors targeting mid-market operational software. (GlobalGrowthInsights)
- IT & Telecom — 29% of embedded analytics end-user share — IT and telecommunications organizations captured 29% of embedded analytics end-user market share in 2025 — the highest of any vertical — driven by real-time network monitoring and customer experience analytics needs. (PrecedenceResearch)
- By 2026, 75%+ of enterprises will embed AI-oriented analytics — Industry forecasts project that by 2026, over 75% of enterprises will have AI-oriented analytics embedded within their business applications, making AI-powered visualization a baseline expectation. (iMarc Group)
WORKFORCE, ADOPTION & DATA LITERACY
- 78% of global enterprises have at least one BI platform — Near-ubiquitous enterprise BI deployment — at 78% globally — confirms that data visualization has transitioned from competitive advantage to operational necessity in the modern enterprise. (DataStackHub)
- Global BI employee adoption rate — 26% — Despite widespread platform availability, only 26 out of every 100 employees regularly use BI tools — a persistent gap that underscores the critical importance of UX design, training, and change management in analytics rollouts. (StraitResearch)
- Only 24% of executives are data literacy certified — The alarming gap in executive data literacy — with only 24% certified — represents both a risk and an opportunity: organizations that invest in executive analytics training gain disproportionate decision-making advantages. (G2)
- 4.3 million data professional shortage by 2025 — IBM’s forecast of a 4.3 million global data professional shortage creates powerful demand for self-service visualization tools that allow non-experts to derive insights without specialist intervention. (IBM cited via Scoop.market.us)
- 31% YoY increase in self-service BI adoption — Self-service BI adoption grew 31% year-over-year in 2025, as business teams increasingly demand analytics autonomy from IT departments — driving investment in no-code and low-code visualization platforms. (DataStackHub)
- 68% of organizations use BI for operational and strategic planning — More than two-thirds of organizations now consider BI essential for both day-to-day operations and long-term strategic planning, reflecting analytics’ evolution from reporting tool to business operating system. (DataStackHub)
- Average spending per employee on BI software was $7.80 in 2024 — The low per-user cost of BI software makes data visualization tools among the highest-ROI technology investments available — a strong argument for expanding organizational licensing and training programs. (G2)
COGNITIVE SCIENCE & VISUALIZATION EFFECTIVENESS
- 60,000× faster visual processing — 3M Corporation research confirms humans process visual information 60,000 times faster than text — the fundamental cognitive rationale that makes data visualization not just helpful but neurologically essential for rapid decision-making. (3M Corporation)
- 50%+ of brain cortex dedicated to visual processing — More than half of the human brain’s cortex is dedicated to processing visual input, providing the neuroscientific foundation for why well-designed dashboards consistently outperform textual reports in comprehension speed. (Rochester Medical Research)
- Image recognition in 13 milliseconds — MIT neuroscience research established that the human brain can recognize an entire image in just 13 milliseconds — making visualization the fastest possible communication medium for complex data. (MIT News)
- 28% faster insight discovery with interactive dashboards — Businesses using interactive data visualization tools are 28% more likely to find relevant information faster than organizations relying on static dashboards — a measurable competitive advantage. (Luzmo)
- 2.8 billion dashboards created in 2023 — Over 2.8 billion dashboards were created across industries in 2023 for business intelligence and predictive analytics — a statistic that illustrates data visualization’s complete institutionalization in enterprise operations. (Industry Research Biz)
FUTURE OUTLOOK
- 181 zettabytes of data by end of 2026 — With global data expected to reach 181 zettabytes by end of 2026, the volume of information requiring visualization will make data visualization software structurally essential — not optional — for every data-generating enterprise. (PatrickFrank.com)
- 70% of enterprise analytics spending will be AI-driven by 2027 — Gartner projects that AI-driven BI will account for 70% of enterprise analytics spending by 2027, signaling a fundamental industry realignment that will reshape vendor competitive dynamics within two years. (Gartner via DataStackHub)
- Embedded BI to become default in SaaS/ERP by 2028 — By 2028, embedded BI is projected to become the default feature in SaaS and ERP ecosystems — fundamentally blurring the line between business software and analytics platforms. (DataStackHub)
- 45% of firms to use BI for ESG reporting by 2027 — BI tools will be used by 45% of firms to meet ESG reporting mandates by 2027, opening a significant new use case for data visualization in sustainability compliance and stakeholder reporting. (DataStackHub)
- $826.70 billion enterprise AI data tools market by 2030 — The convergence of AI and enterprise data tools will create an $826.70 billion market by 2030 — representing the most significant value-creation opportunity in the history of enterprise analytics software. (SRAnalytics)
Conclusion
The data presented throughout these 110 data visualization software statistics paints a clear picture of an industry that is entering one of the most transformative periods in its history. As organizations continue generating unprecedented volumes of digital information, data visualization has evolved from a supplementary reporting function into a mission-critical capability that enables faster decisions, stronger collaboration, and more intelligent business strategies. In 2026, visualization software is no longer simply about creating attractive charts and dashboards—it serves as the interface between massive data ecosystems and the people responsible for making high-impact decisions across every industry.
The market’s impressive growth trajectory reflects this fundamental shift. With the global data visualization market projected to reach approximately $13.71 billion in 2026 and forecasts extending beyond $34 billion over the next decade, organizations worldwide are making long-term investments in analytics platforms that support digital transformation, cloud migration, artificial intelligence, and enterprise-wide data democratization. Sustained double-digit annual growth rates further demonstrate that demand is being driven by structural changes in how businesses operate rather than temporary technology trends.
Artificial intelligence has emerged as the defining force shaping the future of visualization software. AI-powered dashboards, automated insight generation, natural language querying, predictive analytics, anomaly detection, and machine learning integration are rapidly becoming standard capabilities rather than premium features. As more organizations deploy generative AI throughout their analytics workflows, employees can spend less time preparing reports and more time interpreting insights, developing strategies, and solving business problems. Industry forecasts suggesting that the vast majority of enterprise software vendors will embed AI into their products illustrate how quickly intelligent analytics is becoming the new baseline for competitive software platforms.
Cloud computing continues to reinforce this transformation by making sophisticated visualization capabilities accessible to organizations of every size. Cloud-native deployments provide scalability, flexibility, lower infrastructure costs, real-time collaboration, and seamless integration with modern business applications. While regulated industries continue maintaining hybrid and on-premises environments where appropriate, the overall direction of the market strongly favors cloud-first architectures that support continuous innovation and AI-driven services. This transition enables organizations to modernize their analytics infrastructure while supporting increasingly distributed workforces and global operations.
Another major theme emerging from these statistics is the widespread democratization of analytics. Business intelligence is no longer reserved exclusively for data scientists or technical specialists. Self-service visualization platforms, intuitive drag-and-drop interfaces, low-code development environments, and conversational analytics are enabling professionals across finance, sales, marketing, human resources, operations, healthcare, manufacturing, education, retail, and government to access insights independently. This shift is helping organizations reduce bottlenecks, accelerate decision-making, and foster stronger data-driven cultures across every department.
The competitive landscape also continues to mature. Industry leaders such as Microsoft Power BI, Tableau, Qlik, SAP BusinessObjects, D3.js, and Grafana have established strong global footprints, while hundreds of emerging vendors continue introducing specialized solutions focused on embedded analytics, operational monitoring, AI-assisted reporting, industry-specific dashboards, and developer-centric visualization libraries. This competitive environment encourages continuous innovation while providing organizations with a diverse range of options tailored to different business needs, budgets, and technical requirements.
Embedded analytics represents another significant opportunity highlighted throughout these statistics. Organizations increasingly expect analytics to be integrated directly into their CRM platforms, ERP systems, HR software, financial applications, customer portals, and operational workflows instead of existing as standalone reporting environments. As embedded analytics adoption continues expanding, software vendors that successfully deliver contextual insights within everyday business applications are likely to gain significant competitive advantages while improving user engagement and overall productivity.
Perhaps most importantly, these statistics consistently demonstrate that investments in data visualization generate measurable business outcomes. Organizations adopting modern business intelligence platforms report higher returns on investment, faster decision-making, improved operational efficiency, stronger customer acquisition, increased revenue growth, better collaboration, reduced costs, and enhanced strategic execution. Visualization software also plays a critical role in identifying data quality issues, uncovering hidden business opportunities, supporting compliance reporting, and enabling predictive decision-making. These measurable outcomes explain why visualization technology continues attracting substantial investment despite broader economic uncertainty.
Regional growth patterns further reinforce the global importance of visualization software. While North America maintains its leadership position through mature technology ecosystems and widespread enterprise adoption, Asia-Pacific continues emerging as the fastest-growing region due to accelerating digital transformation initiatives and expanding investments in cloud infrastructure, artificial intelligence, and enterprise analytics. Europe remains a significant market driven by regulatory compliance and digital modernization, while Latin America, the Middle East, and Africa continue demonstrating growing adoption as organizations strengthen their business intelligence capabilities.
The rapid growth of enterprise data also ensures that demand for visualization platforms will remain strong well beyond 2026. With global digital information expected to reach approximately 181 zettabytes by the end of the year, organizations face increasing pressure to transform overwhelming amounts of raw data into understandable, actionable intelligence. Visualization software will continue serving as the bridge between complex datasets and practical business decisions, helping organizations navigate growing information complexity while maintaining competitive agility.
Looking ahead, the future of data visualization software extends far beyond traditional dashboards. Advances in generative AI, autonomous analytics, augmented analytics, conversational business intelligence, real-time streaming data, predictive modeling, and embedded decision intelligence will fundamentally reshape how organizations interact with information. Rather than merely presenting historical data, next-generation visualization platforms will increasingly recommend actions, forecast outcomes, explain trends automatically, and enable business users to make informed decisions with minimal technical expertise. These innovations will continue transforming visualization software from a reporting solution into an intelligent business operating system.
Ultimately, the 110 statistics compiled in this report demonstrate that data visualization software has become one of the foundational technologies supporting modern enterprises. Whether organizations aim to improve executive decision-making, accelerate digital transformation, optimize operations, enhance customer experiences, strengthen regulatory compliance, or unlock the full value of artificial intelligence, visualization platforms will remain at the center of those initiatives. For executives, investors, software vendors, technology professionals, analysts, consultants, researchers, and business leaders alike, understanding these trends provides valuable insight into where enterprise analytics is heading and why data visualization will continue to play an increasingly central role in shaping the future of business intelligence throughout the remainder of this decade.
If you find this article useful, why not share it with your hiring manager and C-level suite friends and also leave a nice comment below?
We, at the 9cv9 Research Team, strive to bring the latest and most meaningful data, guides, and statistics to your doorstep.
To get access to top-quality guides, click over to 9cv9 Blog.
To hire top talents using our modern AI-powered recruitment agency, find out more at 9cv9 Modern AI-Powered Recruitment Agency.
People Also Ask
What is data visualization software?
Data visualization software transforms raw data into charts, dashboards, maps, and graphs that help users understand trends, patterns, and insights more effectively for faster business decision-making.
Why is data visualization software important in 2026?
In 2026, organizations rely on data visualization software to simplify massive datasets, accelerate analytics, improve collaboration, and support AI-driven decision-making across business operations.
How large is the global data visualization software market in 2026?
Industry forecasts estimate the global data visualization software market will reach approximately $13.71 billion in 2026, supported by growing enterprise adoption and digital transformation initiatives.
What is driving the growth of the data visualization software market?
Key growth drivers include AI adoption, cloud computing, business intelligence modernization, self-service analytics, embedded analytics, and the rapid expansion of enterprise data.
How is artificial intelligence changing data visualization software?
AI automates dashboard creation, identifies patterns, predicts trends, enables natural language queries, and generates actionable insights, making analytics faster and more accessible.
What industries use data visualization software the most?
Banking, healthcare, retail, manufacturing, telecommunications, government, education, logistics, and technology companies are among the largest adopters of data visualization platforms.
What are the benefits of using data visualization software?
Organizations benefit from improved decision-making, faster reporting, better collaboration, enhanced productivity, increased operational efficiency, and stronger business intelligence capabilities.
What is self-service data visualization?
Self-service data visualization allows non-technical users to build dashboards and analyze data independently using drag-and-drop tools and intuitive interfaces without extensive coding knowledge.
What is embedded analytics?
Embedded analytics integrates dashboards and visual reports directly into business applications, enabling users to access insights without switching between multiple software platforms.
Which deployment model is most popular for data visualization software?
Cloud-based deployment continues to dominate because it offers scalability, lower infrastructure costs, easier collaboration, automatic updates, and remote accessibility.
Which companies lead the data visualization software market?
Leading vendors include Microsoft Power BI, Tableau, Qlik, SAP BusinessObjects, Grafana, D3.js, and several other enterprise analytics platform providers.
How does data visualization improve business intelligence?
Visualization helps organizations identify trends, monitor KPIs, analyze customer behavior, detect anomalies, and make informed strategic decisions more quickly than traditional reporting.
What role does cloud computing play in data visualization?
Cloud computing enables real-time collaboration, scalable analytics infrastructure, seamless integrations, lower maintenance costs, and faster deployment of visualization platforms.
Can small businesses benefit from data visualization software?
Yes. Modern cloud-based solutions offer affordable pricing, user-friendly interfaces, and scalable features that help small businesses gain valuable insights from their operational data.
How does data visualization support digital transformation?
Visualization platforms consolidate enterprise data into interactive dashboards that help organizations optimize processes, monitor performance, and accelerate digital transformation initiatives.
Why is data visualization essential for big data analytics?
As data volumes continue growing, visualization software simplifies complex datasets into understandable charts and dashboards that enable faster analysis and better decisions.
What is the relationship between business intelligence and data visualization?
Data visualization is a core component of business intelligence, presenting analytical findings through visual formats that improve understanding and support executive decision-making.
Which region has the largest data visualization software market?
North America remains the largest market, while Asia-Pacific is experiencing the fastest growth due to expanding digital transformation and enterprise technology investments.
How does data visualization improve productivity?
Interactive dashboards reduce manual reporting, automate analysis, simplify collaboration, and enable employees to identify insights more efficiently across departments.
What is interactive data visualization?
Interactive visualization allows users to filter, drill down, zoom, and explore datasets dynamically, making business analysis more flexible and insightful.
How does natural language querying improve analytics?
Natural language querying enables users to ask business questions in plain language, allowing AI to generate charts, reports, and insights without requiring SQL expertise.
Why are dashboards important for businesses?
Dashboards provide real-time visibility into key performance indicators, helping organizations monitor operations, identify risks, and make timely strategic decisions.
How does data visualization improve customer insights?
Businesses can visualize purchasing behavior, engagement trends, customer journeys, and segmentation data to improve marketing, sales, and customer experience strategies.
What challenges does data visualization software solve?
It reduces information overload, improves data interpretation, highlights hidden trends, supports predictive analytics, and simplifies communication of complex information.
What are the latest trends in data visualization software for 2026?
Major trends include AI-powered dashboards, embedded analytics, cloud-native platforms, self-service business intelligence, predictive analytics, and automated insight generation.
How does data visualization support executive decision-making?
Executives use dashboards to monitor KPIs, evaluate business performance, compare trends, identify risks, and make evidence-based strategic decisions faster.
Why is data literacy becoming more important?
As organizations adopt analytics at scale, employees increasingly require the ability to interpret visual data accurately and make informed business decisions.
Will AI replace traditional data visualization tools?
The statistics indicate AI is enhancing rather than replacing visualization software by automating analysis and helping users generate insights more efficiently.
What should businesses consider when selecting data visualization software?
Organizations should evaluate AI capabilities, cloud support, scalability, integrations, security, ease of use, collaboration features, and total cost of ownership.
What does the future of data visualization software look like?
The industry is expected to continue expanding through AI innovation, cloud adoption, embedded analytics, predictive intelligence, and broader enterprise use across every major industry.
Sources
Mordor Intelligence Fortune Business Insights Coherent Market Insights SkyQuest Industry Research Biz Technavio The Business Research Company 6sense DataStackHub G2 WifiTalents Scoop Market US Electroiq Global Growth Insights Precedence Research Spiralytics SRAnalytics Luzmo Patrick Frank ScaleUpAlly IMARC Group Capterra India