
Key Takeaways
- Diverse Capabilities: Discover how Tableau, Power BI, Google Data Studio, Apache Spark, and SAS offer diverse capabilities from visualization to advanced analytics.
- Scalability and Performance: Learn how tools like Apache Spark and Power BI cater to scalability and real-time analytics needs, crucial for growing datasets in 2024.
- User-Friendly Innovation: Explore user-friendly features in Google Data Studio and SAS, empowering teams with intuitive interfaces for effective data analysis and decision-making.
In today’s fast-paced digital landscape, data is the new oil.
As organizations around the world continue to recognize the immense value hidden within their data, the demand for sophisticated data analytics tools has skyrocketed.
Whether you’re a business leader looking to make data-driven decisions, a data scientist striving to uncover deeper insights, or a marketer aiming to optimize your campaigns, having the right data analytics tools at your disposal is crucial.
The year 2024 promises to be a pivotal year for data analytics, with advancements in technology paving the way for more powerful and user-friendly tools.
The rapid evolution of artificial intelligence (AI), machine learning (ML), and big data analytics has enabled organizations to process and analyze vast amounts of data more efficiently and effectively than ever before.
With so many options available, selecting the right tools for your needs can be overwhelming. This blog aims to simplify that process by highlighting the top five data analytics tools that are set to dominate in 2024.
In this comprehensive guide, we’ll explore why data analytics tools are indispensable in today’s business environment and what criteria you should consider when choosing the best tools for your needs.
We will then dive into detailed overviews of the top five data analytics tools for 2024, discussing their key features, benefits, and use cases.
These tools have been selected based on their user-friendliness, integration capabilities, scalability, cost-effectiveness, and the strength of their support communities.
Data analytics has transformed from a niche technical discipline into a cornerstone of modern business strategy.
The insights derived from data analytics can drive smarter decision-making, optimize operations, enhance customer experiences, and uncover new revenue opportunities.
However, the effectiveness of these insights hinges on the quality and capability of the analytics tools used.
The tools we will discuss in this blog are not just industry leaders; they are also at the forefront of innovation, offering features that cater to a wide range of business needs and technical proficiencies.
Among the tools we will explore, you’ll find Tableau, renowned for its powerful data visualization capabilities that allow users to create interactive and shareable dashboards.
Power BI, Microsoft’s robust business analytics service, integrates seamlessly with other Microsoft products and offers extensive data connectivity options.
Google Data Studio, a free yet powerful tool, provides dynamic and customizable reports that are easy to share and collaborate on.
Apache Spark stands out for its ability to handle large-scale data processing and advanced analytics, making it a favorite among data engineers and scientists.
Lastly, SAS, a pioneer in analytics, continues to offer comprehensive solutions for complex data analysis, forecasting, and statistical modeling.
By the end of this blog, you will have a clear understanding of the top data analytics tools available in 2024, their unique strengths, and how they can help you unlock the full potential of your data.
Whether you’re new to data analytics or looking to upgrade your current toolkit, this guide will provide you with the insights needed to make an informed decision.
So, without further ado, let’s embark on this journey through the top 5 best tools for data analytics you should know in 2024. Get ready to transform your data into actionable insights and drive your business to new heights.
Before we venture further into this article, we like to share who we are and what we do.
About 9cv9
9cv9 is a business tech startup based in Singapore and Asia, with a strong presence all over the world.
With over eight years of startup and business experience, and being highly involved in connecting with thousands of companies and startups, the 9cv9 team has listed some important learning points in this overview of the Top 5 Best Tools for Data Analytics You Should Know in 2024.
If your company needs recruitment and headhunting services to hire top-quality employees, you can use 9cv9 headhunting and recruitment services to hire top talents and candidates. Find out more here, or send over an email to [email protected].
Or just post 1 free job posting here at 9cv9 Hiring Portal in under 10 minutes.
Top 5 Best Tools for Data Analytics You Should Know in 2024
1. Tableau
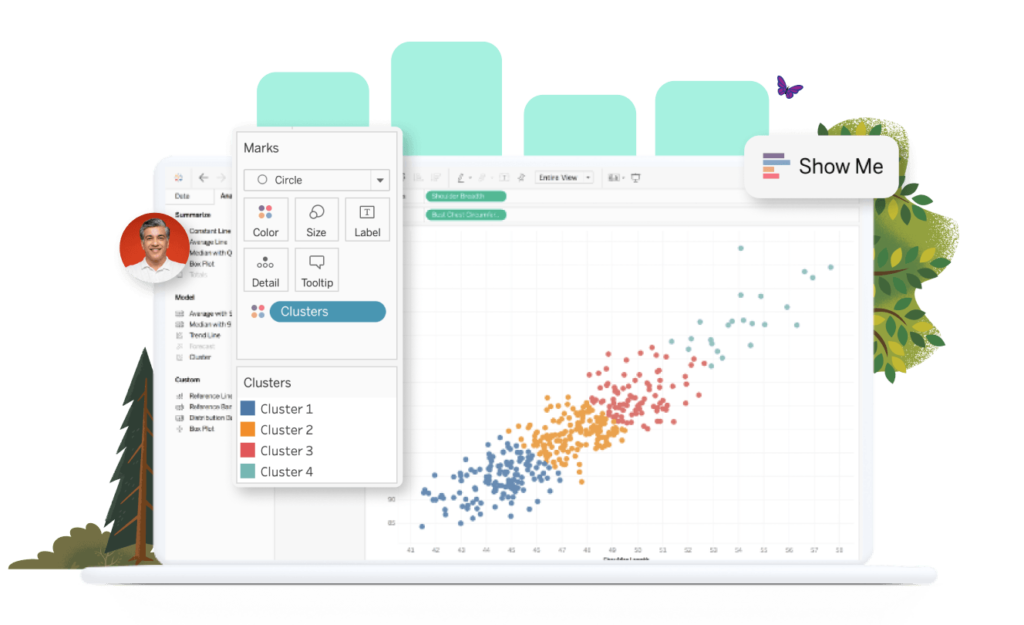
Tableau is a leading data visualization tool widely recognized for its powerful and interactive visual analytics capabilities.
It allows users to create compelling dashboards and gain insights from their data effortlessly.
Here’s an in-depth look at Tableau, its features, benefits, and use cases.
Overview of Tableau
- Introduction:
- Developed by Tableau Software, Tableau is a comprehensive data visualization and business intelligence tool.
- It was founded in 2003 and has since grown to be a top choice for data professionals globally.
- Purpose:
- Designed to help people see and understand data.
- Enables users to transform data into actionable insights through interactive dashboards and visualizations.
Key Features and Benefits
- User-Friendly Interface:
- Drag-and-drop functionality allows users to create visualizations without needing to write code.
- Intuitive design makes it accessible for both technical and non-technical users.
- Data Connectivity:
- Connects to various data sources including databases (SQL, Oracle), cloud services (AWS, Google Cloud), and spreadsheets (Excel).
- Offers live data connection and in-memory data extraction for faster performance.
- Interactive Dashboards:
- Create interactive dashboards that provide a comprehensive view of your data.
- Users can drill down into data points, apply filters, and interact with visualizations to uncover deeper insights.
- Advanced Analytics:
- Includes advanced analytics capabilities like trend lines, forecasting, and statistical summaries.
- Integrates with R and Python for more sophisticated analytics and machine learning models.
- Data Sharing and Collaboration:
- Share dashboards and visualizations easily with team members and stakeholders.
- Tableau Server and Tableau Online allow for secure, scalable sharing and collaboration.
- Mobile Support:
- Optimized for mobile devices, enabling users to access and interact with dashboards on the go.
- Tableau Mobile app provides seamless access to dashboards from smartphones and tablets.
Use Cases and Industries
- Healthcare:
- Analyzing patient data to improve care delivery and outcomes.
- Example: Hospitals use Tableau to track patient admissions, discharge rates, and treatment effectiveness.
- Finance:
- Financial institutions use Tableau for risk analysis, fraud detection, and performance monitoring.
- Example: Banks leverage Tableau to visualize transaction data and detect suspicious activities.
- Retail:
- Enhancing sales and marketing strategies by analyzing customer behavior and sales trends.
- Example: Retailers use Tableau to track inventory levels, sales performance, and customer demographics.
- Education:
- Universities and schools use Tableau to analyze student performance and operational efficiency.
- Example: Educational institutions use Tableau to visualize enrollment trends, student grades, and resource allocation.
- Government:
- Government agencies use Tableau for public data transparency and operational analysis.
- Example: Municipal governments use Tableau to track and report on public health data, crime statistics, and budget allocations.
Pros and Cons
- Pros:
- Ease of Use: User-friendly interface that doesn’t require extensive technical knowledge.
- Powerful Visualization: Robust visualization capabilities that allow for detailed and interactive data analysis.
- Wide Data Integration: Ability to connect to numerous data sources and handle large data sets.
- Strong Community and Support: Extensive user community, forums, and resources for troubleshooting and learning.
- Cons:
- Cost: Tableau can be expensive, especially for small businesses and startups.
- Performance: May experience performance issues with very large datasets if not optimized properly.
- Customization Limitations: Some advanced customizations may require scripting or third-party tools.
Comparison with Other Tools
- Power BI:
- Tableau offers more advanced data visualization capabilities compared to Power BI, which is more integrated with Microsoft products.
- Tableau generally has a steeper learning curve but provides greater flexibility in creating custom visualizations.
- Google Data Studio:
- Google Data Studio is a free tool, making it more accessible for small businesses.
- Tableau offers more robust features and scalability, suitable for larger organizations with complex data needs.
Pricing and Licensing
- Pricing Models:
- Tableau offers different pricing tiers based on user roles: Creator, Explorer, and Viewer.
- Tableau Public is available for free, while Tableau Desktop and Tableau Server require a subscription or perpetual license.
- Enterprise Licensing:
- Tailored pricing plans for large organizations based on the number of users and specific requirements.
- Example: Large enterprises often negotiate custom licensing agreements to accommodate multiple departments and extensive data needs.
Summary
Tableau stands out as a powerful data visualization tool that enables users to transform raw data into meaningful insights through interactive and engaging visualizations.
Its user-friendly interface, extensive data connectivity, and advanced analytics capabilities make it a preferred choice for various industries.
While it may come at a higher cost, the value it provides in terms of data-driven decision-making and operational efficiency is substantial.
By leveraging Tableau, organizations can unlock the full potential of their data, driving better outcomes and strategic growth in 2024 and beyond.
2. Power BI
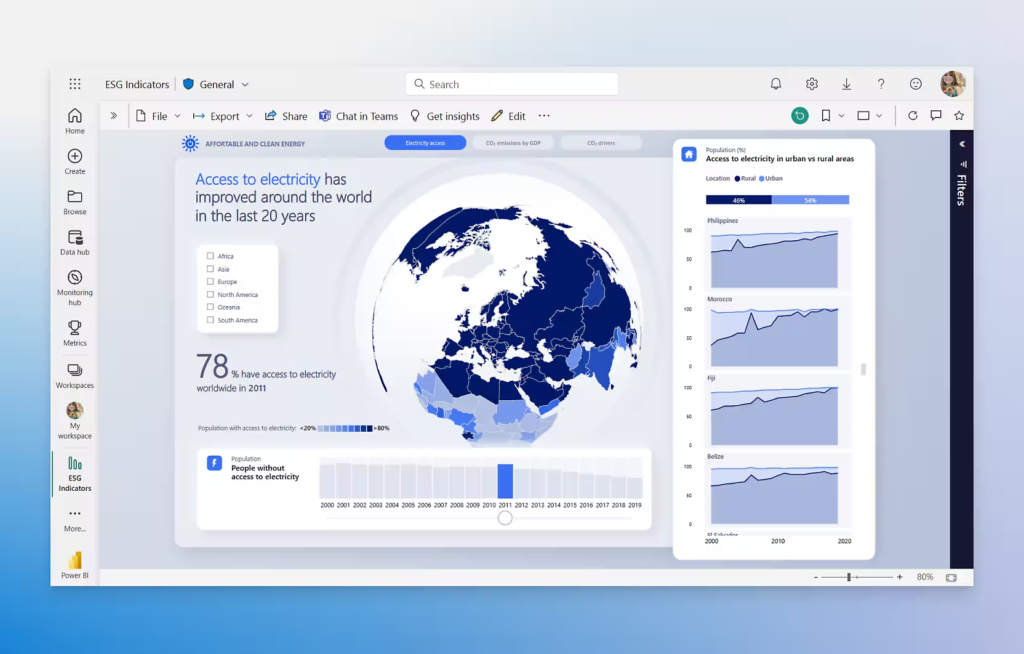
Power BI is a business analytics service by Microsoft that provides interactive visualizations and business intelligence capabilities with an interface simple enough for end users to create their own reports and dashboards.
It integrates seamlessly with other Microsoft products and services, making it a popular choice among organizations that are part of the Microsoft ecosystem.
Here’s an in-depth look at Power BI, its features, benefits, and use cases.
Overview of Power BI
- Introduction:
- Developed by Microsoft, Power BI is a robust business analytics tool designed to deliver insights from data through interactive reports and dashboards.
- Launched in 2013, Power BI has quickly become a leading tool in the data analytics space, favored by businesses of all sizes.
- Purpose:
- To empower users to visualize and share insights from their data.
- Enables data-driven decision-making across organizations by providing powerful data analysis tools.
Key Features and Benefits
- User-Friendly Interface:
- Familiar Microsoft interface that integrates seamlessly with other Microsoft Office products like Excel and SharePoint.
- Drag-and-drop functionality allows users to build reports and dashboards without needing extensive technical skills.
- Data Connectivity:
- Connects to a wide variety of data sources including databases (SQL Server, Oracle), cloud services (Azure, Google Analytics), and web-based data.
- Offers pre-built connectors and custom data connectors for versatile data integration.
- Interactive Dashboards and Reports:
- Create visually appealing and interactive dashboards that can be customized to meet specific business needs.
- Users can drill down into data, apply filters, and interact with visual elements to uncover deeper insights.
- Real-Time Data:
- Provides real-time data access and monitoring, enabling timely decision-making.
- Example: Retail chains use Power BI to monitor real-time sales data across multiple locations, allowing for immediate action on trends and issues.
- Integration with Microsoft Ecosystem:
- Seamless integration with Microsoft Azure, SQL Server, Excel, and other Microsoft products enhances functionality and ease of use.
- Example: Financial analysts can import Excel data directly into Power BI, leveraging familiar tools for advanced data analysis.
- Advanced Analytics:
- Built-in AI and machine learning capabilities enable advanced data analysis, including predictive analytics.
- Integrates with R and Python for custom analytics and visualization.
- Collaboration and Sharing:
- Share reports and dashboards securely within the organization and with external stakeholders.
- Power BI Service allows for collaborative workspaces and sharing of insights across teams.
- Mobile Accessibility:
- Power BI Mobile app ensures access to reports and dashboards on the go, supporting iOS and Android devices.
- Example: Sales teams use the Power BI Mobile app to access up-to-date sales figures and performance metrics while in the field.
Use Cases and Industries
- Healthcare:
- Analyzing patient data, managing resources, and improving healthcare delivery.
- Example: Hospitals use Power BI to track patient admissions, discharge rates, and treatment outcomes, enhancing patient care and operational efficiency.
- Finance:
- Financial planning, risk analysis, and performance monitoring.
- Example: Banks and financial institutions use Power BI to monitor financial performance, detect fraud, and manage risk effectively.
- Retail:
- Sales analysis, inventory management, and customer insights.
- Example: Retail companies leverage Power BI to analyze sales data, optimize inventory, and understand customer behavior to improve sales strategies.
- Education:
- Tracking student performance, enrollment trends, and resource allocation.
- Example: Educational institutions use Power BI to visualize student performance data, manage resources, and improve educational outcomes.
- Government:
- Public data transparency, budget analysis, and operational efficiency.
- Example: Government agencies use Power BI to analyze budget data, monitor public projects, and improve service delivery.
Pros and Cons
- Pros:
- Ease of Use: Familiar interface and seamless integration with Microsoft products make it user-friendly.
- Robust Data Integration: Extensive connectivity options for a wide range of data sources.
- Real-Time Insights: Ability to process and analyze data in real-time.
- Strong Community and Support: Large user community and extensive support resources available.
- Cons:
- Cost: Premium features and larger data capacities can be expensive for small businesses.
- Complexity for Advanced Users: While easy for beginners, advanced users may find some features less customizable compared to other tools.
- Limited to Microsoft Ecosystem: Best utilized within a Microsoft-centric environment, which may limit flexibility for organizations using diverse technology stacks.
Comparison with Other Tools
- Tableau:
- Tableau offers more advanced and customizable visualization options compared to Power BI.
- Power BI excels in its integration with Microsoft products and real-time data capabilities, whereas Tableau is known for its powerful data visualization and exploration features.
- Google Data Studio:
- Google Data Studio is a free tool with strong data connectivity to Google products.
- Power BI provides more advanced analytics capabilities and better integration with enterprise-level data sources.
Pricing and Licensing
- Pricing Models:
- Power BI offers different pricing plans: Power BI Free, Power BI Pro, and Power BI Premium.
- Power BI Pro is subscription-based and provides enhanced sharing and collaboration features.
- Power BI Premium offers advanced features, dedicated cloud capacity, and on-premises reporting capabilities.
- Enterprise Licensing:
- Tailored pricing plans for large organizations based on user roles and data capacity requirements.
- Example: Large enterprises often opt for Power BI Premium to benefit from advanced features and dedicated resources.
Summary
Power BI is a versatile and powerful business analytics tool that excels in integrating with Microsoft products and providing real-time data insights.
Its user-friendly interface, extensive data connectivity, and advanced analytics capabilities make it a preferred choice for various industries.
While it may have limitations for non-Microsoft environments, its strengths in ease of use, real-time data processing, and robust collaboration features offer substantial value.
By leveraging Power BI, organizations can transform data into actionable insights, driving informed decision-making and achieving strategic goals in 2024 and beyond.
3. Google Data Studio
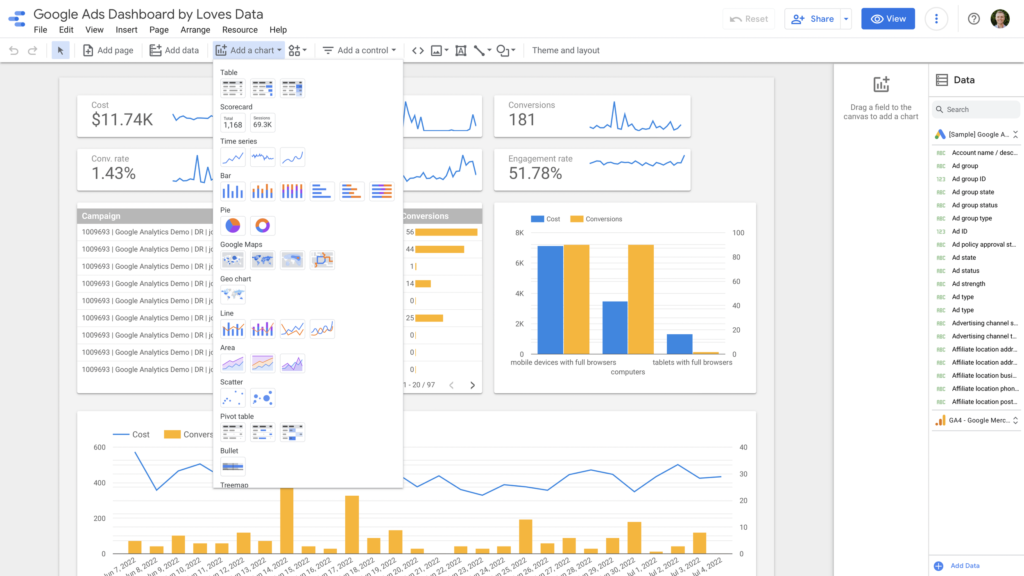
Google Data Studio is a free, web-based data visualization tool developed by Google.
It allows users to create dynamic, customizable reports and dashboards that are easy to share and collaborate on.
Its integration with various Google services and other data sources makes it an accessible and powerful tool for individuals and businesses alike.
Here’s an in-depth look at Google Data Studio, its features, benefits, and use cases.
Overview of Google Data Studio
- Introduction:
- Launched by Google, Google Data Studio is part of the Google Marketing Platform.
- Designed to transform raw data into informative, easy-to-read, and shareable reports.
- Purpose:
- To help users visualize data from multiple sources in an intuitive and interactive way.
- Enables data-driven decision-making through accessible and collaborative reporting.
Key Features and Benefits
- User-Friendly Interface:
- Drag-and-drop functionality allows users to easily create and customize reports without coding.
- Simple, intuitive design makes it accessible for users of all skill levels.
- Data Connectivity:
- Connects to a wide range of data sources, including Google Analytics, Google Ads, Google Sheets, BigQuery, and more.
- Supports third-party connectors for integrating data from other platforms like Facebook, Twitter, and SQL databases.
- Customizable Reports and Dashboards:
- Create highly customizable reports with a variety of charts, graphs, and widgets.
- Example: Marketing teams use Data Studio to create detailed performance dashboards tracking metrics like website traffic, conversion rates, and ad campaign effectiveness.
- Real-Time Data:
- Automatically updates data in real-time, ensuring reports reflect the most current information.
- Example: E-commerce businesses use real-time dashboards to monitor sales performance, inventory levels, and customer behavior.
- Interactive Elements:
- Add interactive elements such as date range filters, data controls, and drill-down options to reports.
- Example: Sales teams can use interactive reports to filter data by region, product category, and time period for more detailed analysis.
- Collaboration and Sharing:
- Share reports easily with team members and stakeholders through links or embedding.
- Real-time collaboration features allow multiple users to work on the same report simultaneously.
- Example: Project managers use shared dashboards to provide real-time project updates to stakeholders and team members.
- Templates and Customization:
- Offers a wide range of templates to help users get started quickly.
- Customizable themes and layouts enable users to tailor reports to their branding and design preferences.
Use Cases and Industries
- Marketing and Advertising:
- Tracking campaign performance, website analytics, and ad spend.
- Example: Digital marketing agencies use Data Studio to create comprehensive client reports, integrating data from Google Ads, Analytics, and social media platforms.
- E-commerce:
- Monitoring sales data, inventory levels, and customer behavior.
- Example: Online retailers use Data Studio to visualize sales trends, track top-selling products, and analyze customer purchase patterns.
- Finance:
- Financial reporting, budgeting, and performance analysis.
- Example: Financial analysts use Data Studio to create dashboards that track key financial metrics, such as revenue, expenses, and profit margins.
- Education:
- Analyzing student performance, enrollment trends, and resource utilization.
- Example: Universities use Data Studio to visualize student data, track academic performance, and monitor resource allocation.
- Healthcare:
- Tracking patient data, treatment outcomes, and operational efficiency.
- Example: Healthcare providers use Data Studio to monitor patient admissions, discharge rates, and treatment success metrics.
Pros and Cons
- Pros:
- Free to Use: Google Data Studio is completely free, making it accessible for businesses of all sizes.
- Easy Integration: Seamless integration with Google services and other data sources.
- User-Friendly: Intuitive interface and drag-and-drop functionality make it easy to use.
- Real-Time Collaboration: Real-time data updates and collaboration features enhance team productivity.
- Cons:
- Limited Advanced Features: Lacks some of the advanced analytics and visualization capabilities found in paid tools like Tableau and Power BI.
- Performance with Large Data Sets: May experience performance issues with very large data sets.
- Customization Limitations: While highly customizable, some advanced customizations may require additional coding or third-party tools.
Comparison with Other Tools
- Tableau:
- Tableau offers more advanced data visualization capabilities and is suitable for complex data analysis.
- Google Data Studio is easier to use and integrates seamlessly with Google products, making it ideal for smaller projects and teams.
- Power BI:
- Power BI provides more robust analytics features and better integration with Microsoft products.
- Google Data Studio is free and excels in real-time collaboration and ease of use, particularly for Google ecosystem users.
Pricing and Licensing
- Pricing Models:
- Google Data Studio is free to use for individuals and businesses.
- No licensing fees or subscription costs, making it a cost-effective solution for data visualization needs.
- Enterprise Licensing:
- While Data Studio itself is free, integrating with paid Google services (like BigQuery) may incur additional costs.
- Example: Large enterprises using Google Cloud Platform services can leverage Data Studio without incurring extra costs for the tool itself.
Summary
Google Data Studio stands out as a powerful, user-friendly, and free data visualization tool.
Its seamless integration with Google services and other data sources, coupled with its real-time collaboration and customization capabilities, make it an excellent choice for individuals and businesses looking to visualize their data effectively.
While it may lack some of the advanced features found in premium tools like Tableau and Power BI, its accessibility and ease of use offer substantial value.
By leveraging Google Data Studio, organizations can transform data into actionable insights, driving better decision-making and achieving strategic goals in 2024 and beyond.
4. Apache Spark

Apache Spark is an open-source unified analytics engine for large-scale data processing.
Known for its speed and ease of use, Spark provides an interface for programming entire clusters with implicit data parallelism and fault tolerance.
It’s a powerful tool for big data processing and analytics, capable of handling large datasets quickly and efficiently. Here’s an in-depth look at Apache Spark, its features, benefits, and use cases.
Overview of Apache Spark
- Introduction:
- Developed by the Apache Software Foundation, Apache Spark is designed to handle big data processing and analytics.
- Spark was initially developed at UC Berkeley’s AMPLab and has since become a leading tool for big data analytics.
- Purpose:
- To provide a fast, flexible, and general-purpose cluster-computing framework.
- Enables users to process large datasets quickly and efficiently, performing both batch and streaming analytics.
Key Features and Benefits
- Speed:
- In-memory processing significantly speeds up data processing tasks.
- Example: Spark can run workloads up to 100 times faster than Hadoop MapReduce for certain applications by leveraging in-memory computing.
- Ease of Use:
- Provides high-level APIs in Java, Scala, Python, and R, making it accessible to developers with different programming backgrounds.
- Includes a rich set of built-in libraries for SQL, streaming, machine learning, and graph processing.
- Unified Analytics Engine:
- Integrates seamlessly with various data sources and provides tools for different analytics needs, from batch processing to real-time analytics.
- Example: Companies use Spark to perform ETL (Extract, Transform, Load) operations, interactive queries, and advanced analytics.
- Scalability:
- Designed to scale from a single server to thousands of machines, offering resilience and fault tolerance.
- Example: Enterprises use Spark to process petabytes of data across large clusters in cloud environments.
- Advanced Analytics:
- Includes libraries for machine learning (MLlib), graph processing (GraphX), and streaming analytics (Spark Streaming).
- Example: Data scientists use MLlib to build and deploy machine learning models on large datasets efficiently.
Use Cases and Industries
- Finance:
- Fraud detection, risk management, and real-time transaction analysis.
- Example: Financial institutions use Spark to analyze real-time transaction data for detecting fraudulent activities and managing risks.
- Healthcare:
- Genomic data processing, patient data analysis, and predictive analytics.
- Example: Healthcare providers use Spark to process and analyze large volumes of genomic data to understand genetic variations and disease patterns.
- E-commerce:
- Customer segmentation, recommendation engines, and inventory management.
- Example: E-commerce companies use Spark to build recommendation systems that analyze customer behavior and suggest relevant products.
- Telecommunications:
- Network optimization, real-time call data record analysis, and customer churn prediction.
- Example: Telecom companies use Spark to analyze network data in real-time to optimize performance and predict customer churn.
- Technology:
- Log analysis, monitoring systems, and big data processing.
- Example: Tech companies use Spark to process and analyze logs from various applications, providing insights into system performance and user behavior.
Pros and Cons
- Pros:
- High Performance: In-memory processing and optimized execution plan ensure fast data processing.
- Versatile: Supports a wide range of applications from batch processing to real-time analytics.
- Scalable: Easily scales from small setups to large clusters with thousands of nodes.
- Rich Ecosystem: Extensive libraries and integrations with other big data tools and frameworks.
- Cons:
- Complexity: May have a steep learning curve for beginners, especially those unfamiliar with big data frameworks.
- Resource Intensive: In-memory processing can be resource-intensive, requiring significant memory and CPU resources.
- Maintenance: Managing and maintaining large Spark clusters can be challenging.
Comparison with Other Tools
- Hadoop MapReduce:
- Spark is significantly faster than Hadoop MapReduce due to in-memory processing.
- While Hadoop is more mature and has a broader ecosystem, Spark is preferred for its performance and ease of use.
- Flink:
- Both Spark and Flink are used for stream processing, but Flink is designed with streaming as its core abstraction, providing more advanced stream processing capabilities.
- Spark is more versatile, offering a unified engine for batch and stream processing.
Pricing and Licensing
- Open Source:
- Apache Spark is open-source and free to use, making it accessible to organizations of all sizes.
- Supported by a large community, offering extensive resources and support.
- Cloud Integration:
- Available on various cloud platforms such as Amazon Web Services (AWS), Microsoft Azure, and Google Cloud Platform (GCP), often with managed services like AWS EMR, Azure HDInsight, and Google Dataproc.
- Example: Enterprises leverage cloud-based Spark services to manage and process big data workloads without maintaining infrastructure.
Summary
Apache Spark stands out as a powerful and versatile tool for big data processing and analytics. Its speed, scalability, and comprehensive analytics capabilities make it an invaluable asset for organizations dealing with large datasets.
From finance to healthcare, Spark is used across various industries to drive data-driven decision-making and innovation.
While it may have a steeper learning curve and higher resource demands, its benefits in performance and flexibility offer substantial value.
By leveraging Apache Spark, organizations can unlock the full potential of their data, driving better outcomes and strategic growth in 2024 and beyond.
5. SAS
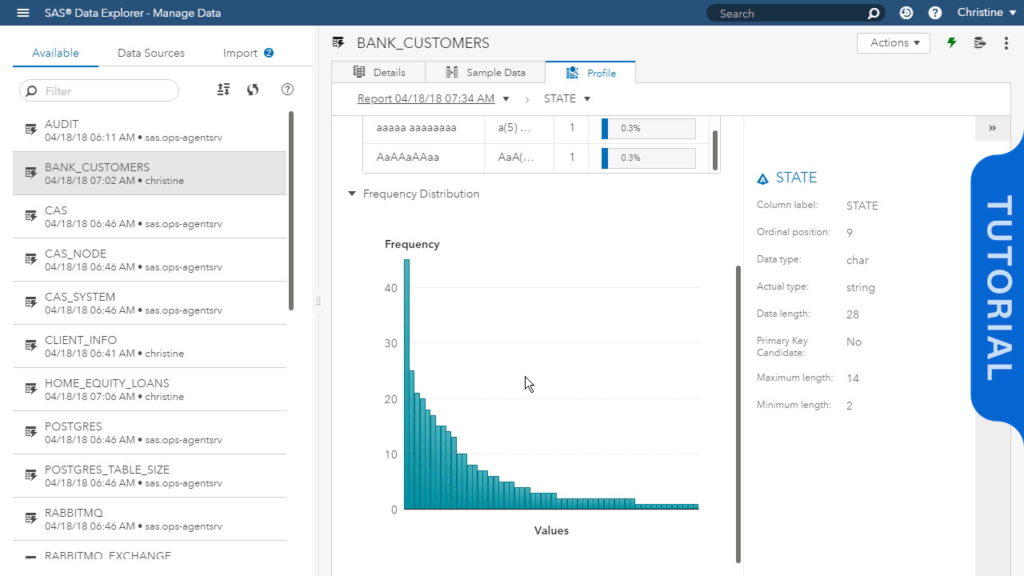
SAS (Statistical Analysis System) is a powerful analytics platform widely used for data management, advanced analytics, multivariate analysis, business intelligence, and predictive analytics.
Developed by SAS Institute, SAS is known for its robust capabilities in handling large datasets, sophisticated statistical analysis, and user-friendly interfaces for both programmers and business users.
Here’s an in-depth look at SAS, its features, benefits, and use cases.
Overview of SAS
- Introduction:
- Developed by SAS Institute, SAS has been a leader in analytics software and services since its inception in 1976.
- Designed to provide comprehensive data analytics solutions for a wide range of industries.
- Purpose:
- To enable users to manage, analyze, and visualize data, supporting data-driven decision-making.
- Offers a suite of tools for statistical analysis, data mining, predictive modeling, and business intelligence.
Key Features and Benefits
- Data Management:
- Comprehensive data integration, cleansing, and transformation capabilities.
- Example: SAS Data Management helps organizations prepare and manage data from various sources, ensuring data quality and consistency.
- Advanced Analytics:
- Sophisticated statistical analysis, predictive modeling, and machine learning capabilities.
- Example: SAS Advanced Analytics allows data scientists to build and deploy predictive models for applications like fraud detection, customer segmentation, and risk management.
- Business Intelligence:
- Tools for reporting, dashboards, and data visualization that provide actionable insights.
- Example: SAS Visual Analytics enables users to create interactive reports and dashboards, facilitating data exploration and decision-making.
- Scalability and Performance:
- Handles large datasets efficiently, supporting both single-machine and distributed computing environments.
- Example: SAS High-Performance Analytics leverages in-memory processing to accelerate complex analytical tasks.
- User-Friendly Interfaces:
- Provides graphical interfaces for non-programmers and robust programming environments for technical users.
- Example: SAS Enterprise Guide offers a point-and-click interface for data analysis and visualization, while SAS Studio provides a web-based programming environment.
- Integration and Compatibility:
- Integrates with various data sources, platforms, and programming languages, enhancing flexibility.
- Example: SAS can integrate with Hadoop, SQL databases, and cloud platforms like AWS and Azure.
Use Cases and Industries
- Healthcare:
- Analyzing patient data, improving clinical outcomes, and managing healthcare costs.
- Example: Hospitals use SAS to analyze patient records, identify trends in patient care, and optimize resource allocation.
- Finance:
- Risk management, fraud detection, and financial forecasting.
- Example: Banks use SAS for credit scoring, fraud detection, and regulatory compliance, helping to mitigate risks and enhance decision-making.
- Retail:
- Customer analytics, inventory management, and sales forecasting.
- Example: Retailers use SAS to analyze customer purchase behavior, optimize inventory levels, and predict sales trends.
- Manufacturing:
- Quality control, supply chain optimization, and predictive maintenance.
- Example: Manufacturing companies use SAS to monitor production processes, predict equipment failures, and optimize supply chains.
- Government:
- Public policy analysis, program evaluation, and operational efficiency.
- Example: Government agencies use SAS to analyze social programs, assess policy impacts, and improve service delivery.
Pros and Cons
- Pros:
- Comprehensive Analytics: Extensive tools for data management, statistical analysis, and predictive modeling.
- High Performance: Efficiently handles large datasets and complex analytical tasks.
- User-Friendly: Intuitive interfaces for non-technical users and powerful programming environments for technical users.
- Scalable: Supports both small-scale and enterprise-level applications.
- Cons:
- Cost: SAS can be expensive, especially for small businesses and startups.
- Learning Curve: May require significant training for new users to fully leverage its capabilities.
- Proprietary: As a proprietary tool, it may not offer the same flexibility as open-source alternatives.
Comparison with Other Tools
- R and Python:
- R and Python are popular open-source alternatives for statistical analysis and machine learning.
- SAS offers more comprehensive support and integrated tools, but R and Python are more flexible and cost-effective for many users.
- Tableau:
- Tableau excels in data visualization and interactive dashboards.
- SAS provides more advanced statistical analysis and predictive modeling capabilities, making it a better choice for complex analytical tasks.
- Power BI:
- Power BI is highly integrated with Microsoft products and excels in business intelligence and data visualization.
- SAS offers more advanced analytics and data management capabilities, making it suitable for large-scale and complex data analysis.
Pricing and Licensing
- Pricing Models:
- SAS offers various licensing options, including on-premise software, cloud-based solutions, and enterprise agreements.
- Pricing can vary significantly based on the number of users, modules, and deployment options.
- Enterprise Licensing:
- Tailored pricing plans for large organizations based on specific needs and usage.
- Example: Large enterprises often negotiate custom agreements to access a full suite of SAS tools and services.
Summary
SAS is a powerful and versatile analytics platform that excels in data management, advanced analytics, and business intelligence.
Its robust capabilities, user-friendly interfaces, and scalability make it a preferred choice for organizations across various industries.
While it may come at a higher cost and have a steeper learning curve, the value it provides in terms of comprehensive analytics and data-driven decision-making is substantial.
By leveraging SAS, organizations can unlock the full potential of their data, driving better outcomes and strategic growth in 2024 and beyond.
Why Data Analytics Tools Matter
Data analytics tools have become indispensable in today’s data-driven world.
They help businesses make sense of vast amounts of data, driving smarter decisions and optimizing performance across various domains.
Here’s why data analytics tools matter:
Enhanced Decision-Making
- Informed Choices:
- Data analytics tools provide actionable insights that guide strategic decisions.
- Example: Retailers can analyze customer purchase patterns to optimize inventory management.
- Real-Time Analysis:
- These tools enable real-time data processing, allowing businesses to react promptly to market changes.
- Example: Financial institutions use real-time analytics to detect fraudulent transactions instantly.
Improved Operational Efficiency
- Process Optimization:
- By analyzing workflow data, businesses can identify bottlenecks and inefficiencies.
- Example: Manufacturing companies can use analytics to streamline production processes, reducing downtime and costs.
- Resource Management:
- Analytics tools help in optimal allocation and utilization of resources.
- Example: Energy companies use data analytics to forecast demand and manage supply efficiently.
Enhanced Customer Insights
- Personalized Marketing:
- Data analytics allows for the segmentation of customers and personalization of marketing efforts.
- Example: E-commerce platforms use customer behavior data to recommend products, increasing sales and customer satisfaction.
- Customer Retention:
- Understanding customer preferences and pain points helps in creating better retention strategies.
- Example: Telecom companies analyze usage patterns to offer personalized plans, reducing churn rates.
Competitive Advantage
- Market Trends Analysis:
- Businesses can stay ahead by identifying and capitalizing on market trends early.
- Example: Fashion retailers analyze social media trends to predict and respond to emerging styles.
- Benchmarking:
- Analytics tools enable companies to benchmark their performance against competitors.
- Example: Software firms use data analytics to compare their product features and performance with market leaders.
Predictive Analytics
- Forecasting:
- Predictive models help in forecasting future trends and behaviors.
- Example: Airlines use predictive analytics to forecast flight demand and adjust pricing strategies.
- Risk Management:
- Identifying potential risks before they become problems.
- Example: Insurance companies use predictive analytics to assess the risk profiles of policyholders and set premiums accordingly.
Cost Reduction
- Efficiency Gains:
- Identifying cost-saving opportunities through data analysis.
- Example: Logistics companies analyze route data to minimize fuel consumption and optimize delivery routes.
- Waste Reduction:
- Analytics can pinpoint areas where resources are being wasted.
- Example: Restaurants use inventory analytics to reduce food waste by better predicting sales and adjusting orders.
Innovation and Product Development
- Data-Driven Innovation:
- Insights from data analytics can fuel innovation and new product development.
- Example: Tech companies use user data to develop features that meet actual user needs and preferences.
- Product Enhancement:
- Continuous feedback from data helps in refining and improving products.
- Example: Mobile app developers analyze user interaction data to improve app design and functionality.
Compliance and Security
- Regulatory Compliance:
- Ensuring that business practices comply with relevant regulations through comprehensive data tracking.
- Example: Healthcare providers use data analytics to maintain compliance with health data regulations like HIPAA.
- Data Security:
- Monitoring and securing data through advanced analytics.
- Example: Cybersecurity firms use data analytics to detect and respond to security breaches in real-time.
Data analytics tools are vital for unlocking the full potential of data in the modern business landscape.
They enhance decision-making, improve operational efficiency, provide deeper customer insights, offer competitive advantages, enable predictive analytics, reduce costs, foster innovation, and ensure compliance and security.
By leveraging these tools, businesses can transform data into valuable insights, driving growth and success in 2024 and beyond.
Criteria for Selecting the Best Data Analytics Tools
Choosing the right data analytics tool is crucial for leveraging the full potential of your data.
With numerous options available, it’s essential to consider several key criteria to ensure the tool aligns with your business needs and objectives.
Here’s a comprehensive guide on the criteria for selecting the best data analytics tools:
User-Friendliness
- Intuitive Interface:
- Look for tools with a user-friendly interface that allows non-technical users to navigate and use the tool effectively.
- Example: Tableau offers a drag-and-drop interface that makes it easy for users to create visualizations without coding.
- Learning Curve:
- Consider the learning curve associated with the tool. Opt for tools that provide comprehensive tutorials, documentation, and support.
- Example: Google Data Studio provides extensive online resources and tutorials to help users get started quickly.
Integration Capabilities
- Data Source Compatibility:
- Ensure the tool can integrate with various data sources such as databases, cloud services, and APIs.
- Example: Power BI supports integration with a wide range of data sources, including Excel, SQL Server, and cloud-based databases like Azure.
- Third-Party Integration:
- The ability to integrate with other third-party applications and tools can enhance the functionality of the data analytics tool.
- Example: SAS integrates with various third-party applications like Salesforce, Hadoop, and R for extended analytics capabilities.
Scalability
- Handling Large Data Sets:
- Choose tools that can efficiently handle large volumes of data without compromising performance.
- Example: Apache Spark is designed to process large-scale data across distributed computing environments, making it highly scalable.
- Future Growth:
- Consider whether the tool can scale with your business as your data needs grow.
- Example: Power BI offers scalable solutions from individual users to large enterprises, accommodating growing data needs.
Cost-Effectiveness
- Pricing Models:
- Evaluate the pricing model of the tool to ensure it fits within your budget. Consider whether it offers a subscription-based model, pay-as-you-go, or a one-time license fee.
- Example: Google Data Studio is a free tool, making it a cost-effective option for small businesses and startups.
- Value for Money:
- Assess the value provided by the tool in relation to its cost. Consider the features, support, and overall benefits.
- Example: Tableau, despite its higher cost, offers extensive visualization capabilities and a strong support community, providing good value for money.
Support and Community
- Customer Support:
- Reliable customer support is essential for addressing any issues or queries. Check if the tool offers comprehensive customer support, including live chat, phone support, and email.
- Example: SAS provides extensive customer support, including 24/7 technical assistance and a dedicated support portal.
- Community and Resources:
- A strong user community and readily available resources can be invaluable for troubleshooting and learning.
- Example: Power BI has a large, active user community and a wealth of online resources, including forums, tutorials, and user groups.
Analytical Capabilities
- Advanced Analytics:
- Look for tools that offer advanced analytics capabilities such as predictive analytics, machine learning, and AI.
- Example: SAS is renowned for its advanced statistical and predictive analytics capabilities, catering to complex data analysis needs.
- Data Visualization:
- Effective data visualization is crucial for interpreting and communicating insights. Ensure the tool offers robust visualization features.
- Example: Tableau excels in data visualization, allowing users to create interactive and shareable dashboards easily.
Data Security and Compliance
- Security Features:
- Data security is paramount. Choose tools that offer robust security features, including encryption, access controls, and secure data storage.
- Example: Power BI provides enterprise-grade security features, including data encryption and real-time access monitoring.
- Compliance:
- Ensure the tool complies with relevant industry standards and regulations, such as GDPR, HIPAA, or CCPA.
- Example: Google Data Studio adheres to GDPR standards, ensuring data privacy and protection for users in the European Union.
Customization and Flexibility
- Customization Options:
- The ability to customize dashboards, reports, and analytics processes to fit specific business needs is essential.
- Example: Tableau allows users to customize dashboards extensively, tailoring them to specific business requirements.
- Flexibility:
- Flexibility in terms of deployment (cloud-based, on-premise, or hybrid) and adaptability to different use cases.
- Example: Apache Spark can be deployed in various environments, offering flexibility for different organizational needs.
Selecting the best data analytics tool involves evaluating multiple criteria to ensure it aligns with your business needs, budget, and technical requirements.
By considering factors such as user-friendliness, integration capabilities, scalability, cost-effectiveness, support, analytical capabilities, security, compliance, customization, and flexibility, you can make an informed decision.
The right tool will empower your organization to harness the power of data, drive informed decision-making, and achieve strategic objectives in 2024 and beyond.
Conclusion
In 2024, the landscape of data analytics is continually evolving, driven by the need for organizations to harness data for actionable insights and strategic decision-making.
As we navigate through this dynamic era of digital transformation, selecting the right tools for data analytics becomes crucial.
The top five tools highlighted in this guide—Tableau, Power BI, Google Data Studio, Apache Spark, and SAS—stand out for their unique capabilities, versatility, and impact across industries.
Recap of Key Insights
- Tableau offers powerful visualization capabilities and ease of use, making it ideal for creating interactive dashboards and reports that drive data-driven decisions.
- Power BI, integrated with the Microsoft ecosystem, excels in data connectivity, real-time analytics, and collaborative features, empowering organizations to extract actionable insights from their data swiftly.
- Google Data Studio, being free and cloud-based, provides accessibility and ease of use, enabling users to create customizable reports and dashboards that leverage data from various sources, including Google services.
- Apache Spark stands out for its speed and scalability in processing large datasets, supporting both batch and real-time analytics with advanced machine learning and streaming capabilities.
- SAS (Statistical Analysis System) offers comprehensive tools for data management, advanced analytics, and predictive modeling, catering to industries requiring robust statistical analysis and business intelligence.
Strategic Considerations for 2024
As organizations look to optimize their data analytics capabilities in 2024, several strategic considerations emerge:
- Business Objectives: Aligning data analytics initiatives with overarching business goals ensures that analytics efforts contribute directly to organizational success.
- Data Integration: Choosing tools that seamlessly integrate with existing data sources and platforms streamlines data management and enhances analytics effectiveness.
- Scalability and Performance: Scalable tools like Apache Spark and Power BI Premium ensure that analytics solutions can grow with the organization’s data needs while maintaining performance standards.
- User Accessibility: Prioritizing tools with intuitive interfaces and user-friendly features facilitates adoption across teams, empowering more stakeholders to leverage data insights effectively.
Future Trends and Innovations
Looking ahead, the future of data analytics will likely be shaped by emerging technologies such as artificial intelligence (AI) and machine learning (ML), which will further enhance predictive analytics capabilities and automate decision-making processes.
Tools that can integrate seamlessly with AI and ML frameworks will gain prominence in driving innovation and competitive advantage.
Making the Right Choice
Ultimately, the choice of data analytics tools in 2024 hinges on the specific needs and objectives of each organization.
Whether prioritizing visualization and ease of use with Tableau and Power BI, leveraging the scalability and real-time capabilities of Apache Spark, harnessing the accessibility and integration advantages of Google Data Studio, or opting for the comprehensive analytics suite of SAS, each tool offers unique strengths to support diverse analytics requirements.
In conclusion, the top five tools for data analytics in 2024—Tableau, Power BI, Google Data Studio, Apache Spark, and SAS—provide robust solutions to harness the power of data effectively.
By leveraging these tools strategically, organizations can unlock valuable insights, improve decision-making processes, and drive innovation across all facets of their operations.
As technology continues to evolve, staying informed about the latest advancements in data analytics tools will be essential for staying competitive and achieving sustained growth in the digital age.
Explore, evaluate, and implement these tools to propel your organization towards data-driven success in 2024 and beyond.
Embrace the power of data analytics to transform challenges into opportunities and navigate the future with confidence.
If your company needs HR, hiring, or corporate services, you can use 9cv9 hiring and recruitment services. Book a consultation slot here, or send over an email to [email protected].
If you find this article useful, why not share it with your hiring manager and C-level suite friends and also leave a nice comment below?
We, at the 9cv9 Research Team, strive to bring the latest and most meaningful data, guides, and statistics to your doorstep.
To get access to top-quality guides, click over to 9cv9 Blog.
People Also Ask
What are the top 5 tools for data analytics in 2024?
Discover the best tools: Tableau, Power BI, Google Data Studio, Apache Spark, and SAS.
How does Tableau benefit data analytics?
Tableau excels in visual analytics, offering intuitive dashboards and robust data visualization capabilities.
What are the key features of Power BI?
Power BI offers real-time analytics, interactive dashboards, and seamless integration with Microsoft products.
How can Google Data Studio enhance data reporting?
Google Data Studio enables easy creation of customizable reports and dashboards using data from diverse sources.
What makes Apache Spark suitable for big data analytics?
Apache Spark handles large datasets with speed, supports both batch and real-time processing, and integrates advanced analytics.
Why choose SAS for statistical analysis?
SAS provides comprehensive tools for data management, advanced analytics, and predictive modeling, crucial for in-depth statistical analysis.
How does Tableau compare to Power BI?
Tableau focuses on visualization and ease of use, while Power BI emphasizes integration with Microsoft ecosystem and real-time analytics.
What industries benefit most from Google Data Studio?
Industries like digital marketing, e-commerce, and education leverage Google Data Studio for its user-friendly reporting and integration capabilities.
What are the scalability advantages of Apache Spark?
Apache Spark scales efficiently from single machines to large clusters, handling diverse data processing needs with speed and resilience.
How does SAS support predictive analytics?
SAS offers robust predictive modeling capabilities, enabling organizations to forecast trends, detect patterns, and optimize decision-making.
Is Tableau suitable for non-technical users?
Yes, Tableau’s intuitive interface allows non-technical users to create insightful visualizations and reports without coding.
How can Power BI enhance collaboration in organizations?
Power BI facilitates collaborative analytics through shared dashboards, real-time data updates, and integration with Microsoft Teams.
What are the cost considerations for Google Data Studio?
Google Data Studio is free to use, making it an economical choice for businesses looking to enhance their data reporting capabilities.
How does Apache Spark handle real-time data processing?
Apache Spark’s streaming analytics capabilities allow organizations to process and analyze data in real-time, crucial for dynamic environments.
What are the advantages of using SAS for regulatory compliance?
SAS provides tools for data governance, auditing, and compliance reporting, supporting organizations in meeting regulatory requirements.
Can Tableau integrate with cloud platforms?
Yes, Tableau offers cloud-based solutions that integrate with platforms like AWS and Azure, enabling scalable and accessible analytics.
How does Power BI support mobile analytics?
Power BI offers mobile apps for iOS, Android, and Windows devices, ensuring users can access insights anytime, anywhere.
What are the customization options in Google Data Studio?
Google Data Studio allows users to customize reports with branding, interactive elements, and dynamic data connections for personalized insights.
How does Apache Spark handle machine learning tasks?
Apache Spark’s MLlib library supports scalable machine learning tasks, enabling data scientists to build and deploy models efficiently.
Why choose SAS for healthcare analytics?
SAS provides tools for analyzing patient data, improving clinical outcomes, and optimizing healthcare operations through data-driven insights.
What security features does Tableau offer?
Tableau provides role-based access control, encryption, and data governance features to ensure data security and compliance with privacy regulations.
How does Power BI integrate with Excel?
Power BI integrates seamlessly with Excel, allowing users to import data, create reports, and leverage Excel’s familiar interface for data analysis.
What are the advantages of using Google Data Studio with Google Analytics?
Google Data Studio integrates directly with Google Analytics, enabling marketers to create insightful reports and dashboards based on website data.
How does Apache Spark handle data processing on Hadoop?
Apache Spark can run on Hadoop clusters, leveraging Hadoop’s distributed file system (HDFS) for data storage and processing across nodes.
What are the machine learning capabilities of SAS?
SAS offers advanced machine learning algorithms and models, supporting predictive analytics, anomaly detection, and pattern recognition.
How does Tableau support data storytelling?
Tableau allows users to create compelling narratives with data through interactive visualizations and storytelling features in dashboards and reports.
What are the benefits of using Power BI with Azure?
Power BI integrates seamlessly with Azure services, enabling organizations to leverage cloud-based analytics, AI, and big data processing capabilities.
How can Google Data Studio help in digital marketing?
Google Data Studio enables marketers to visualize and analyze campaign performance, website traffic, and customer engagement metrics from various sources.
How does Apache Spark enhance data processing efficiency?
Apache Spark’s in-memory processing and optimized execution engine improve data processing speed and efficiency compared to traditional batch processing systems.


