Key Takeaways
- Food Traceability Software Market Growth: The global food traceability solutions market is projected to reach USD 28.8 billion in 2026 and USD 64.5 billion by 2035, driven by rising demand for food safety, supply chain transparency, and regulatory compliance.
- AI, Blockchain, and IoT Adoption: Emerging technologies, including blockchain, artificial intelligence (AI), RFID, and IoT-enabled monitoring, are transforming food traceability software by improving real-time tracking, contamination detection, recall management, and supply chain efficiency.
- Food Safety Regulations and Consumer Transparency: FSMA 204 compliance requirements, retailer-driven traceability standards, and increasing consumer demand for product transparency are accelerating the adoption of cloud-based food traceability solutions across global food supply chains.
Food traceability software improves food safety, supply chain transparency, and regulatory compliance through digital product tracking. In 2026, the global food traceability solutions market is projected to reach USD 28.8 billion, driven by growing demand for blockchain technology, AI-powered monitoring, real-time tracking, and efficient food recall management across global supply chains.
The global food industry is undergoing a significant digital transformation as businesses increasingly prioritize food safety, supply chain transparency, regulatory compliance, and operational efficiency. With growing concerns over foodborne illnesses, product recalls, food fraud, and supply chain disruptions, food traceability software has become an essential technology for food manufacturers, distributors, retailers, and agricultural businesses in 2026.
Also, read our article on the Top 10 Best Food Traceability Software.

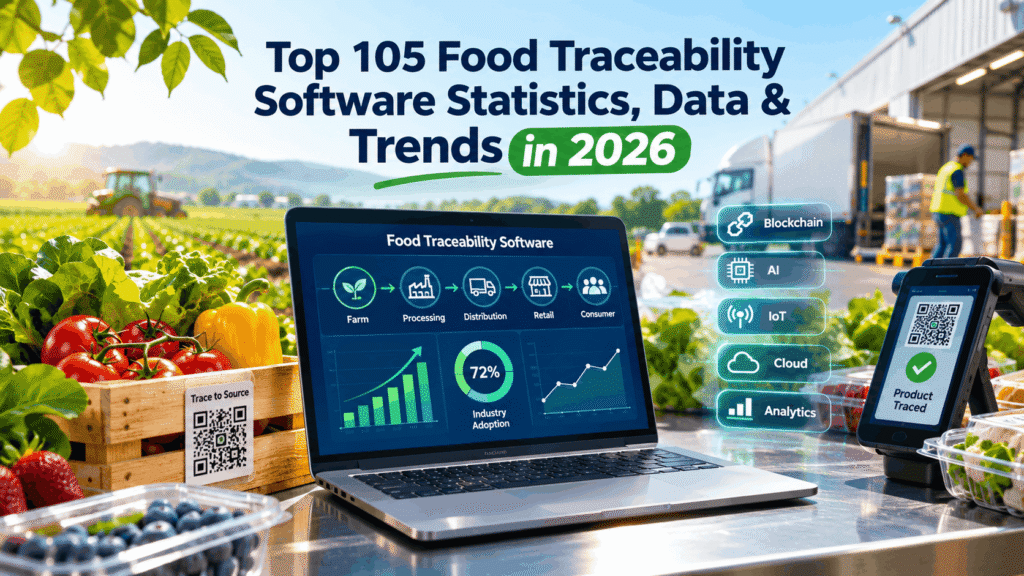
According to industry research, the global food traceability solutions market was valued at approximately USD 26.2 billion in 2025 and is projected to reach USD 28.8 billion in 2026, with further growth expected to USD 64.5 billion by 2035. Meanwhile, estimates for the narrower food traceability software market vary considerably, reflecting differences in market definitions, technology coverage, and research methodologies. Nevertheless, these forecasts highlight increasing investment in digital traceability platforms, blockchain technology, cloud-based tracking systems, and automated food safety management solutions.
Food safety remains one of the strongest drivers behind this growing demand. The World Health Organization estimates that approximately 600 million people worldwide become ill from contaminated food annually, resulting in around 420,000 deaths. In the United States alone, foodborne illnesses affect an estimated 48 million people each year, creating substantial financial and operational risks for businesses throughout the food supply chain.

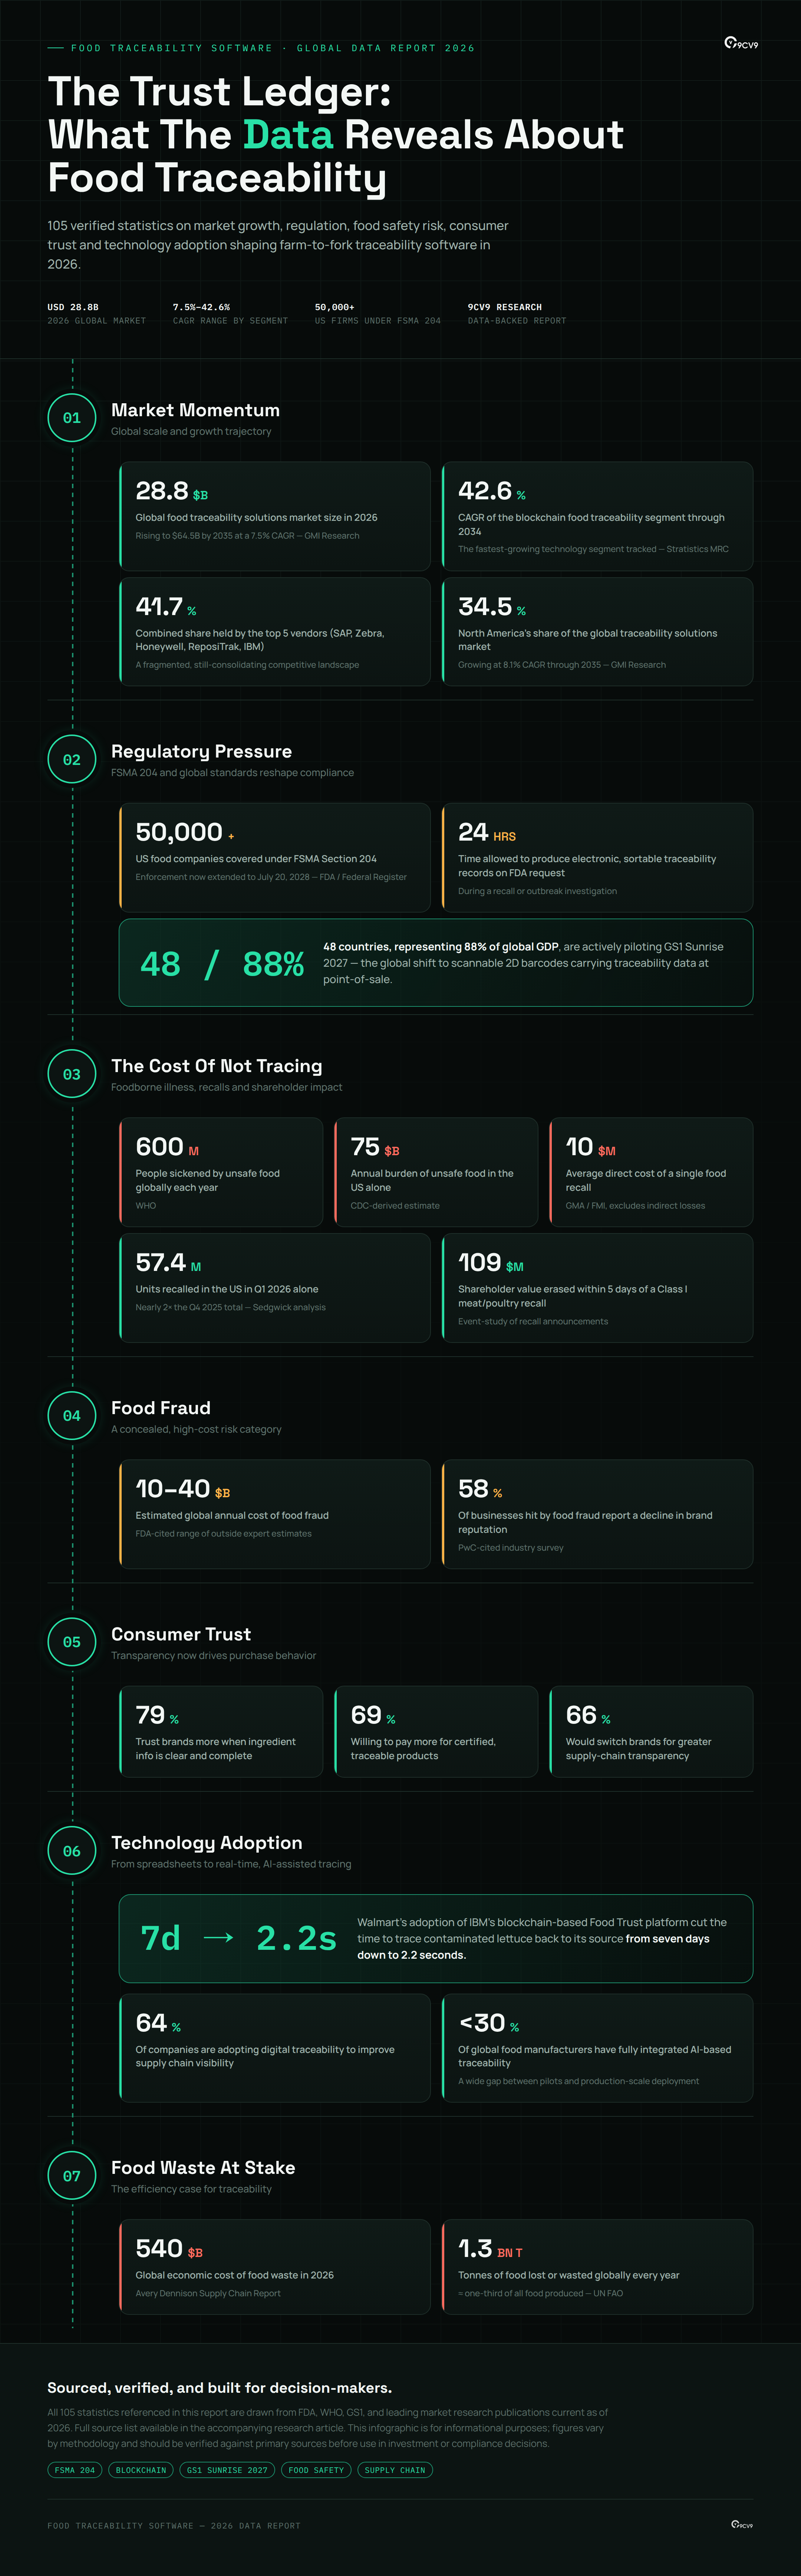
Regulatory developments are also reshaping the food traceability software landscape in 2026. The U.S. Food and Drug Administration’s Food Safety Modernization Act (FSMA) Section 204 introduces enhanced traceability recordkeeping requirements for certain high-risk foods, with the compliance deadline extended to July 20, 2028. At the same time, major retailers are implementing their own supplier traceability standards, accelerating the adoption of digital recordkeeping, barcode scanning, lot tracking, and real-time supply chain monitoring.
Emerging technologies are further transforming how food businesses track products from farm to fork. Blockchain-based food traceability, artificial intelligence (AI), Internet of Things (IoT) sensors, RFID technology, and cloud-based traceability software are enabling organizations to improve product visibility, detect contamination risks, monitor cold chain conditions, and respond more efficiently to recalls. For example, Walmart’s blockchain traceability initiative demonstrated how the time required to trace the origin of a food product could be reduced from several days to just seconds.
Consumer expectations are reinforcing this transformation. Research indicates that 79% of surveyed shoppers are more likely to purchase products when additional ingredient, nutritional, or sourcing information is accessible through smartphone scanning. This growing demand for transparency is encouraging food brands to invest in traceability systems that support product authentication, sustainability reporting, and customer trust.
Despite these advancements, challenges remain. High implementation costs, fragmented supplier networks, inconsistent data standards, and integration difficulties continue to affect food traceability software adoption, particularly among small and medium-sized enterprises. However, expanding cloud infrastructure, mobile traceability applications, and interoperable supply chain technologies are creating new opportunities for businesses seeking scalable and cost-effective solutions.
This comprehensive guide explores the top 105 food traceability software statistics, data, and trends in 2026, covering global market size, industry growth forecasts, blockchain adoption, AI-powered traceability, FSMA 204 compliance, food recall costs, cold chain monitoring, consumer transparency, and regional market developments.
Whether readers are food manufacturers, supply chain managers, technology providers, software developers, investors, or business decision-makers, these food traceability software statistics provide valuable insights into the technologies, market opportunities, and industry trends shaping the future of food safety and supply chain management in 2026 and beyond.
Before we venture further into this article, we would like to share who we are and what we do.
About 9cv9
9cv9 is a business tech startup based in Singapore and Asia, with a strong presence all over the world.
With over ten years of startup and business experience, and being highly involved in connecting with thousands of companies and startups, the 9cv9 team has listed some of the top and best companies/tools in this review.
If you like to get your company listed in our top B2B software reviews, check out our world-class 9cv9 Media and PR service and pricing plans here.
Top 105 Food Traceability Software Statistics, Data & Trends in 2026
Market Size & Growth
1. The global food traceability solutions market was valued at USD 26.2 billion in 2025 and is projected to expand to USD 28.8 billion in 2026, en route to USD 64.5 billion by 2035 at a 7.5% CAGR — a clear signal that food businesses are treating traceability as a core infrastructure investment, not an optional add-on.
2. According to Global Market Insights, the top five vendors — SAP SE, Zebra Technologies, Honeywell International, ReposiTrak, and IBM — collectively controlled 41.7% of the food traceability solutions market in 2025, showing the category is still fragmented enough for challenger brands to compete.
3. SAP SE held the single largest market share at over 8.5% in 2025, underlining how deeply traceability functionality is now embedded inside enterprise resource planning suites rather than sold as standalone tools.
4. North America commands a 34.5% share of the global food traceability solutions market and is forecast to grow at an 8.1% CAGR through 2035, reflecting the compounding effect of FDA and retailer-driven mandates.
5. One market analysis pegs the global food traceability software market at USD 265 million in 2025, rising to USD 291.5 million in 2026 and USD 687.34 million by 2035 — illustrating just how widely estimates vary depending on how “software” is scoped versus the broader “solutions” category.
6. A separate report values the food traceability software tools market at USD 2.5 billion in 2024, projected to almost double to USD 5.8 billion by 2033 at a 9.8% CAGR, driven by e-commerce growth and IoT-enabled monitoring.
7. Yet another estimate places the food traceability software market at USD 12.32 billion in 2024, climbing to USD 25.95 billion by 2033 at an 8.63% CAGR, reinforcing that buyers should expect wide variance across analyst firms and always check methodology before citing a single number.
8. SkyQuest also cites a competing figure of USD 22.3 billion in 2024 growing to USD 42.4 billion by 2033 at a 7.4% CAGR for the same category, a reminder that “food traceability software market size” is not a standardized metric across research houses.
9. The broader food traceability market (software plus hardware plus services) is valued at USD 34.35 billion in 2025 and is set to reach USD 36.88 billion in 2026, growing to USD 67.44 billion by 2034 at a 7.84% CAGR.
10. Europe dominates the overall food traceability market with a 41.43% share in 2025, ahead of North America and Asia-Pacific, largely thanks to the EU’s long-standing General Food Law traceability requirements.
11. The software segment alone is expected to contribute 26.33% of the global food traceability market in 2026, confirming software is now recognized as the fastest-scaling piece of the traceability stack relative to hardware.
12. A high-growth estimate from Verified Market Reports pegs the sector at USD 1.6 billion in 2024, forecasting a jump to USD 5.2 billion by 2033 at a 14.8% CAGR — among the more bullish outlooks in the space.
13. The same report finds the United States holds 38% of global food traceability software revenue, ahead of Europe’s 27% and Asia-Pacific’s 25%.
14. Expert Market Research sizes the global food traceability software market at nearly USD 628.53 million in 2025, projecting a steep climb to USD 2.75 billion by 2035 at a 15.90% CAGR — one of the highest growth rates recorded across all cited studies.
15. Within that same forecast, Asia-Pacific is expected to be the fastest-growing region, propelled by rising packaged food demand in India and China and expanding software company footprints in Southeast Asia.
16. Globalgrowthinsights projects the Food Traceability Solutions Market will grow from USD 24.29 billion in 2025 to USD 26.89 billion in 2026 and USD 29.77 billion in 2027, ultimately reaching USD 67.13 billion by 2035 at a 10.7% CAGR.
17. In that dataset, software platforms account for nearly 44% of total demand while blockchain-based solutions contribute an additional 18%, showing how deeply blockchain has already been absorbed into “software” spending rather than treated as a separate line item.
18. Food safety compliance applications represent 36% of total demand in the same market model, confirming regulatory compliance remains the single largest use case driving software purchases.
19. India secured a 16% share of the “Food Produce Companies” segment in 2025, alongside the US at 28% and China at 25%, positioning India as a genuine growth market rather than an afterthought for global vendors.
20. India’s food traceability market specifically is expected to reach approximately USD 0.47 billion in 2026, a comparatively small but fast-scaling base compared to Japan’s USD 1.91 billion and China’s USD 2.69 billion in the same year.
21. Asia-Pacific overall reached USD 6.25 billion in the food traceability market in 2025 (18.19% global share) and is projected to hit USD 6.66 billion in 2026, confirming the region’s rising weight in global vendor strategy.
Blockchain in Food Traceability
22. The global food traceability blockchain market is valued at USD 2.49 billion in 2026 and is forecast to reach USD 42.66 billion by 2034 at an extraordinary 42.6% CAGR, making it one of the fastest-growing sub-segments in all of food-tech software.
23. A separate blockchain-specific forecast values the category at USD 820.4 million in 2026, growing at a 19.6% CAGR to reach USD 4.9 billion by 2036 — again illustrating how methodology dramatically changes the reported baseline.
24. IBM Corporation, Oracle Corporation, SAP SE, VeChain Foundation, and TE-FOOD International are named as the major players actively competing in blockchain-enabled food traceability, spanning both legacy enterprise vendors and blockchain-native startups.
25. In the blockchain food traceability by-type segmentation, business-to-business (B2B) use cases lead with 62% share in 2026, confirming blockchain traceability is still overwhelmingly a supply-chain tool rather than a consumer-facing feature.
26. Meat, seafood, and eggs together account for 38.2% of blockchain traceability application share in 2026 — the highest of any food category — reflecting the elevated fraud and contamination risk associated with animal proteins.
27. China is forecast to be the fastest-growing blockchain food traceability market at a 44.4% CAGR, with Japan following at a still-substantial 24.7% CAGR.
28. A 2022 academic study of 350 Thai coffee supply-chain stakeholders found that 67% viewed blockchain positively as a driver of traceability adoption intent, offering one of the clearest consumer-facing validation data points for blockchain traceability technology.
29. GS1’s EPCIS 2.0 standard is increasingly cited by industry analysts as the practical bridge for blockchain interoperability, since a grower on one platform frequently needs to exchange data with a distributor on a completely different platform.
30. By technology type, barcodes and QR codes still commanded 33.85% of the broader food traceability market in 2025, meaning blockchain — despite the hype — remains a minority share of real-world deployed traceability technology today.
31. Blockchain is nonetheless forecast to grow at an 8.27% CAGR through 2031 within that same broader traceability technology mix, confirming steady displacement of legacy tracking methods over time.
FSMA 204 & Regulatory Compliance
32. FDA’s Food Traceability Rule (FSMA Section 204) was originally scheduled to take effect January 20, 2026, but its enforcement date has now been extended to July 20, 2028 following a Federal Register notice published August 7, 2025 and a subsequent Congressional directive in the Continuing Appropriations Act of 2026 — a critical update that food businesses relying on older guidance need to know.
33. Despite the federal extension, Walmart’s own supplier traceability requirement — including ASN with Key Data Element data, SSCC-18 pallet labels, and GS1-128 case labels — has been in effect since August 1, 2025, meaning retailer-driven mandates are already pulling compliance timelines forward regardless of the federal deadline.
34. FSMA 204 covers an estimated 50,000+ food companies across the US supply chain, making it one of the most sweeping traceability-technology procurement events in North American food industry history.
35. Under FSMA 204, covered entities must be able to produce electronic, sortable traceability records within 24 hours of an FDA request during a recall or outbreak investigation, a timeline that is virtually impossible to hit reliably with spreadsheets or paper logs.
36. The FDA’s Food Traceability List identifies specific high-risk foods requiring enhanced recordkeeping, including soft cheeses, shell eggs, leafy greens, tomatoes, cucumbers, melons, and fresh-cut produce, all categories with a documented history of recurring foodborne illness outbreaks.
37. The Food Traceability Final Rule itself was published in the Federal Register back in November 2022, meaning food businesses have effectively had multiple years of runway to prepare — yet many are still assembling compliant systems as retailer mandates accelerate.
38. GS1’s Sunrise 2027 initiative — a parallel but related supply-chain data standard — already has pilots running in 48 countries representing 88% of global GDP, showing how deeply 2D barcode and traceability standardization has spread internationally.
39. A GS1 consumer survey found 79% of shoppers say they would be more likely to purchase a product if they could scan a smartphone code for additional ingredient, nutrition, or sourcing information, a strong commercial argument for traceability-linked packaging.
40. In a related survey, 62% of consumers said they are willing to spend more on a product that provides detailed scannable information, and 77% said such product information directly influences their purchase decision.
41. Major consumer brands including PepsiCo, Puma, and Procter & Gamble are already piloting GS1 Digital Link 2D barcodes ahead of the 2027 retail deadline, signaling that early enterprise adoption is running well ahead of regulatory enforcement dates.
Foodborne Illness, Recalls & Financial Impact
42. The World Health Organization estimates 600 million people fall ill from unsafe food globally each year, with roughly 420,000 associated deaths — the single largest public-health argument for investing in traceability software.
43. In the United States alone, the CDC estimates 48 million people — roughly 1 in 6 Americans — suffer from foodborne illness annually, with 128,000 hospitalizations and approximately 3,000 deaths.
44. The annual economic burden of unsafe food in the US is estimated at USD 75 billion, a figure that dwarfs the entire projected 2026 global food traceability software market by orders of magnitude.
45. US food recalls reached 57.4 million recalled units in Q1 2026, nearly double the 28.76 million units recalled in Q4 2025, according to Sedgwick analysis, even as the total number of individual recall events declined — meaning each recall event is, on average, getting significantly larger and more damaging.
46. The average direct cost of a single food recall is widely cited at USD 10 million, a figure that only accounts for retrieval, disposal, and notification costs and excludes lawsuits, lost contracts, or reputational damage.
47. More granular research shows recall costs vary enormously by company type: producers face median costs of USD 3.0 million to USD 72.7 million per recall, while restaurants face a comparatively smaller USD 0.04 million to USD 1.1 million range.
48. An event study of meat and poultry recalls found that Class I recalls erased approximately USD 109 million in shareholder value within just five trading days of the recall announcement, a striking illustration of how quickly capital markets punish food safety failures.
49. Blue Bell Creameries paid USD 19.35 million in penalties following its Listeria outbreak, one of the most-cited real-world case studies in food-safety compliance training material.
50. There were 423 food recall cases recorded in the United States in a single recent year, underscoring that recalls are a routine — not exceptional — operational risk for food businesses of every size.
51. Roughly one-third of recalls historically originate from small companies with under five employees, showing that traceability software is not solely an enterprise-scale concern; smaller producers carry meaningful recall exposure too.
Food Fraud
52. FDA-cited outside expert estimates place the cost of food fraud at USD 10–15 billion globally per year, though the agency notes some more recent expert estimates put the figure as high as USD 40 billion annually.
53. A separate widely cited range pegs global food fraud costs even higher, at an estimated USD 30–50 billion annually, illustrating the persistent difficulty of measuring a category of crime specifically designed to evade detection.
54. In the UK specifically, the Food Standards Agency’s Cost of Food Crime model estimates the annual economic impact at between £410 million and £1.96 billion.
55. Within that UK model, the average cost of a small food fraud case is estimated at £87,000, while major cases average a staggering £4.3 million per incident.
56. PwC research cited in industry reporting found that 58% of businesses affected by food fraud report a measurable decline in brand reputation following the incident, reinforcing that fraud damage extends well beyond direct financial loss.
57. In the historically fraud-prone Italian hard cheese category, industry executives have estimated that roughly 20% of the pound volume sold in the US under “Italian hard cheese” labeling is adulterated or counterfeit product.
Consumer Trust & Transparency Demand
58. A NielsenIQ and Food Industry Association report found that two-thirds of food shoppers say they would switch from their regular brand to a competitor that provides more detailed product information — a direct commercial incentive for traceability-linked labeling.
59. In a related consumer survey, 69% of shoppers said they are willing to pay more for products carrying clear safety and quality certifications, reinforcing that traceability transparency is increasingly a premium-pricing lever, not just a compliance cost.
60. 53% of consumers surveyed said they want more transparency specifically around food safety, product content, allergens, and hygiene — the single largest transparency priority among consumers globally.
61. 55% of surveyed consumers said they want more transparency around sustainability issues, including ingredient origin, human rights, and working conditions across the supply chain.
62. A DNV survey found that product labeling accounts for 48.8% of overall consumer purchase decision-making, underscoring how much commercial weight rides on clear, traceable labeling claims.
63. In a separate US-focused survey of 1,035 grocery shoppers, 79% of respondents said that when manufacturers share complete, easy-to-understand ingredient information, they are more likely to trust that company.
64. The same survey found 64% of shoppers would switch from a familiar brand to a new one specifically because the new brand offers more supply-chain transparency, a figure closely aligned with the NielsenIQ finding above.
65. The globally-tracked EIT Food TrustTracker study surveys nearly 20,000 European consumers annually since 2018, making it one of the most comprehensive longitudinal datasets available on consumer trust in food system transparency.
AI, IoT & Predictive Technology
66. As of 2025, more than 60% of AI adoption within food manufacturing is concentrated specifically on real-time quality inspection and contamination detection rather than back-office administrative use cases.
67. Despite that momentum, fewer than 30% of global food manufacturers report having fully integrated AI-based traceability systems, highlighting a substantial gap between AI pilot programs and full production-scale deployment.
68. The AI-driven food safety and quality control market was valued at approximately USD 2.7–3.1 billion in the 2024–2026 window and is projected to reach USD 13.7 billion by 2030 at roughly a 30.9% CAGR.
69. In one of the most concrete real-world case studies available, Walmart’s adoption of IBM’s blockchain-based Food Trust platform reduced the time required to trace the origin of contaminated lettuce from seven days down to just 2.2 seconds.
70. The FDA itself now uses AI-based screening tools to help assess import risk at the border, signaling that AI-assisted traceability is moving from vendor marketing claims into actual regulatory practice.
Cold Chain, IoT & RFID Monitoring
71. The global food cold chain market was valued at USD 66.20 billion in 2025 and is projected to reach USD 73.10 billion in 2026, advancing to USD 181.10 billion by 2035 at a 10.60% CAGR.
72. Within cold chain technology specifically, RFID and basic real-time monitoring held a 42.14% share of the market in 2024, while IoT-enabled telematics is forecast to grow fastest at a 15.78% CAGR going forward.
73. The global cold chain monitoring market alone was valued at USD 7.2–8.31 billion in 2025 depending on the analyst source, with most forecasts converging on a range of USD 15–25 billion by 2030–2035 at CAGRs between 12% and 12.76%.
74. The global IoT for cold chain monitoring market forecasts hardware — sensors, data loggers, and RFID devices — to contribute 46.80% of total category revenue by 2025, confirming physical sensing infrastructure still leads pure-software spend in this niche.
75. Small and medium enterprises (SMEs) are projected to account for 55.90% of IoT cold chain monitoring revenue by 2025, a notable finding given SMEs are often assumed to lag in traceability technology adoption.
76. The global cold chain tracking and monitoring market is projected to reach USD 15.89–25.11 billion by 2030–2034 depending on the report, growing at CAGRs between roughly 12.76% and 14.9%.
77. North America leads global cold-chain infrastructure with a 40.46% share in 2024, though Asia-Pacific is forecast to expand fastest at a 16.56% CAGR through 2030, driven by rising frozen and packaged food consumption.
Food Waste & Supply Chain Efficiency
78. The global economic cost of food waste is forecast to reach USD 540 billion in 2026 alone, up from USD 526 billion the prior year, according to Avery Dennison’s 2026 supply chain report.
79. Meat is the single most costly food-waste category, projected to account for USD 94 billion of the total 2026 loss — nearly one-fifth of the entire global food waste bill — followed closely by fresh produce at USD 88 billion.
80. In the same Avery Dennison survey, 56% of supply chain leaders admitted they lack a clear understanding of where food waste actually occurs during transit, a visibility gap that traceability software is directly positioned to close.
81. 72% of supply chain leaders specifically cited meat as their single biggest food-waste management challenge, reinforcing the elevated priority protein categories receive in traceability technology investment.
82. The UN Food and Agriculture Organization estimates that roughly 1.3 billion tonnes of food — about one-third of everything produced for human consumption — is lost or wasted globally every year.
83. In the United States specifically, the USDA Economic Research Service estimates that 30–40% of the entire national food supply, or roughly 80 million tonnes annually, goes to waste.
84. A 2026 study published in Nature Climate Change found that food waste accounts for approximately 19% of global greenhouse gas emissions, equivalent to roughly 4.0 gigatons of CO2-equivalent per year.
85. Globally, roughly one-fifth of all food produced for human consumption is lost or wasted, equating to an estimated one billion meals wasted every single day.
Deployment Models & Enterprise Adoption
86. By deployment mode, on-premise platforms still retained 60.35% of the broader food traceability market in 2025, even as cloud-based solutions are forecast to grow faster, at an 8.05% CAGR through 2031.
87. By offering type, hardware held a 45.23% revenue share of the overall food traceability market in 2025, while services are projected to expand faster at a 6.69% CAGR — a sign that ongoing support and integration work is becoming as commercially important as the underlying technology itself.
88. Food manufacturers and processors led end-use adoption with a 37.98% revenue share of the food traceability market in 2025, while retail and e-commerce adoption is accelerating fastest, at a 6.98% CAGR.
89. One separate market model finds 64% of companies globally are adopting digital traceability systems specifically to improve supply chain visibility, while 69% cite compliance and safety tracking as their primary driver.
90. Within the US specifically, that same analysis finds 72% of food companies already use some form of traceability software to improve transparency, while 66% of food retailers now require traceability compliance as a condition of doing business with suppliers.
91. Cloud adoption within food traceability technology stacks is estimated at 68%, with mobile-based traceability tool usage close behind at 64%, reflecting a broader shift toward accessible, field-level data capture rather than centralized desktop systems.
92. By application, fresh produce accounted for 28.05% of the food traceability market in 2025 — the single largest category by application — while seafood traceability is forecast to grow fastest, at a 7.56% CAGR through 2031.
Fresh Produce, Seafood & High-Risk Categories
93. Leafy greens (romaine, spinach, kale) are explicitly named on the FDA’s Food Traceability List due to a documented pattern of recurring E. coli and Listeria outbreaks, making them one of the single highest-priority categories for traceability software vendors targeting the produce sector.
94. Soft and semi-soft cheeses — including ricotta, feta, blue cheese, mozzarella, and brie — are similarly flagged on the FDA’s list, reflecting the elevated Listeria contamination risk associated with unpasteurized or minimally processed dairy.
95. Melons, cucumbers, tomatoes, and fresh-cut fruits and vegetables round out the FDA’s core high-risk produce list, together representing some of the most recall-prone SKUs tracked by any grocery retailer in North America.
Regional & Country-Specific Dynamics
96. Japan’s food traceability market is forecast to reach USD 1.91 billion in 2026, while China’s is projected at USD 2.69 billion in the same year — both dwarfing India’s comparatively nascent USD 0.47 billion market, underscoring the scale gap that remains between the region’s mature and emerging economies.
97. India’s Food Safety and Standards Authority (FSSAI), operating under the FoSCoS licensing framework, has introduced mandatory QR code labeling requirements for specific processed food categories, laying essential digital-traceability groundwork across one of the world’s largest food manufacturing bases.
98. According to a Q1 2026 expert panel of 16 food traceability technology specialists across China, India, Brazil, and Japan, the binding constraint on Asia-Pacific traceability adoption is not platform availability — commercial solutions from SAP, IBM, and Honeywell are already accessible — but rather data standardization across highly fragmented upstream supplier tiers.
99. In the UK’s food fraud reporting specifically, businesses with over 250 employees make up just 0.5% of food firms yet account for 64% (£375 billion) of the entire £585 billion UK food industry turnover, showing how concentrated large-enterprise revenue is relative to the long tail of smaller producers most exposed to fraud risk.
100. North America’s food cold chain infrastructure remains the largest single-country temperature-controlled storage base globally, anchored by continued capital deployment into electronic tracing networks even as the federal FSMA 204 enforcement timeline was pushed back to 2028.
101. The Asia-Pacific food traceability blockchain segment is expected to register the fastest global growth rate of any region through the forecast period, driven by tightening national food-safety regulation and rapid smart-agriculture investment across China, India, and Southeast Asia.
102. Retailer-led traceability mandates — rather than government regulation alone — are increasingly cited by industry analysts as the primary force accelerating blockchain and digital traceability adoption in 2026, since large grocery chains directly control supplier shelf-space access.
103. As of the current forecast window, Warehouse Software represents a significant and growing share of the food traceability software market specifically, reflecting rising demand for real-time inventory visibility and better demand forecasting inside food distribution centers.
104. Laboratory Information Management Systems (LIMS) and Quality Management Software remain distinct, actively tracked sub-segments within the food traceability software market, confirming that lab-level testing data and floor-level quality control are increasingly expected to integrate directly with traceability platforms rather than operate as siloed tools.
105. Taken together, the range of credible 2026 market-size estimates for food traceability software — from roughly USD 291 million to well over USD 26 billion depending on scope — is itself an instructive statistic: buyers evaluating vendors should always confirm exactly what a “traceability software market” figure includes before using it to benchmark spend.
Conclusion
The top 105 food traceability software statistics, data, and trends in 2026 highlight an industry undergoing rapid technological transformation, driven by increasing food safety concerns, stricter regulatory requirements, growing consumer expectations, and the need for greater supply chain transparency. As food manufacturers, distributors, retailers, and agricultural businesses embrace digital solutions, food traceability software is evolving from a compliance-focused tool into a critical component of modern food supply chain management.
The global food traceability solutions market is projected to reach USD 28.8 billion in 2026 and expand to USD 64.5 billion by 2035, reflecting sustained investment in technologies that improve product tracking, risk management, and operational visibility. Although market estimates vary depending on whether they include software, hardware, and related services, the overall direction remains clear: businesses are increasingly prioritizing digital traceability to strengthen food safety and supply chain resilience.
One of the most significant food traceability software trends in 2026 is the growing adoption of blockchain technology, artificial intelligence (AI), Internet of Things (IoT) devices, RFID tracking, and cloud-based traceability platforms. These technologies are transforming traditional food tracking processes by enabling real-time monitoring, automated data collection, predictive risk assessment, and faster product recalls. Blockchain-based food traceability, in particular, is attracting substantial investment, with one industry forecast projecting the market to reach USD 42.66 billion by 2034.
Regulatory compliance will remain another major growth driver. The FDA’s FSMA 204 Food Traceability Rule, with its extended compliance deadline of July 20, 2028, is encouraging businesses to modernize their recordkeeping systems and improve traceability across complex supplier networks. Meanwhile, retailer-driven requirements and international traceability standards are accelerating digital adoption, even before government enforcement deadlines take effect.
The financial implications of inadequate food traceability are equally significant. With approximately 600 million people affected by foodborne illnesses worldwide each year, alongside billions of dollars in economic losses from food recalls, fraud, and waste, organizations face increasing pressure to implement reliable food safety management and traceability solutions. Effective digital traceability systems can help businesses identify contamination sources, reduce recall response times, minimize unnecessary product withdrawals, and protect brand reputation.
Consumer demand for transparency is also reshaping the competitive landscape. As shoppers increasingly seek information about ingredient origins, product authenticity, sustainability, and food safety, businesses that invest in transparent and verifiable supply chains may gain advantages in customer trust, brand differentiation, and long-term loyalty.
However, the future of food traceability software will not depend solely on technological innovation. Data interoperability, affordability, supplier collaboration, cybersecurity, and integration with existing enterprise systems will play essential roles in determining how successfully businesses implement and scale traceability solutions. Small and medium-sized food enterprises, in particular, will benefit from accessible cloud-based platforms that reduce implementation complexity while supporting regulatory compliance and operational efficiency.
Looking ahead, the food traceability software industry is expected to experience continued growth as digital transformation accelerates across North America, Europe, Asia-Pacific, and emerging markets. Organizations that proactively adopt scalable traceability technologies, standardize supply chain data, and integrate food safety monitoring into their operations will be better positioned to respond to evolving regulations, changing consumer expectations, and future supply chain disruptions.
Ultimately, the food traceability software statistics and trends for 2026 demonstrate that end-to-end supply chain visibility is becoming a strategic business necessity rather than an optional technological investment. For food industry stakeholders, understanding these market developments and investing in effective traceability solutions will be essential to improving food safety, strengthening operational resilience, reducing financial risks, and building more transparent, sustainable, and trustworthy global food supply chains in 2026 and beyond.
If you find this article useful, why not share it with your hiring manager and C-level suite friends and also leave a nice comment below?
We, at the 9cv9 Research Team, strive to bring the latest and most meaningful data, guides, and statistics to your doorstep.
To get access to top-quality guides, click over to 9cv9 Blog.
To hire top talents using our modern AI-powered recruitment agency, find out more at 9cv9 Modern AI-Powered Recruitment Agency.
People Also Ask
What is food traceability software?
Food traceability software is a digital solution that tracks food products throughout the supply chain, from production and processing to distribution and retail. It helps businesses improve food safety, regulatory compliance, product transparency, and recall management.
What is the global food traceability software market size in 2026?
The global food traceability solutions market is projected to reach USD 28.8 billion in 2026, up from USD 26.2 billion in 2025. Estimates for software-only markets vary depending on the research methodology and technologies included.
How fast is the food traceability software market growing?
The global food traceability solutions market is projected to grow at a compound annual growth rate (CAGR) of 7.5%, reaching approximately USD 64.5 billion by 2035, driven by food safety regulations, digital transformation, and supply chain transparency.
What are the major food traceability software trends in 2026?
Major trends include blockchain integration, AI-powered contamination detection, IoT monitoring, cloud-based platforms, RFID tracking, digital product passports, automated recall management, and growing adoption of GS1 traceability standards.
Why is food traceability software important in 2026?
Food traceability software helps businesses identify contamination sources, manage product recalls, comply with food safety regulations, reduce operational risks, and provide consumers with accurate information about food origins and production processes.
How does blockchain technology improve food traceability?
Blockchain technology creates shared, tamper-resistant records of food supply chain transactions. It improves data transparency, product authentication, supplier accountability, and traceability across manufacturers, distributors, retailers, and logistics providers.
What is the blockchain food traceability market size in 2026?
One industry forecast values the global blockchain food traceability market at USD 2.49 billion in 2026, with projected growth to USD 42.66 billion by 2034. Estimates vary significantly depending on market definitions and research methodologies.
How is artificial intelligence transforming food traceability software?
Artificial intelligence improves food traceability through automated quality inspections, contamination detection, predictive risk analysis, supply chain monitoring, and faster identification of potential food safety issues.
What is FSMA 204, and how does it affect food traceability software?
FSMA 204 is a U.S. FDA rule requiring enhanced traceability records for certain high-risk foods. It encourages businesses to implement digital tracking systems that capture critical tracking events and key data elements throughout the food supply chain.
When is the FSMA 204 compliance deadline?
The FSMA 204 Food Traceability Rule compliance date has been extended to July 20, 2028. Covered businesses should prepare traceability records, supplier data systems, and electronic reporting processes before the deadline.
Which foods are covered under the FDA Food Traceability Rule?
The FDA Food Traceability List includes certain cheeses, shell eggs, leafy greens, tomatoes, cucumbers, melons, fresh-cut produce, and other designated foods requiring enhanced traceability recordkeeping.
How does food traceability software help with product recalls?
Food traceability software identifies affected product batches, tracks distribution routes, locates suppliers, and supports targeted recalls. This helps businesses respond faster, minimize unnecessary product withdrawals, and reduce potential financial losses.
What is the average cost of a food product recall?
The average direct cost of a food recall is commonly estimated at approximately USD 10 million. Actual costs vary significantly depending on company size, product category, recall severity, and additional legal or reputational consequences.
How many people suffer from foodborne illnesses annually?
The World Health Organization estimates that approximately 600 million people worldwide become ill from unsafe food annually, resulting in around 420,000 deaths. These figures highlight the importance of effective food safety and traceability systems.
What percentage of food businesses use traceability software?
One market analysis estimates that 72% of U.S. food companies use some form of traceability software to improve transparency. Adoption rates vary across regions, business sizes, and food industry segments.
What are the benefits of cloud-based food traceability software?
Cloud-based food traceability software provides centralized data access, real-time tracking, automated updates, supplier collaboration, scalable infrastructure, and easier integration with inventory management and food safety systems.
How does IoT technology support food traceability?
Internet of Things (IoT) technology uses connected sensors to monitor temperature, humidity, location, and storage conditions. These devices help businesses track perishable products, detect cold chain disruptions, and improve food safety monitoring.
What role does RFID technology play in food traceability?
RFID technology enables automated identification and tracking of food products, pallets, and shipments. It improves inventory visibility, reduces manual scanning requirements, and supports faster product identification throughout the supply chain.
What is cold chain monitoring software?
Cold chain monitoring software tracks temperature-sensitive food products during storage and transportation. It uses sensors, alerts, and real-time data to help prevent spoilage, maintain product quality, and support food safety compliance.
How large is the global cold chain monitoring market?
The global cold chain monitoring market was estimated at approximately USD 7.2 billion to USD 8.31 billion in 2025. Industry forecasts suggest continued growth, supported by demand for temperature monitoring and connected logistics technologies.
Which region dominates the global food traceability market?
Europe accounted for approximately 41.43% of the broader food traceability market in 2025, according to one industry analysis. North America also represents a major market, while Asia-Pacific offers significant growth opportunities.
Why is Asia-Pacific an important food traceability software market?
Asia-Pacific is experiencing growing demand for digital food tracking due to expanding food production, stricter safety requirements, e-commerce growth, and investments in smart agriculture across China, India, Japan, and Southeast Asia.
How does food traceability software prevent food fraud?
Food traceability software helps verify product origins, supplier identities, certifications, and transaction histories. These capabilities improve product authentication and make it easier to detect suspicious sourcing, labeling, or distribution activities.
How much does food fraud cost the global economy annually?
FDA-cited expert estimates place global food fraud losses at approximately USD 10 billion to USD 15 billion annually, while some estimates reach USD 40 billion or more. Measuring the true financial impact remains challenging.
How does food traceability software reduce food waste?
Food traceability software improves inventory visibility, expiration-date tracking, storage monitoring, and shipment management. These capabilities help businesses identify waste sources, prevent spoilage, and improve supply chain efficiency.
What percentage of consumers want greater food transparency?
One consumer survey found that 53% of respondents wanted greater transparency around food safety, ingredients, allergens, and hygiene, while 55% sought more information about sustainability and ingredient origins.
What are GS1 standards in food traceability?
GS1 standards provide globally recognized identification and data-sharing frameworks, including barcodes, QR codes, and EPCIS. They help businesses exchange consistent product and shipment information across food supply chains.
What challenges do businesses face when implementing food traceability software?
Common challenges include implementation costs, inconsistent supplier data, legacy system integration, employee training, cybersecurity concerns, and limited interoperability between different traceability platforms.
How can small food businesses benefit from traceability software?
Small food businesses can use traceability software to manage inventory, maintain supplier records, improve recall readiness, support food safety compliance, and increase customer confidence without relying entirely on manual tracking.
What is the future of food traceability software beyond 2026?
The future of food traceability software includes greater AI automation, blockchain interoperability, IoT integration, cloud adoption, predictive food safety analytics, and standardized digital records across global supply chains.
Sources
- Global Market Insights
- GlobalGrowthInsights
- Verified Market Reports
- SkyQuest Technology
- Expert Market Research
- Stratistics MRC
- DataM Intelligence
- U.S. Food and Drug Administration (FDA)
- Federal Register
- GS1
- World Health Organization (WHO)
- Centers for Disease Control and Prevention (CDC)
- Sedgwick
- ScienceDirect
- PwC
- UK Food Standards Agency
- NielsenIQ
- Food Industry Association
- DNV
- Avery Dennison
- Food and Agriculture Organization (FAO)
- USDA Economic Research Service
- Nature Climate Change
- Fortune Business Insights
- Mordor Intelligence
- Future Market Insights
- IBM
- Walmart
- Food Safety and Standards Authority of India (FSSAI)
- Food Safety Compliance System (FoSCoS)