
Key Takeaways
- Dashboard software continues its rapid global expansion in 2026, driven by strong cloud adoption, AI-powered analytics, and double-digit market growth forecasts through 2030 and beyond.
- More than two-thirds of organizations and most Fortune 500 companies now rely on dashboard software for real-time decision-making, operational visibility, and business intelligence across industries.
- Emerging trends including generative AI, predictive analytics, embedded dashboards, no-code development, and mobile-first experiences are reshaping the future of dashboard software and enterprise analytics.
Dashboard software helps organizations transform complex data into real-time insights that improve decision-making, productivity, and business performance. This guide explores the top 102 dashboard software statistics, market trends, adoption rates, AI innovations, and growth forecasts shaping the global dashboard software industry in 2026.
In today’s digital-first economy, data has become one of the world’s most valuable business assets, but raw information alone delivers little value without the ability to interpret it quickly and accurately. This is where dashboard software has emerged as an indispensable technology. From executive scorecards and business intelligence platforms to real-time operational monitoring and AI-powered analytics, dashboard software enables organizations to transform massive volumes of data into actionable insights that support faster, smarter, and more confident decision-making. As enterprises continue accelerating their digital transformation initiatives throughout 2026, dashboards are evolving from simple visualization tools into intelligent command centers that integrate data, predictive analytics, automation, and artificial intelligence across every business function.


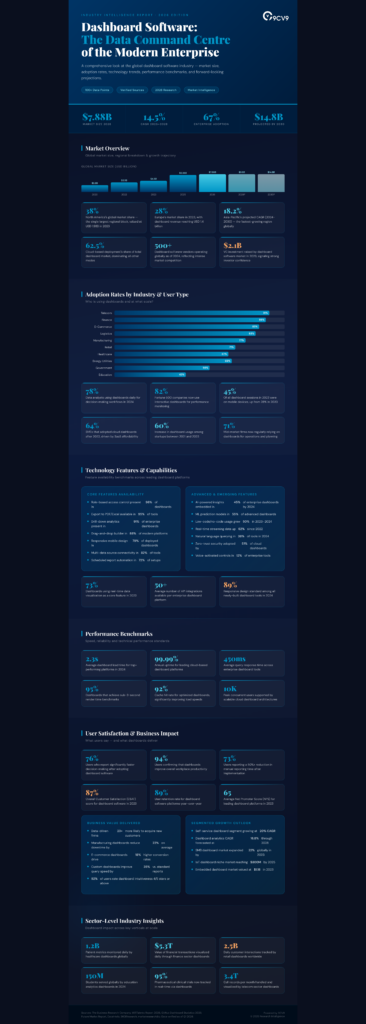
The dashboard software market is experiencing remarkable momentum worldwide. Industry estimates place the global market at between USD 4.2 billion and USD 5.2 billion in 2023 before expanding rapidly to approximately USD 6.88 billion in 2025 and an estimated USD 7.88 billion in 2026. Long-term projections suggest the industry could surpass USD 14.8 billion by 2030, while some forecasts estimate values exceeding USD 30 billion by 2032 when broader analytics ecosystems are included. Such sustained double-digit growth reflects the increasing strategic importance of dashboards as organizations invest heavily in business intelligence, digital reporting, embedded analytics, and enterprise-wide data accessibility.
One of the strongest drivers behind this expansion is the global shift toward cloud computing. Cloud-based dashboard platforms now account for well over 60% of deployments, while traditional on-premise implementations continue to decline year after year. Organizations increasingly prefer Software-as-a-Service (SaaS) dashboard solutions because they offer faster deployment, lower infrastructure costs, automatic updates, easier scalability, and improved collaboration across geographically distributed teams. Subscription-based dashboard software has also become the dominant commercial model, generating billions of dollars in recurring annual revenue while making advanced analytics accessible to businesses of every size.

Business intelligence remains the largest application area within the dashboard ecosystem, but modern dashboard platforms now extend far beyond executive reporting. Enterprises use dashboards to monitor sales performance, marketing campaigns, cybersecurity threats, supply chains, manufacturing operations, financial performance, customer service metrics, healthcare outcomes, human resources, logistics, energy production, education performance, and countless other operational processes. Organizations increasingly rely on centralized dashboards as their single source of truth, allowing decision-makers to view real-time KPIs from multiple systems within a unified interface.
Adoption statistics further demonstrate how deeply dashboard software has become embedded in modern organizations. More than two-thirds of enterprises now use digital dashboards, with adoption increasing significantly over the past few years. Fortune 500 companies have embraced interactive dashboards as standard operational infrastructure, while small and medium-sized businesses continue adopting cloud-based analytics platforms at record pace thanks to affordable subscription pricing and simplified implementation. Daily dashboard usage has become routine among executives, managers, analysts, and frontline employees, highlighting how these tools now influence strategic planning as well as everyday operational decisions.
Industry-specific adoption also reveals the widespread reliance on dashboard software across the global economy. Telecommunications companies use dashboards extensively to monitor massive network infrastructure and customer activity. Financial institutions depend on real-time dashboards for regulatory compliance, fraud detection, and risk management. E-commerce businesses continuously track sales, inventory, and customer behavior through live performance dashboards. Manufacturers leverage operational dashboards to reduce downtime and improve production efficiency, while healthcare providers increasingly use clinical dashboards to monitor patient outcomes, hospital capacity, and healthcare quality metrics. Government agencies, educational institutions, logistics providers, retailers, utilities, and sports organizations are similarly integrating dashboards into their daily operations to improve transparency, responsiveness, and performance management.
The technological capabilities of dashboard software have advanced dramatically over recent years. Real-time data visualization has become a standard expectation rather than a premium feature, while drag-and-drop dashboard builders have empowered non-technical business users to create sophisticated reports without coding expertise. Modern platforms increasingly offer customizable widgets, multi-source data integration, collaborative workspaces, automated alerts, mobile responsiveness, predictive analytics, embedded analytics, and extensive API connectivity. Export functions, responsive design, and flexible visualization options further enable organizations to distribute insights efficiently across departments and stakeholder groups.
Artificial intelligence represents perhaps the most transformative trend shaping dashboard software in 2026. AI-powered insights are becoming standard across enterprise platforms, enabling users to automatically identify anomalies, generate forecasts, recommend actions, and summarize complex datasets using natural language. Machine learning models embedded within dashboards can now predict future business performance, identify hidden trends, detect operational risks, and optimize decision-making without requiring advanced statistical expertise. At the same time, natural language querying allows users to ask business questions conversationally, dramatically lowering the barrier to advanced analytics and enabling broader data democratization throughout organizations.
Low-code and no-code development platforms are further expanding dashboard accessibility. Business users who previously depended on IT departments can now build customized dashboards independently using intuitive visual interfaces. This democratization of analytics has fueled rapid growth in self-service business intelligence, allowing organizations to respond faster to changing market conditions while reducing development bottlenecks. Combined with advances in real-time streaming data, edge computing, GraphQL APIs, and modern cloud infrastructure, today’s dashboard platforms deliver significantly higher performance, scalability, and flexibility than previous generations of reporting software.
Performance benchmarks continue to improve as vendors compete to deliver enterprise-grade user experiences. Leading dashboard platforms now achieve average load times of just a few seconds, maintain uptime exceeding 99.95%, support thousands of concurrent users, and deliver near-instant query responses. Improved resource efficiency, optimized data pipelines, and modern cloud-native architectures enable dashboards to process enormous data volumes while maintaining consistent responsiveness. These technical improvements are especially important for organizations operating mission-critical systems where real-time visibility directly affects operational performance and business outcomes.
User satisfaction remains exceptionally high across the dashboard software industry. Organizations consistently report faster decision-making, substantial productivity improvements, significant reductions in manual reporting time, and strong overall customer satisfaction after implementing dashboard platforms. High retention rates demonstrate that once dashboards become integrated into daily workflows, they evolve into essential business infrastructure rather than optional productivity tools. Market-leading platforms such as Microsoft Power BI, Tableau, Looker, Qlik, and numerous emerging vendors continue competing through innovation, usability, AI integration, and ecosystem connectivity.
Investment activity also highlights the long-term confidence surrounding dashboard software. Billions of dollars in venture capital continue flowing into analytics startups, embedded business intelligence providers, AI-powered dashboard vendors, and data visualization platforms. Growing demand for embedded analytics within SaaS applications has created entirely new market segments, allowing software vendors to integrate customizable dashboards directly into their products. Meanwhile, organizations increasingly view dashboard capabilities as a competitive differentiator rather than merely a reporting feature, driving continued innovation across the industry.
The future of dashboard software extends well beyond traditional charts and graphs. Emerging technologies such as generative AI, predictive analytics, conversational interfaces, automated insight generation, advanced data governance, zero-trust security frameworks, and intelligent automation are redefining how organizations interact with business information. As mobile access becomes increasingly essential and remote work continues reshaping enterprise collaboration, dashboards are evolving into intelligent operational hubs that deliver contextual insights whenever and wherever decisions need to be made.
This comprehensive guide presents the Top 102 Dashboard Software Statistics, Data & Trends in 2026, bringing together the latest market research, adoption figures, technology developments, investment trends, performance benchmarks, industry insights, and future forecasts shaping one of enterprise software’s fastest-growing segments. Whether you are a business executive, IT decision-maker, software developer, data analyst, investor, startup founder, product manager, or technology enthusiast, these carefully curated statistics provide valuable insights into the current state and future direction of dashboard software. Understanding these trends will help organizations evaluate emerging technologies, benchmark their analytics maturity, identify investment opportunities, and prepare for the next generation of intelligent, AI-powered business intelligence platforms.
Before we venture further into this article, we would like to share who we are and what we do.
About 9cv9
9cv9 is a business tech startup based in Singapore and Asia, with a strong presence all over the world.
With over ten years of startup and business experience, and being highly involved in connecting with thousands of companies and startups, the 9cv9 team has listed some important and crucial software tools in this review.
If you like to get your company listed in our top B2B software reviews, check out our world-class 9cv9 Media and PR service and pricing plans here.
Top 102 Dashboard Software Statistics, Data & Trends in 2026
🏦 MARKET SIZE & GROWTH
- The global dashboard software market was valued at USD 4.2–5.2 billion in 2023. This robust baseline confirms that dashboard tools have become a core infrastructure spend, not a discretionary technology investment.
- The market grew to USD 6.88 billion in 2025, and is projected to reach USD 7.88 billion in 2026 at a CAGR of 14.5%. This rapid annual expansion reflects accelerating enterprise demand for real-time business intelligence.
- The dashboard software market is expected to reach USD 14.8 billion by 2030, growing at a CAGR of 16.1%. Nearly tripling in value within a decade signals that dashboards are becoming as fundamental as ERP or CRM systems.
- An alternate forecast places the market at USD 9.8–11.38 billion by 2032–2033, with a CAGR of 9.2–9.63%. Even conservative projections confirm sustained double-digit growth, underscoring the resilience of the sector.
- A separate Future Market Report estimate values the dashboard market at USD 15.3 billion in 2024 and USD 32.9 billion by 2032 at a 9.5% CAGR. This higher estimate accounts for adjacent analytics, embedded BI, and platform expansion.
- BI dashboard market size hit USD 2.8 billion in Q4 2023 alone. Business intelligence remains the single largest functional category within the broader dashboard software ecosystem.
- SaaS-based dashboard solutions captured 52% of market revenue in 2023. The majority of commercial dashboard spend has already migrated to subscription-based cloud delivery models.
- SaaS dashboard revenue reached USD 2.1 billion in 2023. Recurring revenue models are now the dominant commercial structure across leading dashboard vendors.
- The embedded dashboard market was valued at USD 1.1 billion in 2023. Embedded analytics — dashboards built into third-party software — represents one of the fastest-growing sub-segments in the industry.
- Dashboard market VC investment reached USD 2.1 billion in 2023. Strong venture capital interest confirms investor confidence in dashboard software as a high-growth, scalable technology category.
🌍 REGIONAL MARKET SHARE
- North America holds 38% of the global dashboard software market share in 2023, valued at USD 1.98 billion. The US-led technology ecosystem continues to dominate dashboard software development, adoption, and revenue generation.
- Europe accounts for 28% of global dashboard market share, with revenue reaching USD 1.4 billion in 2023. GDPR compliance requirements and growing analytics maturity are key drivers of European dashboard adoption.
- Asia-Pacific is expected to grow at the highest CAGR of 18.2–19.5% from 2024 to 2030. Rapid digital transformation, increasing smartphone penetration, and enterprise modernisation in India, China, and Southeast Asia fuel this growth.
- Latin America’s dashboard market grew 18% year-over-year in 2023. Emerging economies across the region are rapidly adopting cloud-based dashboards to improve operational efficiency and data accessibility.
- The United States alone holds a 21.4% share of the global dashboard software market. The US is the single largest national market, driven by R&D investment, mature IT infrastructure, and high enterprise data maturity.
☁️ DEPLOYMENT & INFRASTRUCTURE
- Cloud-based dashboards accounted for 61–62.5% of deployments in 2023–2024. The majority of enterprises have moved dashboard workloads to the cloud, capitalising on scalability, cost efficiency, and remote access capabilities.
- On-premise dashboards hold 22% market share in 2023, down from 35% in 2020. The steady decline of on-premise solutions reflects an industry-wide shift toward cloud-native architectures.
- On-premise dashboard deployments are declining at -5% annually. Organisations still running on-premise BI are increasingly being pressured by operational costs to migrate to cloud or hybrid alternatives.
- Cloud-based dashboard adoption grew 25% year-over-year by 2023. The explosive growth of cloud dashboards demonstrates that remote-first work models have permanently reshaped the analytics infrastructure landscape.
- SMB dashboard adoption rose 28% from 2022 to 2024. Small and medium-sized businesses are increasingly accessing enterprise-grade analytics capabilities through affordable SaaS dashboard platforms.
👥 ADOPTION RATES
- 67% of enterprises adopted dashboards in 2023, up from 52% in 2020. Dashboard adoption has become mainstream across the corporate world in just three years, driven by the data-driven decision culture.
- In 2024, 68% of organisations reported using digital dashboards for real-time data visualisation. Real-time dashboards have moved from competitive advantage to operational necessity for the majority of modern businesses.
- Business intelligence dashboard adoption increased by 45% among enterprises from 2020 to 2023. The pandemic-era shift to remote work dramatically accelerated BI tool deployment across global organisations.
- 78% of data analysts use dashboards daily for decision-making. For analytics professionals, dashboards have become the primary working interface — as fundamental as email is to knowledge workers.
- 65% of data analysts use dashboards daily in their workflow as of 2024. Daily dashboard engagement signals that these tools are deeply embedded in analytical workflows, not just occasional reporting tools.
- 78% of executives rely on dashboards for decision-making in 2024. C-suite adoption of dashboard tools confirms that data-driven leadership is now a standard expectation across large enterprises.
- Mobile dashboard usage rose to 45% of total sessions in 2023. Nearly half of all dashboard interactions now occur on mobile devices, making mobile-first design a critical feature requirement.
- 82% of Fortune 500 companies use interactive dashboards. The overwhelming adoption among top-tier enterprises underscores dashboards as a standard component of large-scale business operations.
- 72% of Fortune 500 companies use dashboard tools as of 2024. Executive dashboard adoption at the highest echelons of global business confirms that analytics visualisation has reached broad leadership maturity.
- 64% of SMEs adopted cloud dashboards post-2022. Cloud accessibility and lower price points have made dashboard tools viable for smaller businesses that previously lacked analytics infrastructure.
🏭 INDUSTRY-SPECIFIC ADOPTION
- Telecom sector dashboard adoption reached 91% globally in 2023. The data-intensive nature of telecommunications makes dashboards indispensable for network performance monitoring and customer analytics.
- Finance sector shows 89% dashboard usage for KPI tracking. Financial services organisations rely on dashboards as mission-critical tools for regulatory compliance, risk management, and performance reporting.
- E-commerce dashboard usage at 85% penetration in 2023. Online retail’s dependence on real-time sales, inventory, and marketing metrics has made dashboards a core operational necessity.
- Logistics firms are 83% reliant on supply chain dashboards. Real-time route optimisation, delivery tracking, and supply chain visibility make dashboards a fundamental logistics technology.
- Manufacturing sector shows 77% dashboard reliance for operations. Operational dashboards reduce production downtime, improve equipment utilisation, and support predictive maintenance strategies.
- Retail industry dashboard penetration reached 71% by end of 2023. Brick-and-mortar and omnichannel retailers use dashboards to unify inventory, POS, and customer behavioural data.
- Healthcare sector dashboard adoption increased 30% in 2022–2023. Clinical dashboards enable providers to monitor patient outcomes, bed occupancy, and operational metrics in real time.
- Energy sector dashboards are in use at 69% of utilities. Grid performance, renewable energy output, and demand forecasting are among the key use cases driving energy sector dashboard adoption.
- Government agencies are at 56% dashboard adoption in 2023. Public sector organisations are increasingly deploying dashboards for transparency reporting, budget tracking, and citizen services analytics.
- Education dashboards adopted by 42% of institutions in 2023. Academic dashboards support student performance tracking, institutional KPI monitoring, and administrative efficiency.
⚙️ TECHNOLOGY FEATURES
- Real-time data visualisation is a feature used in 73% of dashboards. Live data feeds have become the standard expectation for modern business dashboards, replacing static daily reports.
- Drag-and-drop functionality is present in 88% of modern dashboards. Low-code design interfaces have democratised dashboard creation, enabling non-technical users to build custom views independently.
- AI-powered insights are integrated in 41–45% of enterprise dashboards in 2023–2024. AI-assisted analytics represent the most significant technology shift in the dashboard software market this decade.
- Customisable widgets are utilised by 92% of dashboard users. Personalisation capabilities are now a baseline expectation, allowing teams to tailor views to specific roles and KPIs.
- Collaborative sharing features are active in 67% of BI dashboards. Team-based analytics workflows are increasingly built around shared dashboard environments that enable real-time commentary and annotation.
- Mobile responsiveness is implemented in 79% of dashboards deployed in 2023. As mobile usage surpasses desktop for dashboard access in some sectors, responsive design has become a non-negotiable feature.
- Predictive analytics modules are used in 35% of advanced dashboards. Forward-looking analytics capabilities are transitioning from premium enterprise features to mainstream expectations.
- Export to PDF/Excel options are available in 95% of tools. Universal export capabilities remain among the most widely used features, bridging the gap between digital dashboards and traditional reporting formats.
- Multi-data source connectivity is present in 82% of dashboards. Modern organisations require dashboards to unify data from CRMs, ERPs, marketing platforms, and databases simultaneously.
- Automated alerts are configured in 58% of operational dashboards. Proactive anomaly detection and threshold-based notifications reduce the need for manual monitoring of business metrics.
🤖 AI & EMERGING TECHNOLOGY TRENDS
- Low-code/no-code dashboard platforms grew 50% in usage from 2023 to 2024. The democratisation of analytics through no-code tools is enabling a new generation of business users to build their own dashboards.
- Real-time data streaming in dashboards is up 62% since 2022. Streaming architectures have fundamentally changed how dashboards ingest data, enabling sub-second updates across live business metrics.
- 55% of dashboards now embed ML models for predictions. Machine learning integration has moved well beyond experimentation, with more than half of enterprise dashboards offering built-in predictive capabilities.
- Natural language querying in dashboards is used by 29–38% of tools in 2023–2024. Conversational interfaces are rapidly eroding the technical barrier to data querying, making dashboards accessible to non-analysts.
- Edge computing for dashboards has reduced latency by 40% on average. Bringing computation closer to data sources is a growing architectural strategy for latency-sensitive dashboard use cases.
- Zero-trust security is adopted in 51% of cloud dashboards. As dashboard tools handle increasingly sensitive business data, enterprise-grade security frameworks are becoming standard requirements.
- Voice-activated dashboard controls exist in 12% of enterprise tools. While still early-stage, voice interaction represents an emerging interface paradigm that several leading vendors are piloting.
- API integrations average 50+ per enterprise dashboard platform. Breadth of integration is now a primary competitive differentiator among leading dashboard vendors.
- Data governance features are present in 76% of modern dashboards. Regulatory requirements and enterprise data management policies have made governance capabilities essential in commercial dashboard products.
- GraphQL APIs power 35% of dashboard backends. The adoption of modern API standards reflects a broader shift toward more flexible and developer-friendly dashboard architectures.
📈 PERFORMANCE BENCHMARKS
- Dashboard load time averages 2.3 seconds for top-performing platforms. Sub-3-second load times are now the performance benchmark that separates tier-1 dashboard vendors from the rest of the market.
- 95% of dashboards achieve under 3-second render times. Rapid rendering has become the performance floor — end users increasingly abandon dashboards that fail to meet this expectation.
- Average query response time in dashboards is 450ms. Near-instantaneous query performance is critical for operational dashboards used in fast-paced business environments.
- Uptime for cloud dashboards exceeds 99.95–99.99% annually. Enterprise-grade SLAs for dashboard availability reflect the mission-critical role these tools now play in daily business operations.
- Scalability has been tested to 10,000 concurrent users in 78% of tools. High-concurrency performance is a must-have specification for dashboards deployed at global enterprise scale.
- Data refresh rate averages 15 seconds in real-time dashboards. Refresh cadence is a key technical differentiator — faster refresh rates translate directly to more timely and actionable insights.
- Memory usage peaks at 250MB for complex dashboard sessions. Understanding resource consumption helps enterprise IT teams plan capacity and optimise dashboard performance.
- CPU utilisation remains under 40–45% during peak dashboard renders. Efficient computational resource management ensures dashboards remain responsive even under heavy analytical workloads.
- Error rate in dashboard data pipelines averages 0.3–0.5%. Low error rates at scale reflect the maturity of modern data pipeline and ETL infrastructure supporting enterprise dashboards.
- Network latency impact on dashboards is minimal at under 100ms for 90% of tools. Optimised network handling enables dashboards to deliver consistent performance across geographically distributed teams.
😊 USER SATISFACTION & PRODUCTIVITY
- 92% of users rate dashboard intuitiveness above 4 out of 5 stars. Exceptional usability scores confirm that leading vendors have successfully prioritised user experience in product development.
- Net Promoter Score for top dashboards averages 65 in 2023. An NPS of 65 places leading dashboard platforms firmly in the “excellent” category — comparable to top-tier SaaS products.
- 76% of users report faster decision-making with dashboards. The primary value proposition of dashboard software — accelerating decisions — is validated by a strong majority of users.
- 94% of users find dashboards improve overall productivity. Near-universal agreement on productivity gains reinforces the ROI case for dashboard software investments.
- 73% of users report a 50%+ reduction in reporting time after adopting dashboards. Automated visualisation and data aggregation dramatically reduce the hours previously spent on manual report creation.
- Overall CSAT for dashboard software is 87% in 2023. Strong customer satisfaction metrics reflect a competitive market where vendors are continuously improving user experience and feature depth.
- 89% user retention rate for dashboard software platforms year-over-year. High retention rates confirm the “sticky” nature of dashboard tools — once embedded in workflows, they are rarely displaced.
- Average Net Promoter Score for Tableau specifically is 72. Tableau’s above-average NPS score highlights its strong user loyalty despite growing competition from platforms like Power BI.
- Power BI users report 89% satisfaction with ease of use. Microsoft’s tight integration with Office 365 ecosystem gives Power BI a significant usability advantage for existing Microsoft enterprise customers.
- 68% of users recommend their primary dashboard tool to peers. High advocacy rates among dashboard users serve as powerful organic growth drivers for market-leading platforms.
💰 SEGMENT REVENUE
- Healthcare dashboard market is valued at USD 1.2 billion in 2023. Growing clinical data volumes and the push toward value-based care are driving sustained investment in healthcare analytics dashboards.
- Retail sector dashboard spending hit USD 800 million in 2023. Retailers are investing significantly in dashboards to navigate omnichannel complexity and increasingly data-driven consumer behaviour.
- Marketing dashboard market reached USD 650 million in 2023. Marketing teams are among the most active dashboard adopters, using real-time tools to optimise campaign performance and spend efficiency.
- Security dashboard market reached USD 1.3 billion in 2023. Cybersecurity dashboards are among the fastest-growing subsegments, driven by escalating threat landscapes and compliance requirements.
- IoT dashboard niche market is forecast to reach USD 800 million by 2025. The explosion of connected devices is creating a distinct and rapidly expanding market for IoT-specific monitoring dashboards.
- HR dashboard adoption boosted the market by 15% in 2023. People analytics and workforce intelligence dashboards are gaining traction as organisations prioritise talent management and retention.
- Self-service dashboard segment is growing at 20% CAGR. Business-user-led analytics adoption is reshaping the competitive landscape, rewarding platforms with intuitive drag-and-drop design tools.
- Dashboard customisation tools market is projected to reach USD 3.5 billion by 2027. The market for theme editors, widget libraries, and custom visualisation tools is growing alongside the core dashboard market.
🏥 SCALE OF IMPACT AT SECTOR LEVEL
- Healthcare dashboards monitor 1.2 billion patient metrics daily. At this scale, real-time clinical dashboards directly influence care quality decisions for hundreds of millions of patients globally.
- Finance sector dashboards process USD 5.3 trillion in transactions visualised daily. The financial system’s reliance on real-time dashboards underlines their role as critical financial infrastructure.
- Retail dashboards track 2.5 billion customer interactions per day globally. Consumer behaviour data at this scale enables retailers to deliver hyper-personalised experiences at mass market speed.
- Manufacturing dashboards reduce downtime by 22% on average. Operational visibility through dashboards translates directly to cost savings and improved production efficiency.
- Education dashboards serve 150 million students worldwide in 2024. At-scale deployment in education systems is enabling data-driven interventions to improve student outcomes.
- Telecom dashboards handle 3.4 trillion call records per month. Telecommunications dashboards are among the highest-volume data processing systems in any commercial sector.
- Sports analytics dashboards are used in 92% of professional leagues. Elite sports organisations have embraced real-time performance dashboards to gain competitive advantages in player analytics.
🔮 OUTLOOK & FUTURE TRENDS
- The Asia-Pacific dashboard market is expected to grow at 18.2–19.5% CAGR from 2024 to 2030 — the highest globally. Southeast Asia, India, and China represent the largest untapped opportunity in global dashboard software expansion.
- Data-driven organisations are 23 times more likely to acquire new customers. The competitive ROI of data-driven strategies continues to be the most compelling argument for dashboard software adoption.
- Dashboard market investment in VC funding reached USD 2.1 billion in 2023. Continued venture capital inflows signal investor conviction that the dashboard software market has significant room to consolidate and grow.
- Dashboard usage among non-technical users increased 40% since 2021. The democratisation of analytics through no-code dashboards is dramatically widening the total addressable user base for dashboard vendors.
- Over 50% of business professionals require mobile access to dashboards for real-time data monitoring. Mobile-first design is no longer a nice-to-have — it is a fundamental deployment requirement for any modern dashboard platform.
- 60% increase in dashboard use among startups between 2021 and 2023. Younger companies are adopting dashboards from day one, normalising analytics culture as a foundational business practice.
- Dashboard analytics tools market CAGR is forecasted at 16.8% through 2028. Sustained high-teens growth through the decade confirms dashboards as one of the most durable growth categories in enterprise software.
Conclusion
The dashboard software industry in 2026 stands at a defining moment, evolving far beyond its origins as a simple reporting and visualization tool into a mission-critical platform that powers real-time, data-driven decision-making across virtually every industry. The 102 statistics presented throughout this report collectively demonstrate that dashboard software has become an essential component of modern digital infrastructure, enabling organizations to transform vast amounts of raw data into meaningful insights that improve operational efficiency, accelerate strategic planning, and create sustainable competitive advantages.
One of the clearest themes emerging from these statistics is the extraordinary pace of market expansion. With the global dashboard software market valued at several billion dollars and forecast to continue growing at double-digit compound annual growth rates throughout the remainder of the decade, demand shows no signs of slowing. Multiple industry forecasts project the market to reach well beyond USD 14 billion by 2030, while broader analytics ecosystem estimates extend beyond USD 30 billion by 2032. Such sustained growth reflects not merely increased software spending but a fundamental shift toward data-centric business operations where dashboards serve as the primary interface for monitoring performance and guiding decisions.
The transition toward cloud-first deployments represents another defining trend shaping the industry. Cloud-based dashboard platforms now dominate enterprise implementations, while on-premise deployments continue their steady decline. Organizations increasingly recognize the benefits of cloud-native architectures, including lower infrastructure costs, faster implementation, automatic updates, greater scalability, and seamless accessibility for distributed teams. The continued rise of SaaS delivery models also demonstrates how recurring subscription platforms have become the preferred purchasing model for organizations seeking flexible and continuously improving analytics capabilities.
Enterprise adoption rates further highlight the maturity of the dashboard software market. Today, dashboards are no longer reserved for large corporations or specialized analytics departments. Instead, they have become an everyday business tool used by executives, analysts, managers, frontline employees, and small business owners alike. Widespread adoption among Fortune 500 companies, increasing penetration among small and medium-sized enterprises, and growing usage across nearly every major industry illustrate that dashboard software has become a standard operational necessity rather than an optional technology investment.
The statistics also reveal that dashboard software delivers measurable business value beyond simply displaying information. Organizations consistently report faster decision-making, significant reductions in manual reporting workloads, improved productivity, and stronger collaboration across departments. Real-time visibility into business performance enables leaders to identify emerging opportunities, detect operational issues before they escalate, and respond more effectively to changing market conditions. High customer satisfaction scores, impressive user retention rates, and strong Net Promoter Scores reinforce the reality that dashboards have become deeply embedded within modern organizational workflows.
Another major takeaway is the increasing sophistication of dashboard technology itself. Modern platforms offer far more than charts and graphs. Features such as real-time data streaming, multi-source data integration, automated alerts, mobile responsiveness, customizable widgets, collaborative workspaces, predictive analytics, and embedded business intelligence have transformed dashboards into comprehensive decision-support systems. Organizations increasingly expect dashboards to unify information from numerous business applications while providing intuitive, highly interactive experiences that simplify complex analytical processes.
Artificial intelligence is arguably the most transformative force influencing dashboard software in 2026. AI-powered insights, machine learning models, natural language querying, anomaly detection, automated forecasting, and conversational analytics are rapidly becoming standard capabilities rather than premium enterprise features. These innovations significantly reduce the technical expertise previously required to analyze complex datasets, enabling a broader range of employees to extract valuable insights independently. As generative AI technologies continue advancing, dashboards are expected to evolve further into intelligent digital assistants capable of proactively identifying risks, recommending actions, and summarizing business performance without requiring manual analysis.
The democratization of analytics represents another significant milestone highlighted throughout these statistics. Low-code and no-code dashboard builders have empowered business users to create customized reports without relying heavily on software developers or IT departments. This shift toward self-service analytics not only accelerates decision-making but also reduces organizational bottlenecks, enabling teams to respond more rapidly to new business opportunities and changing operational requirements. As ease of use continues improving, dashboard adoption will likely expand beyond traditional knowledge workers into virtually every function within an organization.
Industry-specific adoption figures reinforce the universal relevance of dashboard software. Telecommunications companies leverage dashboards to monitor network infrastructure at enormous scale, financial institutions depend on real-time visualization for compliance and risk management, manufacturers reduce equipment downtime through operational dashboards, retailers optimize omnichannel performance using live customer data, healthcare organizations monitor patient outcomes through clinical dashboards, and logistics companies coordinate increasingly complex supply chains using real-time operational intelligence. These examples illustrate that dashboard software is no longer tied to a single industry but has become foundational technology supporting nearly every sector of the global economy.
Regional market dynamics also suggest substantial future opportunities. While North America continues to dominate global market share due to its mature technology ecosystem and enterprise software adoption, Asia-Pacific is expected to experience the fastest growth over the coming years. Rapid digital transformation initiatives, expanding cloud infrastructure, increasing smartphone penetration, government-led modernization efforts, and accelerating enterprise technology investments throughout countries such as China, India, and Southeast Asia are expected to drive significant new demand for dashboard platforms across both public and private sectors.
The competitive landscape is also becoming increasingly dynamic. Established vendors continue enhancing their offerings through AI integration, advanced analytics, embedded business intelligence, and expanded cloud capabilities, while emerging startups introduce innovative approaches to visualization, collaboration, automation, and industry-specific solutions. Venture capital investment remains strong, signaling continued confidence that dashboard software will remain one of the fastest-growing categories within enterprise software over the coming decade.
Performance expectations are simultaneously rising. Modern organizations increasingly demand dashboards capable of delivering sub-second query responses, near-perfect uptime, support for thousands of concurrent users, and seamless integration across dozens of enterprise systems. As organizations collect exponentially larger datasets through IoT devices, cloud applications, AI systems, and digital customer interactions, dashboard platforms will need to continue improving their scalability, efficiency, and reliability to support increasingly complex analytical workloads.
Security and governance have likewise emerged as central priorities. As dashboards aggregate sensitive financial, operational, customer, and employee information, organizations expect robust access controls, zero-trust security architectures, comprehensive audit capabilities, and sophisticated data governance frameworks. These requirements will continue influencing vendor development priorities as compliance regulations become increasingly stringent worldwide.
Looking beyond 2026, dashboard software is expected to become even more intelligent, automated, and deeply integrated into daily business operations. Advances in generative AI, autonomous analytics, predictive decision support, edge computing, real-time streaming architectures, voice interfaces, and contextual business intelligence will fundamentally reshape how organizations interact with information. Rather than simply displaying historical metrics, future dashboards will increasingly anticipate user needs, surface hidden opportunities, identify emerging risks, recommend corrective actions, and automate routine analytical tasks before users even ask for them.
Ultimately, the statistics presented in this report paint a clear picture of an industry experiencing sustained innovation, accelerating adoption, and expanding strategic importance. Dashboard software is no longer simply a reporting solution; it has become the operational intelligence layer that connects people, processes, applications, and data into a unified decision-making ecosystem. Organizations that invest in modern dashboard platforms and cultivate data-driven cultures will be better positioned to improve operational efficiency, enhance customer experiences, identify growth opportunities, and respond more effectively to rapidly changing business environments.
As digital transformation, artificial intelligence, cloud computing, and real-time analytics continue reshaping industries worldwide, dashboard software will remain one of the most influential technologies driving enterprise innovation. Whether you are evaluating dashboard platforms, benchmarking your organization’s analytics maturity, monitoring industry developments, or planning future technology investments, the insights contained within these Top 102 Dashboard Software Statistics, Data & Trends in 2026 provide a valuable foundation for understanding where the market stands today—and where it is headed next. Organizations that embrace these evolving trends and leverage dashboards as strategic decision-making platforms will be well positioned to thrive in an increasingly competitive, data-driven global economy.
If you find this article useful, why not share it with your hiring manager and C-level suite friends and also leave a nice comment below?
We, at the 9cv9 Research Team, strive to bring the latest and most meaningful data, guides, and statistics to your doorstep.
To get access to top-quality guides, click over to 9cv9 Blog.
To hire top talents using our modern AI-powered recruitment agency, find out more at 9cv9 Modern AI-Powered Recruitment Agency.
People Also Ask
What is dashboard software?
Dashboard software is a platform that visualizes business data through charts, graphs, and KPIs, helping organizations monitor performance and make faster, data-driven decisions in real time.
How large is the dashboard software market in 2026?
The dashboard software market is worth several billion dollars in 2026 and continues to expand rapidly, driven by cloud adoption, AI-powered analytics, and enterprise digital transformation.
What is driving dashboard software market growth?
Cloud computing, business intelligence adoption, AI integration, real-time analytics, and increasing demand for data-driven decision-making are the primary growth drivers.
Why is dashboard software important for businesses?
Dashboard software centralizes data from multiple sources, enabling organizations to monitor KPIs, identify trends, improve productivity, and make informed strategic decisions.
Which industries use dashboard software the most?
Dashboard software is widely used in finance, healthcare, retail, manufacturing, logistics, telecommunications, education, government, and technology sectors.
How many businesses use dashboard software?
A growing majority of medium and large enterprises use dashboard software, while adoption among small businesses continues to rise due to affordable cloud solutions.
What are the biggest dashboard software trends in 2026?
Major trends include AI-powered dashboards, predictive analytics, embedded BI, no-code dashboard builders, mobile accessibility, and real-time data visualization.
How is AI changing dashboard software?
AI automates insight generation, detects anomalies, forecasts trends, enables natural language queries, and helps users analyze complex datasets with minimal technical expertise.
What is cloud dashboard software?
Cloud dashboard software is hosted online, allowing users to access dashboards securely from anywhere without maintaining on-premise infrastructure.
What are the benefits of real-time dashboards?
Real-time dashboards provide instant visibility into business performance, enabling faster responses, improved operational efficiency, and more informed decision-making.
What features should modern dashboard software include?
Key features include customizable dashboards, data integration, KPI tracking, AI insights, collaboration tools, mobile access, alerts, and advanced visualization.
What is business intelligence dashboard software?
Business intelligence dashboard software combines analytics, reporting, and visualization to help organizations understand data and improve business performance.
How does dashboard software improve productivity?
It reduces manual reporting, automates data updates, simplifies analysis, and allows employees to focus on strategic tasks instead of compiling spreadsheets.
Is dashboard software suitable for small businesses?
Yes. Modern SaaS dashboard platforms offer affordable pricing, simple deployment, and scalable features designed specifically for small and growing businesses.
What is embedded dashboard software?
Embedded dashboards integrate analytics directly into business applications, enabling users to access insights without switching between multiple platforms.
How secure is dashboard software?
Leading dashboard platforms offer encryption, role-based access, audit logs, multi-factor authentication, and compliance features to protect sensitive business data.
What is the future of dashboard software?
Future dashboards will become increasingly intelligent through AI, automation, predictive analytics, conversational interfaces, and personalized recommendations.
Which regions are driving dashboard software growth?
North America remains the largest market, while Asia-Pacific is projected to experience the fastest growth due to accelerating digital transformation.
How does dashboard software support decision-making?
It consolidates data into easy-to-understand visualizations, allowing leaders to identify trends, monitor KPIs, and respond quickly to changing business conditions.
What is a KPI dashboard?
A KPI dashboard displays key performance indicators that help organizations monitor progress toward business goals using real-time metrics and visual reports.
Why are cloud dashboards replacing on-premise systems?
Cloud dashboards offer lower costs, easier maintenance, automatic updates, greater scalability, and remote accessibility compared to traditional on-premise deployments.
Can dashboard software integrate with other business tools?
Yes. Most platforms integrate with CRM systems, ERP software, databases, cloud storage, marketing platforms, accounting software, and productivity applications.
How does dashboard software support digital transformation?
It enables organizations to centralize data, automate reporting, improve transparency, and make faster decisions that support digital transformation initiatives.
What role does mobile dashboard software play?
Mobile dashboards provide executives and teams with instant access to business insights from smartphones and tablets, supporting remote and hybrid work environments.
How does predictive analytics improve dashboards?
Predictive analytics forecasts future outcomes using historical data, helping organizations anticipate trends, reduce risks, and optimize business planning.
What are self-service dashboards?
Self-service dashboards allow non-technical users to create reports, analyze data, and customize visualizations without relying on IT or data specialists.
How competitive is the dashboard software market?
The market is highly competitive, with established BI vendors and innovative startups continuously introducing AI-powered features and advanced analytics capabilities.
Why are dashboard software statistics valuable?
They help businesses, investors, analysts, and technology leaders understand market trends, adoption rates, investment opportunities, and future growth potential.
What should businesses consider when choosing dashboard software?
Organizations should evaluate scalability, integrations, AI capabilities, pricing, security, customization, ease of use, reporting features, and customer support.
Where can I find the latest dashboard software statistics for 2026?
Comprehensive reports compiling verified dashboard software statistics, market trends, adoption data, AI developments, and forecasts provide the most reliable industry insights.
Sources
The Business Research Company WifiTalents GitNux Future Market Report DataIntelo 360iResearch marketresearch.biz GII Research