


")


")


Key Takeaways
- The top 10 diagram software in the world in 2026 combine AI-powered diagram generation, real-time collaboration, and enterprise-grade security compliance.
- Leading diagram tools now integrate data linking, automation workflows, and infinite canvas workspaces to support digital transformation at scale.
- Choosing the best diagram software in 2026 depends on enterprise governance needs, creative collaboration requirements, and total cost of ownership.
The global demand for diagram software in 2026 has reached unprecedented levels, driven by digital transformation, hybrid work environments, cloud infrastructure expansion, and the rapid adoption of artificial intelligence across industries. What was once considered a basic productivity utility for drawing flowcharts has evolved into a mission-critical platform category that powers enterprise strategy, IT architecture, product innovation, and operational clarity. Today, the top 10 diagram software in the world in 2026 represent far more than digital drawing tools; they function as intelligent visual collaboration ecosystems that connect ideation, execution, compliance, and data-driven decision-making.

Organizations across sectors including technology, finance, healthcare, manufacturing, education, and government now rely heavily on advanced diagram tools to manage complexity. From business process modeling and UML diagrams to infrastructure mapping, mind mapping, workflow automation, and strategic planning, modern diagram software plays a central role in enabling teams to communicate ideas visually and execute them efficiently. As enterprises scale globally and teams collaborate across time zones, the need for secure, cloud-based, AI-powered diagram platforms has become essential.
The diagram software market in 2026 reflects a fundamental shift from static documentation to dynamic visual intelligence. Leading platforms now integrate real-time collaboration, API connectivity, live data imports, compliance certifications such as SOC 2 and ISO 27001, and AI-assisted diagram generation. These innovations allow teams to transform raw information into structured visual systems that update automatically and remain aligned with operational workflows. Instead of isolated files stored on individual desktops, organizations now operate within shared infinite canvases that unify brainstorming, structured modeling, and task execution.
Another defining trend shaping the top diagram software platforms in 2026 is the convergence of whiteboarding and structured diagramming. Creative teams demand fluid, collaborative environments that support large-scale workshops, product discovery sessions, and design sprints. At the same time, enterprise IT departments require precision, compliance-ready documentation, and advanced administrative controls. The best diagram software solutions successfully bridge these requirements, delivering flexibility without sacrificing governance.
Security and compliance have also become decisive factors in software selection. As regulatory pressure increases worldwide, organizations prioritize diagram tools that guarantee data protection, encryption standards, uptime reliability, and regional data storage options. For many enterprises, a platform’s compliance posture is just as important as its feature set. This shift has elevated diagram software from a simple productivity tool to a core component of enterprise infrastructure.
Artificial intelligence is further redefining the category. In 2026, AI-powered diagram tools can generate flowcharts, mind maps, and process diagrams from natural language prompts, automatically align complex layouts, cluster ideas intelligently, and extract insights from structured data. These capabilities reduce manual effort, accelerate planning cycles, and enhance decision-making accuracy. As AI becomes more embedded within visual collaboration platforms, diagram software is increasingly positioned as a productivity multiplier rather than a passive documentation utility.
Cost structure and deployment flexibility are also key considerations in the modern diagram software landscape. While many vendors operate on subscription-based SaaS models, others offer perpetual licenses or open-source frameworks to serve budget-conscious teams and startups. Cross-platform compatibility across Windows, macOS, Linux, and web browsers ensures accessibility regardless of device environment. Mobile optimization and offline capabilities further expand usability for distributed teams.
This comprehensive guide to the top 10 diagram software in the world in 2026 explores the platforms that are leading this transformation. It evaluates their strengths across AI integration, collaboration scalability, technical diagram precision, enterprise governance, compliance maturity, pricing models, and ecosystem compatibility. Whether your organization requires advanced UML modeling, infinite canvas brainstorming, infrastructure mapping, or knowledge management visualization, selecting the right diagram software has become a strategic decision with measurable operational impact.
In an era where visual clarity determines execution speed and organizational alignment, diagram software stands at the intersection of communication, automation, and innovation. The platforms featured in this analysis represent the global leaders shaping how businesses conceptualize complexity, structure ideas, and translate strategy into action.
Before we venture further into this article, we would like to share who we are and what we do.
About 9cv9
9cv9 is a business tech startup based in Singapore and Asia, with a strong presence all over the world.
With over nine years of startup and business experience, and being highly involved in connecting with thousands of companies and startups, the 9cv9 team has listed some important learning points in this overview of the Top 10 Best Diagram Software To Try in 2026.
If you like to get your company listed in our top B2B software reviews, check out our world-class 9cv9 Media and PR service and pricing plans here.
Top 10 Best Diagram Software To Try in 2026
- Microsoft Visio
- Miro
- Lucidchart
- SmartDraw
- EdrawMax
- FigJam
- Creately
- draw.io (diagrams.net)
- Gliffy
- MindManager
1. Microsoft Visio
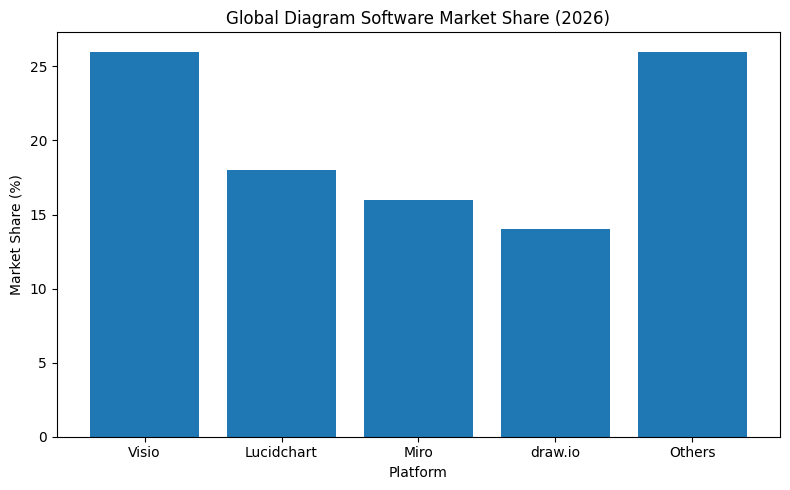
Microsoft Visio continues to maintain its leadership position in 2026 as the most widely deployed enterprise diagramming solution globally. With an estimated 26 percent market share and penetration exceeding 70 percent within large enterprises, it remains the default diagramming tool in Microsoft-centric corporate environments.
Its dominance stems from three strategic strengths:
Deep integration with Microsoft 365
Comprehensive support for standardized modeling notations such as BPMN 2.0 and UML 2.5
Robust desktop-based technical drafting capabilities
Unlike many cloud-first competitors, Visio bridges traditional desktop engineering requirements with modern web-based collaboration. This hybrid positioning makes it particularly attractive for organizations with structured IT governance frameworks.
Microsoft Visio Feature Matrix
| Capability Area | Technical Specification | Business Value |
|---|---|---|
| Shape Libraries | 250,000+ industry-specific shapes | Supports detailed technical and operational diagrams |
| Standards Compliance | BPMN 2.0, UML 2.5, ISO frameworks | Enables regulatory-aligned documentation |
| Microsoft Ecosystem | Integration with Excel, Teams, Power Automate | Seamless workflow alignment within Microsoft stack |
| Data Linking | Real-time SQL, Excel, and Azure connectivity | Dynamic, data-driven visualization |
| Automation Integration | Workflow triggering via Power Automate | Converts diagrams into executable process flows |
| Desktop Technical Drafting | Advanced network and engineering diagram support | Suitable for complex enterprise architecture |
Pricing Structure Overview
| Licensing Model | Included Features | Cost Structure |
|---|---|---|
| Microsoft 365 Basic | Core web diagramming features | Included in selected business plans |
| Plan 1 | Browser-based professional diagramming | Per user monthly subscription |
| Plan 2 | Full desktop and web access with advanced capabilities | Higher-tier subscription pricing |
| Professional 2024 | One-time perpetual desktop license | Single purchase fee |
Strengths and Limitations in Enterprise Context
Strengths
| Strength Category | Enterprise Advantage |
|---|---|
| IT Infrastructure Mapping | Native AWS and Azure stencils |
| Enterprise Governance | Structured modeling support |
| Data Integration | Real-time linking to databases |
| Microsoft Ecosystem Fit | Seamless collaboration within existing corporate tools |
Limitations
| Limitation Area | Observed Challenge |
|---|---|
| User Interface Modernity | Interface perceived as dated compared to whiteboard tools |
| Web Version Capability | Reduced advanced features compared to desktop application |
| Mac Native Support | Lack of full desktop client for macOS users |
| Real-Time Collaboration | Slower co-editing performance versus cloud-native rivals |
Independent User Perspective
A detailed review from a corporate professional operating within a 500+ employee organization highlights the platform’s dual nature. The reviewer acknowledges Visio’s strength in technical documentation, decision tree modeling, and floor plan design. Integration within Microsoft 365 is described as seamless, and the availability of cloud infrastructure stencils is praised.
However, the web-based edition is viewed as significantly limited when compared to the desktop version, particularly for advanced network architecture modeling. The interface is characterized as highly functional but visually outdated relative to modern collaborative whiteboarding platforms. Manual connector adjustments in complex diagrams can become time-intensive. Additionally, macOS users face limitations due to the absence of a fully native desktop application.
Comparative Positioning Against Cloud-Native Competitors
| Evaluation Criteria | Microsoft Visio | Cloud-Native Competitors |
|---|---|---|
| Desktop Engineering Depth | High | Moderate |
| Real-Time Collaboration | Moderate | High |
| UI Modernity | Traditional | Modern |
| Automation Integration | Advanced (Microsoft) | Varies by vendor |
| Enterprise Governance Fit | Strong | Moderate to Strong |
Strategic Outlook for 2026
Microsoft Visio’s 2026 strategic direction centers on “organizational visualizations,” aiming to convert diagrams into operational assets. Integration with automation platforms enables diagrams to trigger workflows, bridging the gap between documentation and execution.
While agile cloud-first platforms continue to innovate rapidly in collaboration and design experience, Visio’s stronghold in enterprise IT departments remains resilient. For Windows-dominant enterprises with structured governance requirements, it continues to function as a mission-critical visualization platform.
In the broader context of the top 10 diagram software platforms globally, Visio represents the structured, compliance-driven enterprise archetype, while emerging competitors represent collaborative, cloud-native innovation. Together, they define the competitive dynamics of the diagram software market in 2026.
2. Miro
In 2026, Miro stands as one of the most influential cloud-native diagram and collaboration platforms in the world. What began as a digital whiteboard has evolved into a comprehensive innovation workspace designed to support product development, agile workflows, design thinking, and distributed team collaboration at global scale.
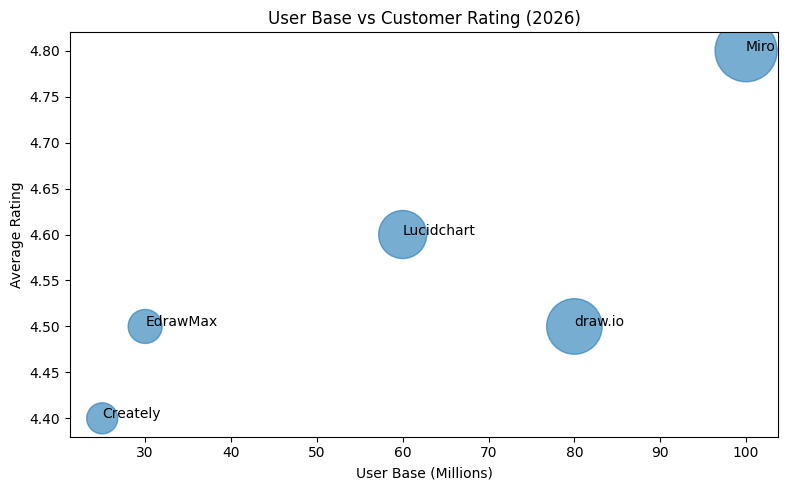
With a reported user base exceeding 100 million professionals and more than 250,000 paying customers worldwide, including nearly all Fortune 100 enterprises, Miro has positioned itself as the preferred collaboration layer for modern organizations operating in hybrid and remote-first environments. Its strategic shift from whiteboarding to structured innovation management reflects the broader transformation of diagram software into real-time operational ecosystems.
Market Position and Strategic Evolution
Miro’s competitive differentiation in 2026 centers on three pillars:
Infinite Canvas Architecture
AI-First Design Philosophy
Community-Driven Template Ecosystem
Unlike traditional diagram software that confines users to page-based layouts, Miro’s infinite canvas enables teams to scale visual collaboration without structural boundaries. This flexibility has made it especially attractive for design sprints, product discovery sessions, architecture mapping, and enterprise transformation initiatives.
At the same time, Miro has embedded generative AI capabilities directly into the board experience. The workspace itself acts as a prompt layer, enabling users to generate flowcharts, mind maps, summaries, and structured workflows from simple text instructions.
Global Adoption Metrics
| Performance Indicator | Reported Metric | Market Significance |
|---|---|---|
| Total User Base | 100M+ global users | Broad cross-industry adoption |
| Enterprise Penetration | 99% of Fortune 100 | Strong enterprise credibility |
| Paying Customers | 250,000+ organizations | Sustainable recurring revenue base |
| Customer Satisfaction | High NPS, nearly double legacy competitors | Strong brand loyalty and advocacy |
| Platform Ratings | 4.8/5 average across review platforms | Consistent positive user feedback |
Miro’s high satisfaction metrics highlight its strong usability, collaboration features, and continuous innovation cycle, particularly compared to legacy desktop-based diagramming tools.
Feature and Capability Overview
| Capability Area | Functional Offering | Business Impact |
|---|---|---|
| Infinite Canvas | Boundless visual workspace | Supports large-scale ideation and system mapping |
| AI-Assisted Diagramming | Flowchart and mind map generation from prompts | Accelerates planning and reduces manual effort |
| Video Collaboration | Integrated video chat and Talktrack walkthroughs | Enables asynchronous architectural reviews |
| Template Marketplace | 2,500+ expert-created templates via Miroverse | Rapid adoption of best-practice workflows |
| Technical Diagram Support | UML, AWS, Kubernetes shape libraries | Expands relevance to engineering teams |
| Cloud Cost Estimation | AWS Cost Calculator integrated into infrastructure maps | Enables real-time architectural cost modeling |
The Miroverse template ecosystem has become a key growth driver. With thousands of expert-developed templates, teams can adopt structured frameworks such as design sprints, OKR planning, user journey mapping, and agile retrospectives instantly, reducing onboarding friction.
Pricing Structure Overview
| Pricing Tier | Key Inclusions | Annual Billing Structure |
|---|---|---|
| Free | 3 editable boards | No cost |
| Starter | Core collaboration features | Per user monthly subscription |
| Business | Advanced integrations and governance controls | Higher per user monthly pricing |
| Enterprise | SSO, advanced security, custom configurations | Custom enterprise contract |
The freemium entry model has contributed significantly to viral adoption within organizations, allowing individual teams to experiment before scaling enterprise-wide.
Comparative Strength Matrix
| Evaluation Criteria | Miro Performance Level | Competitive Positioning |
|---|---|---|
| Real-Time Collaboration | Very High | Industry-leading |
| AI Integration | Advanced and embedded | Ahead of most legacy competitors |
| Technical Diagram Rigor | Moderate | Less structured than dedicated diagram tools |
| Template Ecosystem | Extensive community-driven | Strong network effect |
| Enterprise Governance | Strong at enterprise tier | Competitive with major SaaS platforms |
Independent User Perspective
A detailed professional review highlights Miro’s role as a central collaboration engine for cross-functional teams. Users report that it seamlessly supports workflows from early discovery to final product delivery within a unified visual space. AI features such as automated flowchart and mind map generation help maintain creative momentum and reduce friction during planning sessions.
The built-in video chat and Talktrack capabilities are frequently cited as essential tools for asynchronous communication. Teams can record detailed architectural walkthroughs, enabling colleagues in different time zones to review complex diagrams independently.
However, the same infinite canvas that enables flexibility can also introduce structural challenges. On extremely large boards containing thousands of elements, performance degradation may occur. Additionally, without governance discipline, boards can become cluttered and difficult to navigate. Compared to more rigid diagramming platforms, Miro’s auto-alignment and structured formatting tools are less strict, which may result in technical diagrams appearing less polished.
Operational Trade-Off Analysis
| Strength Dimension | Advantage | Associated Trade-Off |
|---|---|---|
| Infinite Canvas | Unlimited creative space | Risk of disorganization at scale |
| AI Workflow Generation | Faster ideation and diagram drafting | Requires user prompt discipline |
| Asynchronous Collaboration | Video walkthrough and commentary tools | Larger boards may impact loading speed |
| Community Templates | Rapid framework deployment | Template quality varies by contributor |
Strategic Outlook for 2026
Miro’s transformation into a full innovation workspace reflects a broader shift in the diagram software market. Visualization tools are no longer isolated drafting utilities; they are becoming strategic orchestration platforms that integrate ideation, technical modeling, and execution.
By embedding AI directly into the collaborative canvas and expanding into technical diagram support such as cloud infrastructure mapping and cost estimation, Miro is narrowing the gap between whiteboarding and structured system design.
In the broader ranking of the top diagram software platforms globally in 2026, Miro represents the collaborative, cloud-native innovation leader. While it may not fully replace structured enterprise drafting tools in highly regulated environments, it dominates the modern product development and distributed collaboration segment of the market.
3. Lucidchart
In 2026, Lucidchart stands as one of the most advanced intelligent diagramming platforms in the global software market. As a core product within the Lucid Visual Collaboration Suite, Lucidchart has successfully positioned itself between structured enterprise diagramming tools and modern collaborative whiteboards. It is widely regarded as the most viable alternative to Microsoft-centric diagram platforms for organizations that require high levels of structure, data precision, and system integration.
Lucidchart’s strength lies in its ability to merge visual modeling with live data connectivity. Rather than serving as a static drawing tool, it enables dynamic, automatically updating diagrams powered by external data sources. This focus on structured visualization has driven strong adoption among technical teams, IT departments, product managers, and business analysts.
Market Position and Adoption Trends
Lucidchart is particularly popular among enterprises that require professional-grade diagrams with governance, integration, and automation capabilities. Industry research indicates that approximately 95 percent of enterprise users would recommend the platform, citing usability, structure, and reliability as primary drivers of satisfaction.
Unlike free-form whiteboard tools that prioritize brainstorming flexibility, Lucidchart emphasizes precision, alignment, and intelligent formatting.
Enterprise Adoption Indicators
| Performance Indicator | Market Insight | Strategic Significance |
|---|---|---|
| Enterprise Recommendation | Approximately 95% user endorsement | High satisfaction in structured environments |
| Primary User Segments | IT teams, data analysts, system architects | Strong technical market penetration |
| Alternative to Legacy Tools | Frequently selected over desktop-based diagram software | Cloud-first modernization path |
| Template Library Strength | Extensive structured template catalog | Accelerated enterprise onboarding |
Intelligent Diagramming and Data Integration
Lucidchart differentiates itself through advanced data-linking and conditional formatting features. Users can import data from spreadsheets, databases, and automation tools to generate diagrams that update automatically when source data changes.
This functionality transforms diagrams into live analytical assets rather than static documentation.
Core Data Integration Capabilities
| Capability Area | Technical Implementation | Business Outcome |
|---|---|---|
| Spreadsheet Integration | Live import from Excel and Google Sheets | Real-time visualization of operational metrics |
| Database Connectivity | SQL schema import and ERD auto-generation | Automated system architecture mapping |
| Workflow Automation | Zapier-based data synchronization | Cross-platform process visualization |
| Conditional Formatting | Data-triggered visual indicators | Rapid identification of risks and anomalies |
| Smart Line Routing | Automated connector adjustments | Clean and professional diagram layouts |
Lucidchart’s automated Entity Relationship Diagram (ERD) import is particularly valuable for engineering and database teams. Instead of manually constructing schema relationships, teams can import database structures directly and allow the system to generate visual models automatically.
Feature Overview and Pricing Structure
| Feature Category | Functional Detail | Annual Pricing Tier |
|---|---|---|
| Data Import | Excel, SQL, Google Sheets, Zapier integration | Free: 3 documents, 60 shapes per doc |
| Visio Compatibility | Import and export of .vsdx and .vdx formats | Individual Plan: Monthly subscription |
| Real-Time Collaboration | Multi-user co-authoring with comments and sharing | Team Plan: Per user monthly pricing |
| Enterprise Governance | Admin controls, SSO, IP whitelisting | Enterprise Plan: Custom contract |
| Template Library | Structured industry-specific templates | Included across paid tiers |
The platform’s compatibility with Visio file formats has contributed to enterprise migration from legacy desktop tools. Organizations transitioning to cloud-native environments can maintain file continuity while modernizing collaboration workflows.
Comparative Strength Matrix
| Evaluation Criteria | Lucidchart Performance Level | Competitive Positioning |
|---|---|---|
| Structured Diagram Precision | Very High | Stronger alignment than free-form tools |
| Data Linking Capability | Advanced | Industry-leading dynamic diagram updates |
| Ease of Adoption | High | Lower learning curve than legacy tools |
| Real-Time Collaboration | Strong | Competitive with modern SaaS platforms |
| Visual Modernity | Moderate | Less design-centric than innovation boards |
Independent User Perspective
Professional feedback consistently highlights Lucidchart as the preferred platform for structured and professional diagram creation. Users report that the interface is clean and intuitive, making onboarding significantly easier for new employees compared to traditional desktop diagram tools.
The automated ERD import feature is frequently praised for its efficiency. Technical teams can import database schemas and instantly generate visual relationship diagrams, eliminating manual drafting time. Smart line routing is also considered a major productivity enhancer, as connectors remain attached and automatically adjust when shapes are repositioned, preserving diagram clarity.
However, some users note limitations in the free tier, describing it as highly restrictive for serious usage. Mobile editing functionality is also considered less robust compared to desktop or browser environments. Additionally, while the interface is clean, some users perceive it as less visually modern than more design-oriented platforms like collaborative whiteboards.
Operational Trade-Off Analysis
| Strength Dimension | Competitive Advantage | Observed Limitation |
|---|---|---|
| Structured Layout Engine | Professional-grade technical diagrams | Less free-form creativity |
| Automated Schema Import | Rapid database visualization | Requires structured source data |
| Smart Line Routing | Maintains clean formatting automatically | Complex diagrams may require manual fine-tuning |
| Data-Driven Updates | Live synchronization with data sources | Advanced features limited in free tier |
| Enterprise Governance | Strong security and administrative controls | Higher pricing for advanced enterprise features |
Strategic Position in the 2026 Diagram Software Market
Lucidchart occupies a unique position in the 2026 diagram software ecosystem. It bridges the gap between rigid enterprise modeling platforms and free-form innovation workspaces. For organizations that require technical rigor, live data connectivity, and clean automated formatting, Lucidchart delivers a balanced solution that emphasizes intelligence over aesthetic flexibility.
Within the top diagram software platforms globally, Lucidchart represents the structured cloud-native leader in intelligent data visualization. It excels in environments where diagrams are not only communication tools but operational representations of live systems.
4. SmartDraw
In 2026, SmartDraw has solidified its position as a leading automation-driven diagram software platform designed for speed, accuracy, and professional-grade scaled drawings. Unlike traditional CAD systems that require extensive technical training, SmartDraw focuses on intelligent automation that allows users to create complex layouts quickly without sacrificing structural precision.
The platform is particularly popular among facilities managers, architects, operations teams, legal professionals, and safety planners who require standardized documentation without the overhead of full-scale CAD software. Its core value proposition lies in predictive drawing automation, automatic alignment, and industry-standard symbol libraries that significantly reduce drafting time.
Market Position and Strategic Focus
SmartDraw occupies a distinct segment within the global diagram software ecosystem. Rather than competing primarily on free-form collaboration or innovation workspaces, it emphasizes structured drawing automation and scaled layout precision.
This positioning makes it especially relevant in industries such as:
Facilities management
Construction planning
Fire safety compliance
Warehouse logistics
Accident reconstruction
Site planning
Its expansion in early 2026, including over 750 new residential and commercial floor plan symbols and updates to its accident reconstruction library, demonstrates a clear focus on vertical specialization.
Core Automation Capabilities
SmartDraw’s automation engine differentiates it from traditional diagram platforms. The system anticipates user actions, automatically adjusts connectors, maintains alignment, and ensures scale consistency.
| Capability Area | Technical Functionality | Business Impact |
|---|---|---|
| Predictive Drawing Engine | Anticipates placement and automatically adjusts connectors | Faster diagram completion with fewer manual corrections |
| Auto-Alignment System | Maintains proportional spacing and alignment | Professional presentation quality |
| Scaled Floor Planning | Accurate dimensioning and scaling tools | Reliable architectural and facility documentation |
| Symbol Intelligence | Context-aware shape suggestions | Reduced design errors |
| Automated Layout Adjustment | Dynamic repositioning of objects as diagrams expand | Clean structure even in complex layouts |
Industry-Specific Content Library
SmartDraw’s emphasis on standardized symbols is a core strength. The platform includes thousands of industry-compliant elements across vertical use cases.
| Industry Application | Available Content Library | Practical Use Case |
|---|---|---|
| Residential Floor Plans | Lighting, doors, exteriors, HVAC components | Building and remodeling planning |
| Commercial Architecture | Office layouts, warehouse racking, emergency exits | Facilities management and compliance |
| Legal Proceedings | Accident reconstruction symbols and diagrams | Courtroom documentation |
| Fire Safety Planning | Fire safety pre-plan symbols and response mapping | Regulatory compliance and risk mitigation |
| Network Infrastructure | IT network topology symbols | Technical system visualization |
The 2026 symbol expansion enhances the platform’s credibility for professional-grade documentation, allowing non-CAD experts to produce outputs that meet industry expectations.
Feature and Pricing Overview
| Key Capability | Specification | Annual Pricing Tier |
|---|---|---|
| Automation | Auto-alignment and predictive drawing engine | Individual: Monthly subscription |
| CAD Compatibility | Import PDF and Google Maps for scaled reference | Team: Per user monthly (minimum users) |
| Symbol Library | Thousands of industry-standard symbols | Included across plans |
| Collaboration | Slack, Microsoft Teams, Google Drive, Box integration | Enterprise: Dedicated support options |
| Administrative Control | Centralized management for teams | Enterprise-level configuration |
Unlike some competitors that focus on free-tier adoption, SmartDraw’s pricing model is structured around professional use cases, particularly for teams requiring standardized documentation across multiple departments.
Comparative Positioning in 2026
| Evaluation Criteria | SmartDraw Performance Level | Competitive Positioning |
|---|---|---|
| Speed of Diagram Creation | Very High | Among the fastest in structured drawing |
| Scaled Precision | High | Strong alternative to lightweight CAD tools |
| Free-Form Collaboration | Moderate | Less flexible than innovation whiteboards |
| UI Modernity | Functional | Less visually modern than design-centric tools |
| Industry-Specific Content | Extensive | Strong vertical specialization |
Independent User Perspective
Professional feedback consistently highlights SmartDraw’s role as a standardization engine within operational environments. One reviewer describes transitioning from fragmented documentation stored in word processing files and slide decks to a centralized diagram platform that improved clarity and efficiency.
The ability to design precise facility and warehouse layouts without CAD training is cited as a major advantage. Newly introduced symbols for lighting systems and building exteriors have enhanced the professional appearance of diagrams, enabling non-specialists to produce expert-level outputs.
However, some advanced features require an initial learning investment. While the interface is considered functional and efficient, it lacks the aesthetic refinement of some purely cloud-native platforms. Nevertheless, users emphasize that for scaled drawings requiring speed and structural accuracy, SmartDraw delivers unmatched efficiency.
Operational Trade-Off Analysis
| Strength Dimension | Competitive Advantage | Observed Limitation |
|---|---|---|
| Automation Engine | Rapid diagram production with minimal manual adjustments | Advanced tools may require onboarding time |
| Scaled Drawing Capability | Professional-grade architectural layouts | Less suited for open-ended brainstorming |
| Industry Content Libraries | Extensive standardized symbol sets | Focused primarily on structured documentation |
| Setup and Administration | Easy deployment and centralized management | Smaller ecosystem compared to large SaaS platforms |
Strategic Outlook for the Diagram Software Market
In the broader context of the top diagram software platforms in 2026, SmartDraw represents the automation-first precision category. While innovation workspaces focus on collaboration and legacy enterprise tools emphasize governance, SmartDraw concentrates on structured speed and predictable outputs.
For organizations that require scaled floor plans, compliance documentation, warehouse layouts, and accident reconstruction diagrams, SmartDraw offers a compelling balance between accessibility and professional accuracy. Its automation-driven engine continues to reduce dependency on specialized CAD training, positioning it as a powerful operational documentation tool in the modern enterprise landscape.
5. EdrawMax
In 2026, EdrawMax by Wondershare has established itself as one of the most versatile and cost-efficient diagram software platforms in the global market. Positioned as an all-in-one diagramming utility, EdrawMax supports more than 210 diagram types, covering everything from circuit schematics and engineering layouts to Gantt charts, mind maps, organizational charts, and Piping and Instrumentation Diagrams (P&ID).
Its strongest differentiator in the current market cycle is its advanced AI-powered toolkit combined with a perpetual licensing model. While most diagram software platforms operate exclusively on recurring subscription plans, EdrawMax offers a one-time purchase option, making it particularly attractive to budget-conscious teams, educational institutions, and technical professionals seeking long-term value.
Market Position and Strategic Differentiation
EdrawMax occupies a hybrid position within the 2026 diagram software ecosystem. It combines technical depth typically found in specialized engineering tools with general-purpose diagram flexibility.
Its value proposition can be summarized across three pillars:
Comprehensive diagram type coverage
AI-assisted generation and enhancement tools
Cross-platform deployment with perpetual licensing
Unlike innovation-centric whiteboard platforms or enterprise-governed diagram suites, EdrawMax focuses on breadth, customization, and affordability.
Comprehensive Diagram Coverage
With support for over 210 diagram categories, EdrawMax is among the most extensive multi-format diagram platforms available.
| Diagram Category | Examples Included | Primary User Segment |
|---|---|---|
| Engineering & Technical | P&ID, circuit diagrams, ERD, network topology | Engineers and system architects |
| Project Management | Gantt charts, timelines, workflow charts | Project managers |
| Business Documentation | Org charts, SWOT diagrams, strategy maps | Business analysts and consultants |
| Floor and Facility Planning | Building layouts, fire escape plans | Facilities teams |
| IT Infrastructure | Server racks, cloud architecture diagrams | IT operations teams |
| Educational Diagrams | Mind maps, concept maps | Academic institutions |
This wide functional range reduces the need for multiple specialized tools within organizations, consolidating diagram workflows under a single interface.
AI Integration and Intelligent Assistance
In 2026, EdrawMax has expanded its AI toolkit significantly. The platform’s AI capabilities are designed not only to generate diagrams but also to enhance structure and extract contextual content.
| Capability Area | AI-Enabled Functionality | Business Impact |
|---|---|---|
| Diagram Generation | Create flowcharts, mind maps, and infographics from prompts | Accelerates planning and concept visualization |
| AI Beautification | Automatic layout refinement and styling | Improves presentation quality instantly |
| Text Extraction | Extract editable text from images | Reduces manual data entry |
| Content Suggestion | Context-aware diagram expansion | Enhances completeness and structural accuracy |
| Infographic Creation | Auto-generate visual reports from text inputs | Simplifies executive communication |
Users frequently describe the one-click beautification feature as a productivity enhancer, transforming rough drafts into polished outputs with minimal manual adjustment.
Symbol and Template Library Strength
EdrawMax’s content library is one of the largest in the industry.
| Library Component | Volume/Detail | Practical Advantage |
|---|---|---|
| Vector Symbol Library | 26,000+ professional-grade symbols | Extensive technical and business diagram coverage |
| Community Templates | 20,000+ user-contributed templates | Rapid deployment of best-practice frameworks |
| Industry-Specific Assets | P&ID components, circuit elements, network sets | Deep technical modeling capability |
| Cross-Domain Templates | Business, education, engineering | Multi-department standardization |
This depth positions EdrawMax as particularly strong in technical and engineering environments where diagram complexity is high.
Cross-Platform Compatibility
One of EdrawMax’s strongest operational advantages is its consistent functionality across multiple operating systems.
| Platform Support | Availability Level | Business Relevance |
|---|---|---|
| Windows | Full desktop functionality | Enterprise compatibility |
| macOS | Full desktop functionality | Cross-platform team support |
| Linux | Native support | Engineering and technical environments |
| Web Browser | Cloud access | Remote accessibility |
| Mobile Devices | Multi-device usage allowance | Flexible access across work environments |
The licensing model allows installation across multiple desktops and mobile devices, enhancing flexibility for hybrid work setups.
Pricing Structure Overview
| Pricing Plan | Key Inclusions | Cost Structure |
|---|---|---|
| Semi-Annual Plan | Full feature access | Six-month subscription |
| Annual Plan | Extended access with cost savings | Annual subscription |
| Perpetual License | One-time purchase for lifetime desktop access | Single payment model |
| AI Asset Add-On | Premium AI features | Optional monthly add-on |
The availability of a perpetual license differentiates EdrawMax from SaaS-only competitors and appeals to users who prefer predictable, long-term software investments.
Comparative Positioning in 2026
| Evaluation Criteria | EdrawMax Performance Level | Competitive Positioning |
|---|---|---|
| Diagram Type Coverage | Extremely High | Among the broadest in the market |
| AI Functionality | Advanced | Competitive with innovation-focused platforms |
| Real-Time Collaboration | Limited | Less dynamic than collaborative whiteboards |
| Technical Diagram Depth | Very Strong | Suitable for engineering-grade documentation |
| Value for Money | High | Attractive due to perpetual licensing |
Independent User Perspective
Professional feedback frequently describes EdrawMax as one of the most versatile diagram software platforms available. Users appreciate that it consolidates nearly the full functionality of multiple specialized drawing products within a single interface.
The AI analysis and diagram generation tools are often cited as transformative features. Users can generate structured diagrams from simple prompts and instantly enhance them with automated formatting tools. This combination of generative AI and manual customization creates a highly efficient workflow for technical and business users alike.
However, the platform’s collaboration model differs from real-time whiteboard tools. While users can share diagrams via public links and comment asynchronously, it does not provide traditional live cursor-based co-editing experiences. For large, interactive brainstorming sessions involving dozens of participants simultaneously, cloud-native collaboration platforms may be more suitable.
Operational Trade-Off Analysis
| Strength Dimension | Competitive Advantage | Observed Limitation |
|---|---|---|
| AI-Driven Diagram Creation | Rapid generation and beautification | Optional AI add-on cost |
| Technical Customization | Deep control over diagram structure | Less collaborative interactivity |
| Multi-Platform Deployment | Broad OS compatibility | Collaboration model not fully synchronous |
| Perpetual Licensing | Long-term cost predictability | Upfront investment required |
| Template Depth | Extensive community support | Template quality may vary |
Strategic Outlook in the Global Diagram Software Market
Within the top diagram software platforms of 2026, EdrawMax represents the all-purpose AI-enhanced technical utility. It bridges engineering rigor, business documentation, and AI productivity within a single environment.
While it may not dominate large-scale collaborative innovation sessions, it excels in detailed technical modeling, cross-functional documentation, and cost-effective long-term deployment. For organizations seeking maximum diagram variety, deep customization, and flexible licensing options, EdrawMax remains one of the most comprehensive and value-driven solutions available in the global market.
6. FigJam
In 2026, FigJam has firmly established itself as a leading designer-first digital whiteboard, purpose-built for ideation, collaborative brainstorming, and early-stage product thinking. Developed by Figma, FigJam complements high-fidelity interface design workflows by serving as the creative staging ground where ideas are formed, structured, and refined before entering formal design systems.
Unlike structured enterprise diagram platforms or automation-focused drafting tools, FigJam prioritizes fluidity, accessibility, and creative engagement. Its adoption is particularly strong among software design vendors, product teams, and user experience professionals who value rapid visual collaboration over technical rigidity.
Market Position and Adoption Dynamics
FigJam’s growth trajectory in 2026 is closely tied to the broader expansion of product-led organizations and digital design ecosystems. With a reported 93 percent adoption rate among software design vendors and a high competitor switch rate from other whiteboarding tools, FigJam has become deeply embedded within modern product development pipelines.
Its seamless synchronization with Figma design files allows teams to transition directly from brainstorming artifacts to interactive prototypes, eliminating friction between ideation and execution.
Enterprise Adoption Indicators
| Performance Indicator | Market Insight | Strategic Significance |
|---|---|---|
| Design Vendor Adoption | Approximately 93% usage among design-focused firms | Strong vertical dominance |
| Competitor Switch Rate | High migration from other whiteboard platforms | Brand loyalty and ecosystem lock-in |
| Collaboration Capacity | Supports thousands of concurrent participants | Scalable for global workshops and critiques |
| Integration Strength | Native sync with Figma design environment | Streamlined design-to-prototype workflow |
Designer-Centric Collaboration Model
FigJam distinguishes itself through a playful and intuitive interface that lowers barriers to participation. Rather than emphasizing strict diagram alignment or technical symbol libraries, it offers lightweight tools designed to maximize engagement.
| Capability Area | Functional Offering | Business Impact |
|---|---|---|
| Sticky Notes and Stamps | Interactive brainstorming elements | Encourages inclusive participation |
| Dot Voting | Visual prioritization tools | Faster decision-making in workshops |
| Cursor Chat | Real-time presence indicators and messaging | Enhanced live collaboration |
| Audio and Video Support | Integrated communication tools | Reduced reliance on external conferencing tools |
| Drawing Tools | Freehand sketching and annotation | Supports rapid concept exploration |
The platform’s emphasis on visual playfulness enhances team engagement, particularly during remote workshops and cross-functional design sessions.
Template and AI Capabilities
FigJam includes over 300 built-in templates designed for common product and design workflows. In 2026, its AI-powered features further streamline board generation.
| Capability Area | AI-Enabled Functionality | Business Impact |
|---|---|---|
| Board Generation | Auto-create structured boards from prompts | Accelerates kickoff sessions |
| Template Suggestions | Context-aware layout recommendations | Reduces setup time |
| Workshop Facilitation | AI-assisted agenda structuring | Improves meeting efficiency |
| Idea Clustering | Automatic grouping of related sticky notes | Simplifies synthesis of large idea sets |
These AI enhancements enable facilitators to focus more on creative direction rather than administrative setup.
Pricing and Plan Overview
| Pricing Tier | Key Inclusions | Annual Billing Structure |
|---|---|---|
| Free | Unlimited canvases with item limitations | No cost |
| Professional | Expanded collaboration features | Per seat monthly pricing |
| Organization | Advanced permissions and governance controls | Higher per seat pricing |
| Enterprise | Enterprise-grade security and compliance | Custom contractual agreement |
The free tier encourages broad experimentation within design communities, while paid tiers provide governance features required for enterprise deployment.
Comparative Positioning in the 2026 Diagram Software Market
| Evaluation Criteria | FigJam Performance Level | Competitive Positioning |
|---|---|---|
| Creative Brainstorming | Very High | Among the strongest in ideation environments |
| Structured Technical Diagrams | Low to Moderate | Not optimized for engineering-grade modeling |
| Real-Time Collaboration | Extremely High | Designed for large-scale participation |
| Ecosystem Integration | Native Figma synchronization | Unique competitive advantage |
| Visual Engagement | High | Playful and accessible user experience |
Independent User Perspective
Professional users frequently describe FigJam as the central hub of their creative workflow. It is often referred to as the starting point of product development cycles, particularly during discovery, journey mapping, and early feature conceptualization.
The seamless integration with Figma is widely praised as a productivity multiplier. Teams can translate user flows, wireframes, and conceptual sketches directly into high-fidelity design files without redundant rework. The intuitive interface lowers participation barriers, enabling stakeholders without design expertise to contribute meaningfully.
However, users acknowledge that FigJam is not designed for structured process modeling or complex network diagrams. It lacks specialized technical icon libraries for infrastructure modeling, such as AWS or engineering-grade components. On very large boards, organizational discipline is required to prevent clutter.
Operational Trade-Off Analysis
| Strength Dimension | Competitive Advantage | Observed Limitation |
|---|---|---|
| Playful User Experience | Encourages creativity and team engagement | Less suited for formal documentation |
| Large-Scale Collaboration | Handles thousands of participants | Requires governance for board organization |
| Design Ecosystem Sync | Direct integration with Figma prototypes | Limited standalone technical depth |
| AI Facilitation Tools | Streamlined workshop setup | Focused primarily on ideation use cases |
Strategic Outlook in 2026
Within the top diagram software platforms globally in 2026, FigJam represents the designer-centric innovation layer. It is not positioned as a replacement for enterprise architecture tools or automation-driven drafting software. Instead, it excels in early-stage ideation, collaborative workshops, and remote design critiques.
As organizations continue to prioritize product-led growth and distributed creative teams, FigJam’s role as a fluid, high-engagement brainstorming platform remains strategically significant. Its deep integration within the Figma ecosystem further reinforces its long-term relevance in the design technology landscape.
7. Creately
In 2026, Creately has emerged as one of the most strategically differentiated platforms in the global diagram software market. Rather than positioning itself purely as a whiteboard tool or a structured diagramming application, Creately blends visual collaboration with database functionality. This hybrid approach allows organizations to connect ideas directly to operational data, transforming diagrams into dynamic information systems rather than static illustrations.
Creately refers to this approach as “visual intelligence,” a framework that enables users to attach metadata to objects, centralize information in a custom database, and visualize the same dataset across multiple diagram formats. The result is a platform that bridges brainstorming, documentation, and execution in a unified workspace.
Strategic Position in the 2026 Diagram Software Market
As organizations demand greater integration between planning tools and execution platforms, Creately has gained traction among IT teams, HR departments, and operational planners. Its 2026 product updates emphasize regional data storage compliance and enterprise-grade security enhancements, signaling a deliberate move toward large-scale organizational adoption.
Unlike purely creative whiteboards or automation-focused drafting tools, Creately occupies a middle ground where data integrity and visual flexibility coexist.
Core Differentiation: Visual Intelligence and Data Linking
Creately’s defining capability lies in its ability to connect visual elements to structured data records. Objects placed on a canvas are not merely shapes; they function as database entries that can be filtered, queried, and reconfigured into different visual contexts.
| Capability Area | Functional Offering | Business Impact |
|---|---|---|
| Object-Level Metadata | Attach structured data to visual elements | Converts diagrams into operational datasets |
| Multi-View Visualization | Display the same data across mind maps, Kanban boards, org charts | Eliminates duplication and version conflicts |
| Centralized Database | Custom data repository within the workspace | Unified information management |
| Auto-Updating Diagrams | Dynamic synchronization across all visual formats | Real-time accuracy across departments |
| Search Sets | Filtered sub-views generated from master dataset | Streamlined departmental and HR reporting |
The Search Sets feature is particularly powerful in enterprise HR and organizational planning. Teams can auto-generate sub-organizational charts or filtered departmental views based on attributes such as job title, experience level, or region.
AI Integration and Strategic Framework Support
Creately’s VIZ AI engine enhances its visual intelligence model by enabling teams to generate structured diagrams from prompts and apply expert planning frameworks automatically.
| Capability Area | AI-Enabled Functionality | Business Impact |
|---|---|---|
| Prompt-Based Generation | Auto-create visual frameworks from text instructions | Accelerates strategic planning sessions |
| Framework Suggestions | Pre-built expert models for SWOT, OKR, and system mapping | Standardizes enterprise best practices |
| Insight Discovery | Pattern recognition across data-linked visuals | Identifies operational gaps and inefficiencies |
| Diagram Structuring | Automated layout alignment and grouping | Improves readability in complex data sets |
By combining AI generation with database-backed visuals, Creately supports data-heavy use cases that require structured insight rather than purely creative exploration.
Feature Overview and Platform Metrics
| Feature Metric | Value or Capability Description | Pricing Tier (Per User) |
|---|---|---|
| Template Library | 1,000+ professional templates | Free: 3 documents with limited shapes |
| Shape and Icon Library | 50+ diagram shape sets and 400+ icons | Personal: Monthly subscription |
| Canvas Capacity | Up to 1,500 items per canvas (Business plan) | Business: Fixed monthly rate (unlimited users) |
| Collaboration | Real-time co-authoring and comments | Enterprise: Custom pricing |
| Security Enhancements | Regional data storage and enterprise controls (2026 updates) | Enterprise tier feature |
The Business plan structure, offering unlimited users under a flat pricing model, makes Creately particularly attractive to mid-sized organizations seeking predictable collaboration costs.
Comparative Positioning in 2026
| Evaluation Criteria | Creately Performance Level | Competitive Positioning |
|---|---|---|
| Data-Linked Diagramming | Very High | Strong differentiation in structured visuals |
| Enterprise HR Use Cases | High | Powerful org chart automation capabilities |
| Free-Form Brainstorming | Moderate | Less playful than design-centric tools |
| Real-Time Collaboration | Strong | Competitive within SaaS collaboration market |
| Mobile Accessibility | Limited | No dedicated mobile application |
Independent User Perspective
Professional users often describe Creately as more than a visual design tool. It functions as a centralized planning hub, particularly for IT infrastructure management and process documentation. The ability to visualize one data object in multiple contexts while maintaining synchronization is consistently cited as a major advantage.
The org chart automation features are especially praised. Teams can import structured CSV files and generate detailed organizational hierarchies, then filter views by department, tenure, or function without rebuilding charts manually. Compared to higher-priced competitors, Creately’s pricing model is viewed as competitive and cost-effective.
However, the platform is primarily web-based, requiring stable internet connectivity. The absence of a mobile application presents limitations for field-based professionals or distributed operational teams. While collaboration features are robust, mobility remains an area for improvement.
Operational Trade-Off Analysis
| Strength Dimension | Competitive Advantage | Observed Limitation |
|---|---|---|
| Database-Backed Diagrams | Unified data across multiple visual contexts | Requires structured data management discipline |
| HR and Org Planning | Auto-generated and filterable org charts | Limited offline functionality |
| Pricing Structure | Affordable unlimited user business tier | Enterprise security features require higher tier |
| AI Framework Assistance | Strategic modeling support | Less design-focused than creative whiteboards |
| Web-Based Platform | Accessible across devices with browser | No dedicated mobile app |
Strategic Outlook in the Global Diagram Software Market
Within the top diagram software platforms of 2026, Creately represents the data-intelligent collaboration category. It bridges visual thinking and operational execution by embedding database functionality directly into diagram workflows.
As enterprises increasingly demand interconnected planning environments that eliminate silos between documentation and execution, Creately’s visual intelligence approach positions it as a strong contender in large-scale organizational planning, HR structuring, and IT infrastructure management. While it may not dominate creative brainstorming sessions, it excels in structured, data-driven diagramming environments where consistency and synchronization are mission-critical.
8. draw.io (diagrams.net)
In 2026, draw.io, also known as diagrams.net, continues to dominate the global free diagram software segment. Recognized as the most widely used open-source diagramming tool, it has become the default choice for developers, technical teams, educators, and security-conscious organizations seeking a zero-cost, privacy-first solution.
Unlike many SaaS-based diagram platforms that rely on cloud-hosted storage models, draw.io operates primarily on a local file-based architecture. Users maintain full control over their files, choosing to store diagrams on personal devices or trusted cloud providers such as Google Drive, OneDrive, GitHub, or enterprise-managed repositories. This decentralized storage model has made it especially attractive to IT departments prioritizing data sovereignty and compliance.
Market Position and Adoption Context
draw.io’s continued popularity stems from three fundamental advantages:
Zero licensing cost
Open-source transparency
Data control through local storage
In a market increasingly driven by subscription pricing and AI-powered automation, draw.io represents the opposite philosophy: simplicity, independence, and functional completeness without financial commitment.
Core Platform Characteristics
| Capability Area | Specification Description | Business Impact |
|---|---|---|
| Licensing Model | Free and open-source | Eliminates software budget constraints |
| Data Storage Model | Local file-based or user-selected cloud storage | Full control over data privacy |
| Account Requirement | No mandatory account for web or desktop usage | Fast onboarding and anonymous access |
| Offline Mode | Desktop application with offline functionality | Suitable for secure or air-gapped environments |
| Visio Compatibility | Import and export of .vsdx files | Smooth interoperability with enterprise systems |
This architecture ensures that organizations can deploy diagramming capabilities without exposing data to third-party servers, an important consideration in regulated industries.
Technical Integration and Ecosystem Support
Despite being free, draw.io offers strong integration capabilities within development and documentation ecosystems.
| Integration Category | Supported Platforms | Practical Use Case |
|---|---|---|
| Atlassian Ecosystem | Jira and Confluence integration | Embedded technical documentation |
| Cloud Storage Providers | Google Drive, OneDrive | Centralized team access |
| Code Repositories | GitHub and GitLab | Version-controlled architecture diagrams |
| Enterprise Collaboration | G Suite integration | Internal documentation workflows |
Its seamless integration with Jira and Confluence has made it a common component in agile development environments, particularly for lightweight system diagrams embedded within tickets or project documentation.
Native Technical Stencil Libraries
draw.io includes a broad range of prebuilt stencils and icon libraries tailored for modern infrastructure environments.
| Technology Category | Available Native Stencils | Target Users |
|---|---|---|
| Cloud Infrastructure | AWS and Azure service icons | Cloud architects and DevOps teams |
| Networking | Cisco networking symbols | IT infrastructure teams |
| Containerization | Kubernetes components | Platform engineers |
| General Flowcharts | Decision trees, process flows | Business analysts |
| UML and ERD | Software modeling diagrams | Application developers |
These libraries allow teams to produce professional technical diagrams without requiring premium subscriptions.
Export and Format Support
| Export Format Category | Supported Output Types | Business Relevance |
|---|---|---|
| Document Formats | Formal documentation sharing | |
| Image Formats | SVG, JPEG, PNG | Web and presentation embedding |
| Editable Diagram Files | .vsdx compatibility | Cross-tool collaboration |
The ability to export into Visio-compatible formats enhances interoperability with enterprise-standard platforms.
Comparative Positioning in 2026
| Evaluation Criteria | draw.io Performance Level | Competitive Positioning |
|---|---|---|
| Cost Efficiency | Maximum | Market-leading free solution |
| Data Privacy | Very High | Local storage model advantage |
| AI and Automation | Minimal | Lacks generative and predictive features |
| Real-Time Collaboration | Limited | Dependent on external integrations |
| UI Modernity | Functional | Less visually refined than SaaS competitors |
Independent User Perspective
Long-term users frequently describe draw.io as a reliable alternative to premium diagram platforms, fulfilling approximately 90 percent of common technical documentation needs. It is particularly effective for creating decision trees, flowcharts, and system architecture diagrams without requiring client installation.
Developers appreciate its compatibility with Git repositories, enabling version-controlled diagram storage. The absence of mandatory account creation simplifies quick edits and secure usage within restricted environments.
However, users acknowledge that draw.io lacks advanced automation and AI-driven features found in paid platforms. The interface is often described as utilitarian rather than modern, and advanced layer management can become cumbersome in complex diagrams. Real-time cursor-based collaboration is limited unless operating within specific integrated environments.
Operational Trade-Off Analysis
| Strength Dimension | Competitive Advantage | Observed Limitation |
|---|---|---|
| Free and Open Source | No financial barrier to entry | No dedicated premium support |
| Local Data Control | Enhanced privacy and compliance flexibility | Requires manual storage management |
| Technical Stencil Depth | Strong native cloud and networking libraries | Limited automation capabilities |
| Lightweight Integration | Strong Atlassian and repository compatibility | Real-time collaboration less dynamic |
| Ease of Access | No account required | Interface lacks aesthetic refinement |
Strategic Outlook in the Diagram Software Ecosystem
Within the top diagram software platforms of 2026, draw.io represents the free and open infrastructure backbone of technical diagramming. It serves organizations that prioritize cost efficiency, privacy control, and functional completeness over advanced AI features or design-centric collaboration tools.
As subscription fatigue and data sovereignty concerns continue to influence enterprise software decisions, draw.io’s local-first model and open-source transparency ensure its ongoing relevance. While it does not compete on automation or visual polish, it remains one of the most dependable and widely adopted diagram tools in the world.
9. Gliffy
In 2026, Gliffy has reinforced its position as a highly specialized diagram software platform tailored for teams operating within the Atlassian ecosystem. Unlike broader whiteboard or standalone diagramming tools, Gliffy focuses on deep, native integration with Jira and Confluence, making it a preferred solution for IT Service Management, DevOps, and software development teams.
Gliffy was the first diagramming application to achieve the Atlassian “Cloud Fortified” designation, a certification that reflects rigorous standards for security, uptime reliability, and enterprise support. This distinction has elevated its credibility among organizations that rely heavily on structured documentation within Atlassian Cloud environments.
Strategic Market Position in 2026
Gliffy occupies a focused niche within the global diagram software landscape. Rather than competing on infinite canvases or cross-platform AI ecosystems, it optimizes structured diagram creation directly inside work management systems.
Its primary value lies in:
Embedded diagramming within Jira and Confluence
Enterprise-grade security certifications
Structured workflow documentation
For teams that document architecture, processes, and workflows directly alongside tickets and knowledge base pages, Gliffy eliminates the friction of switching between tools.
Security and Compliance Credentials
| Capability Area | Specification Detail | Organizational Benefit |
|---|---|---|
| Security Certification | SOC 2 Type II | Enterprise-grade data protection |
| Atlassian Badge | Cloud Fortified Status | Verified reliability and performance standards |
| Compliance Standards | BPMN and ISO alignment | Suitable for regulated documentation environments |
| Access Controls | Integrated Atlassian permissions | Consistent governance across systems |
The Cloud Fortified badge signals to enterprises that Gliffy meets advanced operational and security benchmarks within the Atlassian marketplace.
Core Diagramming Capabilities
Gliffy provides professional-grade diagram tools designed for technical clarity and structural consistency.
| Capability Area | Functional Offering | Business Impact |
|---|---|---|
| UML and Flowchart Tools | Structured modeling and software documentation | Clear system architecture visualization |
| Swimlane Management | Stable connectors across large workflow diagrams | Reduced manual realignment effort |
| Multi-Shape Editing | Simultaneous scaling and modification | Increased drafting efficiency |
| AI Prompt Generation | Diagram creation from text inputs in Confluence | Accelerated documentation process |
| Wireframing Support | Lightweight UI mockups | Integrated product documentation |
The ability to generate diagrams directly from text prompts inside Confluence enhances documentation speed, particularly for complex technical explanations.
Integration and Ecosystem Alignment
| Integration Category | Supported Platforms | Operational Relevance |
|---|---|---|
| Atlassian Core Products | Deep Jira and Confluence embedding | Seamless workflow alignment |
| Communication Platforms | Slack integration | Cross-team sharing |
| Cloud Infrastructure | Native Atlassian Cloud support | Unified cloud environment |
Because diagrams are created and stored directly within documentation pages and tickets, Gliffy ensures that visual artifacts remain contextually connected to project tasks and system records.
Pricing and Plan Structure
| Pricing Tier | Key Features Included | Annual Billing Structure |
|---|---|---|
| Professional | Full diagramming capabilities | Per user monthly subscription |
| Jira/Confluence Add-On | Flat monthly rate for embedded use | Fixed pricing tier |
| Enterprise | Advanced support and security controls | Custom contract |
| Trial Access | Limited-time evaluation | 14-day free trial |
While the pricing model is competitive for smaller teams, larger deployments may experience cumulative costs based on user count.
Comparative Positioning in the Diagram Software Market
| Evaluation Criteria | Gliffy Performance Level | Competitive Positioning |
|---|---|---|
| Atlassian Integration | Exceptional | Industry-leading embedded experience |
| Structured Documentation | High | Strong in workflow and UML modeling |
| Real-Time Whiteboarding | Moderate | Less expansive than infinite canvas platforms |
| Security Credentials | Strong | Enterprise-grade compliance support |
| AI Capabilities | Emerging and contextual | Focused on documentation acceleration |
Independent User Perspective
Professional users frequently cite Gliffy’s seamless integration with Jira and Confluence as its strongest advantage. The ability to visualize complex workflows, system architectures, and process diagrams directly within documentation pages significantly enhances productivity.
Users appreciate the intuitive interface, which lowers the learning curve for non-specialists while still enabling structured technical outputs. Stable connector behavior when adjusting large swimlane diagrams is frequently mentioned as a time-saving feature.
However, the web-based nature of the platform can feel limited compared to heavier desktop-based diagram tools. Additionally, organizations with very large user bases may find cumulative subscription costs significant. Gliffy also lacks the expansive collaborative canvas experience offered by creative whiteboarding tools.
Operational Trade-Off Analysis
| Strength Dimension | Competitive Advantage | Observed Limitation |
|---|---|---|
| Native Atlassian Embedding | Eliminates tool-switching friction | Limited outside Atlassian ecosystem |
| Structured Workflow Tools | Clean UML and ITSM documentation | Less flexible for open brainstorming |
| Enterprise Security | SOC 2 and Cloud Fortified certification | Pricing scales with user volume |
| Connector Stability | Reliable layout preservation | Not optimized for large-scale visual workshops |
Strategic Outlook in 2026
Within the top diagram software platforms globally in 2026, Gliffy represents the Atlassian-centric professional documentation category. Its focus on structured, embedded diagramming makes it particularly valuable for software development teams and IT service departments that operate entirely within Jira and Confluence environments.
While it may not replace broad innovation platforms or automation-driven drafting tools, Gliffy excels in maintaining technical documentation precisely where work happens. For organizations committed to the Atlassian ecosystem, it remains one of the most reliable and security-validated diagramming solutions available.
10. MindManager
In 2026, MindManager continues to stand at the forefront of strategic information mapping and knowledge visualization. Unlike traditional diagram software that focuses primarily on process flows or system architecture, MindManager specializes in structuring complex ideas, strategic initiatives, and large volumes of interconnected data into coherent, actionable visual frameworks.
Its strength lies in helping organizations move from fragmented information to structured clarity. Enterprises, consultants, educators, and executive teams use MindManager to map stakeholder relationships, facilitate product development workshops, manage certification study programs, and construct technology competency matrices.
Market Position and Strategic Relevance
MindManager occupies a distinct segment within the diagram software ecosystem: high-level strategic visualization and knowledge management. It is frequently adopted by organizations that require macro-level oversight of projects, financial structures, and long-term planning initiatives.
Rather than emphasizing free-form brainstorming or technical drafting precision, the platform focuses on:
Information hierarchy structuring
Strategic mapping and scenario planning
Knowledge summarization and synthesis
This positioning has sustained its relevance in corporate strategy departments and professional services firms.
Core Strategic Mapping Capabilities
| Capability Area | Functional Offering | Business Impact |
|---|---|---|
| Mind Mapping Engine | Multi-level hierarchical information structures | Clear visualization of complex project ecosystems |
| Stakeholder Analysis Tools | Relationship mapping and influence tracking | Improved decision-making clarity |
| Competency Matrix Mapping | Skills and capability visualization | Strategic workforce planning |
| Workshop Facilitation | Structured ideation mapping | Enhanced collaborative planning sessions |
| Outline Export | Convert visual maps into structured documents | Seamless reporting and documentation |
The ability to export maps into structured outlines is particularly valuable for consultants, authors, and executives who need to convert visual thinking into formal reports.
Project Management and Data Integration Features
In 2026, MindManager has expanded its project management capabilities, bridging the gap between visualization and execution.
| Capability Area | Integrated Functionality | Business Impact |
|---|---|---|
| Task Delegation | Assign responsibilities within visual maps | Streamlined accountability tracking |
| Cost Tracking | Budget monitoring inside mapped structures | Financial oversight within strategic plans |
| Excel Data Linking | Direct data integration from spreadsheets | Dynamic updating of financial and operational data |
| Jira and Teams Sync | Integration with work management systems | Alignment with agile and corporate workflows |
| Timeline Views | Convert maps into Gantt-style representations | Multi-format project tracking |
These integrations allow organizations to maintain a “global vision” of projects while retaining detailed operational oversight.
Platform Availability and Accessibility
| Platform Category | Supported Environments | Operational Benefit |
|---|---|---|
| Desktop Applications | Windows and Mac | Full-featured local productivity |
| Mobile Applications | iOS and Android | On-the-go access and editing |
| Cloud and SaaS Versions | Browser-based deployment | Remote collaboration |
| Multilingual Support | English, French, German, Japanese, Chinese | Global enterprise adoption |
Its availability across desktop, cloud, and mobile platforms makes MindManager suitable for distributed teams and professional learners alike.
Performance and Market Metrics
| Quantitative Metric | Specification Detail | Pricing Tier Structure |
|---|---|---|
| TrustRadius Rating | 8.3 out of 10 | Individual annual subscription |
| Enterprise Licensing | Custom professional pricing | Tailored contracts |
| Trial Access | 30-day evaluation period | Risk-free onboarding |
| Data Integration | Excel, Jira, Microsoft Teams connectivity | Included in higher tiers |
| Live Demonstration | Available for enterprise prospects | Structured product evaluation |
The pricing structure reflects its positioning as a professional-grade strategic planning tool rather than a casual whiteboarding application.
Comparative Positioning in the 2026 Diagram Software Market
| Evaluation Criteria | MindManager Performance Level | Competitive Positioning |
|---|---|---|
| Strategic Information Depth | Very High | Leader in knowledge structuring |
| Technical Architecture Tools | Moderate | Not focused on engineering diagram precision |
| Project Management Features | Strong | Hybrid visualization and execution capabilities |
| Ease of Learning | Moderate | Steeper curve for advanced features |
| Creative Brainstorming | Structured | Less playful than infinite whiteboards |
Independent User Perspective
Professionals frequently describe MindManager as indispensable for organizing complex information. It is widely used in ideation workshops, executive client presentations, and financial modeling scenarios where large datasets must be translated into understandable visual frameworks.
Users highlight its ability to provide a “global vision” of projects that simple flowcharts cannot replicate. The structured hierarchy of mind maps allows teams to zoom out for macro-level strategy while retaining access to detailed subtopics.
The export-to-outline feature is particularly valuable for authors and consultants who need to transform visual maps into publishable documents. However, some users note that formatting controls can be cumbersome, and scaling or adjusting objects is not always intuitive. Advanced technical connections may require a learning investment, and visual layout guidance tools could be improved.
Operational Trade-Off Analysis
| Strength Dimension | Competitive Advantage | Observed Limitation |
|---|---|---|
| Strategic Clarity | Excellent for summarizing complexity | Less suited for technical infrastructure diagrams |
| Integrated Task Management | Combines mapping with delegation and cost tracking | Advanced features require onboarding |
| Multi-Format Output | Export to outlines and timelines | Formatting customization can be cumbersome |
| Cross-Platform Access | Desktop, mobile, and cloud availability | Enterprise features may require premium tiers |
Strategic Outlook in 2026
Within the top diagram software platforms globally in 2026, MindManager represents the strategic intelligence and knowledge management category. It excels in environments where structured thinking, executive communication, and large-scale project visualization are mission-critical.
As organizations continue to confront increasing information complexity, MindManager’s structured mapping approach remains highly relevant. While it may not replace collaborative whiteboards or engineering drafting platforms, it stands out as one of the most robust tools available for transforming complexity into strategic clarity.
Technical Infrastructure in Diagram Software: Security, Compliance, and Uptime in 2026
In 2026, the evaluation criteria for enterprise diagram software extend far beyond visual features and collaboration capabilities. Procurement teams now assess platforms based on technical infrastructure readiness, regulatory compliance maturity, and guaranteed operational uptime. As regulatory frameworks tighten globally and cybersecurity risks escalate, diagram software vendors must demonstrate robust security governance and continuous monitoring practices to remain competitive in enterprise markets.
Security posture has evolved into a primary decision-making factor, often outweighing user interface design or AI capabilities. Organizations increasingly demand evidence of compliance certifications, real-time monitoring, and formalized incident response mechanisms before approving deployment.
The Rising Importance of Regulatory Compliance
The global regulatory landscape has intensified, with frameworks such as GDPR, SOC 2, and ISO 27001 forming the baseline requirements for enterprise-grade SaaS procurement. These standards are no longer viewed as differentiators but as minimum expectations.
Security Compliance Trends in 2026
| Compliance Area | Regulatory Focus | Business Implication |
|---|---|---|
| GDPR | Data protection and privacy rights within the EU | Financial penalties up to 4% of global revenue |
| SOC 2 Type II | Security, availability, confidentiality controls | Independent third-party audit validation |
| ISO 27001 | Information security management systems | Structured risk management framework |
| Access Management | Role-based permissions and authentication controls | Reduced internal data exposure |
| Encryption Standards | Data encryption at rest and in transit | Protection against unauthorized access |
While SOC 2 remains a voluntary audit standard primarily adopted in the United States, GDPR represents a binding regulatory requirement across the European Union. The overlap between these frameworks includes encryption protocols, identity access controls, incident response planning, and operational transparency.
Most leading diagram platforms in 2026 have achieved SOC 2 Type II certification to meet enterprise expectations. Vendors that fail to demonstrate comparable security credentials face restricted adoption, particularly within regulated industries such as finance, healthcare, and government.
Continuous Compliance and Real-Time Monitoring
A significant market shift has occurred toward continuous compliance models. Rather than performing annual audits alone, software vendors now implement automated control testing environments that validate security posture on a daily basis.
Continuous Compliance Infrastructure
| Monitoring Dimension | Technical Implementation | Strategic Value |
|---|---|---|
| Automated Control Testing | 1,200+ daily automated security checks | Ongoing validation of system integrity |
| API-Based Monitoring | Integration with compliance automation platforms | Real-time threat detection |
| Incident Response Tracking | Continuous logging and alerting systems | Faster containment of vulnerabilities |
| Audit Documentation | Automated evidence collection | Simplified enterprise procurement reviews |
| Vendor Risk Reporting | Continuous security scoring | Increased transparency for customers |
Enterprises increasingly deploy compliance automation platforms to integrate directly with diagram software stacks. Through API connectivity, these tools monitor configuration changes, encryption status, authentication logs, and data residency compliance in real time.
Approximately 30 percent of organizations report that security and data privacy concerns currently restrict the adoption of visual collaboration tools. As a result, compliance maturity has become a decisive competitive differentiator.
Infrastructure Uptime and Service Level Agreements
Operational reliability is equally critical in 2026, particularly for organizations that depend on diagram software for real-time collaboration across distributed teams.
Enterprise Uptime Expectations
| Infrastructure Metric | Industry Benchmark | Organizational Impact |
|---|---|---|
| Service Level Agreement | 99.9% uptime guarantee | Minimal disruption to workflow |
| Cloud Deployment Reliability | Redundant multi-region hosting | Increased availability during regional outages |
| Disaster Recovery Protocols | Automated failover systems | Business continuity assurance |
| Maintenance Transparency | Scheduled downtime notifications | Improved planning and risk mitigation |
A 99.9 percent uptime SLA has become the standard expectation for enterprise workflow platforms. For the 71 percent of cloud-dependent users who rely on diagram software for real-time collaboration, even brief service interruptions can disrupt product development, infrastructure planning, or client workshops.
Performance and Real-Time Collaboration Metrics
Beyond compliance and uptime, performance scalability is essential for distributed organizations operating across time zones and geographic regions.
Collaboration Performance Indicators
| Performance Dimension | Market Insight | Business Outcome |
|---|---|---|
| Deployment Efficiency | 34% reduction in deployment time with cloud-based tools | Faster onboarding and scaling |
| Cross-Location Productivity | 41% improvement in distributed collaboration | Enhanced global teamwork |
| Concurrent Participant Load | Thousands of simultaneous users supported | Large-scale workshop facilitation |
| Live Cursor Tracking | Real-time presence visibility | Increased engagement during collaboration |
| Vector Object Scaling | Performance degradation on highly complex boards | Requires optimization for large datasets |
Platforms designed for large-scale collaboration can support thousands of concurrent users with real-time cursor tracking and synchronized updates. However, performance may begin to degrade when boards contain thousands of intricate vector elements or embedded assets.
Latency measurements are typically proprietary, but optimization strategies such as object compression, background rendering, and distributed server architecture are now common across top-tier vendors.
Security as a Competitive Differentiator
The diagram software market in 2026 demonstrates a clear shift toward infrastructure maturity as a defining competitive factor. Vendors are evaluated not only on visual innovation or AI enhancements but on their ability to deliver:
Regulatory compliance alignment
Continuous monitoring validation
High availability infrastructure
Scalable real-time collaboration
Security, compliance, and uptime guarantees have become strategic pillars of enterprise adoption. As regulatory pressure increases and organizations prioritize digital resilience, diagram software platforms must invest as heavily in backend infrastructure as they do in front-end innovation.
In the evolving global diagram software ecosystem, technical readiness is no longer optional. It is foundational to market leadership.
Economic Outlook and Strategic Conclusions for the Diagram Software Market in 2026
The global diagram software market in 2026 has entered a phase of high-value maturity. What was once considered a utility category centered on flowcharts and static documentation has transformed into a strategic layer within enterprise digital infrastructure. The shift from simple charting tools to agentic innovation workspaces reflects a broader evolution in how organizations manage knowledge, collaboration, and execution.
Modern diagram platforms now function as integrated ecosystems that combine ideation, structured modeling, AI-assisted generation, real-time collaboration, compliance governance, and workflow automation within a unified digital canvas. As enterprises consolidate fragmented tool stacks, diagram software increasingly serves as a connective tissue linking strategy, product development, IT operations, and knowledge management.
Market Maturity Drivers in 2026
Several macroeconomic and operational forces are accelerating this transition:
Enterprise Tool Consolidation
Organizations are reducing software sprawl by adopting platforms that unify brainstorming, design, and execution.
AI-Driven Productivity Gains
Embedded generative AI tools are shortening planning cycles and automating documentation workflows.
Regulatory and Compliance Pressure
Security posture and audit readiness now influence purchasing decisions as much as functionality.
Hybrid Workforce Expansion
Distributed teams require real-time, cloud-based visual collaboration environments.
Economic Priorities Shaping Procurement
| Economic Driver | Market Shift Observed | Strategic Outcome |
|---|---|---|
| Cost Optimization | Demand for consolidated multi-purpose platforms | Reduced total cost of ownership |
| Automation Efficiency | AI-enabled diagram generation | Faster innovation cycles |
| Compliance Accountability | Preference for SOC 2 and ISO-aligned vendors | Lower enterprise risk exposure |
| Productivity Measurement | Emphasis on collaborative performance metrics | Quantifiable cross-location output gains |
| Subscription Rationalization | Interest in perpetual or flat-rate licensing models | Budget predictability |
Strategic Recommendations for Large Enterprises
For enterprise-scale organizations, governance, security, and data integration remain the primary evaluation criteria. Tools that demonstrate strong administrative controls, advanced permission frameworks, and proven compliance certifications are best positioned to meet enterprise procurement standards.
Enterprise-Focused Platform Priorities
| Evaluation Criteria | Recommended Platform Type | Strategic Rationale |
|---|---|---|
| Structured IT Architecture | Enterprise-grade diagram systems | High precision and compliance alignment |
| Data-Driven Process Mapping | Tools with live data linking | Operational transparency |
| Administrative Controls | Role-based access and audit trails | Governance assurance |
| Regulatory Compliance | SOC 2 Type II and GDPR-ready solutions | Reduced legal and operational risk |
Platforms that emphasize structured modeling and data connectivity remain the most reliable choices for operational mapping and enterprise documentation environments.
Strategic Recommendations for Creative and Software Teams
For design-led and agile product teams, the primary decision factor is ecosystem integration and collaborative flexibility. These teams prioritize seamless transitions between ideation and execution.
Creative and Agile Team Platform Considerations
| Collaboration Requirement | Recommended Platform Category | Business Advantage |
|---|---|---|
| Design Ecosystem Integration | Native design tool synchronization | Reduced workflow friction |
| Large-Scale Brainstorming | Infinite canvas whiteboard platforms | High participant engagement |
| AI-Assisted Ideation | Prompt-based diagram generation | Accelerated creative cycles |
| Workshop Facilitation | Real-time cursor tracking and voting tools | Improved decision velocity |
In environments where rapid iteration and stakeholder alignment are critical, integration depth often outweighs rigid diagram structure.
Strategic Recommendations for Technical Documentarians and Startups
For cost-sensitive organizations and technical specialists, the emphasis shifts toward affordability, technical stencil depth, and practical AI assistance.
Cost-Optimized Platform Evaluation Matrix
| Budget Priority | Recommended Tool Category | Strategic Benefit |
|---|---|---|
| Zero-Cost Deployment | Open-source diagram solutions | Minimal financial barrier |
| Perpetual Licensing | One-time purchase software models | Long-term cost predictability |
| Extensive Symbol Libraries | Engineering-focused diagram platforms | Technical completeness |
| AI Diagram Generation | Integrated AI-assisted drafting tools | Reduced manual effort |
For startups operating with lean budgets, tools that provide extensive functionality without high recurring subscription costs deliver the strongest return on investment.
Industry-Wide Strategic Trends
The diagram software market is no longer defined by drawing capabilities alone. Instead, it has become a competitive arena shaped by integration breadth, automation intelligence, compliance maturity, and collaboration scalability.
Category Evolution Framework
| Market Phase | Legacy Model | 2026 Model |
|---|---|---|
| Primary Function | Static chart creation | Dynamic, data-linked visualization |
| Collaboration Model | Single-user desktop editing | Real-time, multi-user infinite canvas |
| Automation Level | Manual drafting | AI-assisted generation and predictive formatting |
| Data Connectivity | Isolated diagrams | Integrated APIs and live database linking |
| Enterprise Governance | Limited controls | Continuous compliance and audit-ready infrastructure |
Final Strategic Perspective
By 2026, diagram software has evolved into a foundational enterprise capability rather than a supplementary documentation tool. It now supports digital transformation initiatives, operational visibility, product innovation, and executive decision-making.
The competitive frontier has shifted from visual aesthetics to infrastructure maturity and workflow integration. The most successful platforms are those that combine:
AI-driven productivity
Robust compliance and uptime guarantees
Deep ecosystem integrations
Data-linked execution frameworks
Ultimately, the diagram software market in 2026 represents the emergence of a universal visual language for modern organizations. It is no longer about drawing shapes. It is about constructing interconnected, automated, and accessible visual systems that enable enterprises to think, plan, and execute at scale.
Conclusion
As the global software ecosystem advances deeper into digital transformation, the category of diagram software has undergone one of the most significant evolutions in modern productivity technology. The “top 10 diagram software in the world in 2026” are no longer simple drawing tools used for flowcharts and organizational charts. They have become intelligent, cloud-powered, AI-enhanced visual operating systems that sit at the center of enterprise planning, product development, IT infrastructure management, and strategic decision-making.
The modern diagramming landscape reflects a convergence of collaboration, automation, data integration, compliance readiness, and enterprise-grade reliability. Organizations are no longer choosing diagram tools solely based on shape libraries or interface design. Instead, they are evaluating platforms based on scalability, security posture, AI capabilities, integration ecosystems, uptime guarantees, and total cost of ownership.
The Evolution of Diagram Software in 2026
The shift from static documentation to dynamic visual intelligence platforms defines the diagram software market in 2026. Traditional desktop applications once focused on manual drafting and isolated file storage. Today’s leading diagram tools offer:
Real-time multi-user collaboration
AI-assisted diagram generation
Data-linked visualization
Cloud-native deployment
Enterprise security compliance
API-based automation workflows
This transformation has elevated diagram software from a tactical utility to a strategic enterprise layer. Visual collaboration platforms now bridge ideation, structured planning, technical architecture, and operational execution within a single shared workspace.
Enterprise Adoption Patterns and Market Segmentation
The top diagram software platforms of 2026 serve distinct yet overlapping audiences, reflecting the diversity of enterprise requirements.
Large enterprises prioritize:
Administrative governance and role-based permissions
SOC 2, ISO 27001, and GDPR compliance
Live data integration with enterprise systems
Structured modeling standards such as BPMN and UML
Guaranteed uptime with 99.9 percent or higher SLAs
Creative teams and product-led organizations focus on:
Infinite canvas collaboration
Seamless integration with design tools
AI-powered brainstorming and ideation workflows
Live cursor tracking and large-scale participation
Technical teams and startups emphasize:
Cost-effective deployment
Extensive technical stencil libraries
Cross-platform compatibility
Perpetual licensing models
Lightweight documentation integration
This segmentation demonstrates that there is no single “best diagram software” universally. Instead, the top 10 diagram software in the world in 2026 represent excellence across different operational priorities.
AI as the Defining Competitive Advantage
One of the most significant developments in diagram software innovation is the integration of artificial intelligence. AI is no longer an optional feature; it is a productivity multiplier.
Leading diagram platforms now enable users to:
Generate flowcharts and mind maps from simple text prompts
Automatically align and beautify complex layouts
Extract structured content from images
Cluster ideas and identify patterns
Convert visual maps into structured documentation
AI-powered diagramming reduces manual effort, shortens planning cycles, and enhances clarity across distributed teams. As generative AI continues to mature, diagram software will likely become even more predictive, context-aware, and execution-oriented.
Security, Compliance, and Infrastructure Reliability
Another defining factor separating top-tier diagram software from emerging competitors in 2026 is infrastructure readiness. Enterprises demand:
Continuous compliance validation
SOC 2 Type II certification
Regional data residency options
Encrypted storage and transmission
Automated incident response monitoring
Security and data privacy concerns influence procurement decisions in nearly one-third of organizations. Vendors that demonstrate strong compliance frameworks and transparent security practices gain a measurable competitive advantage.
Equally important is infrastructure reliability. With most enterprises operating in cloud-first environments, diagram software must guarantee uptime, maintain performance under heavy collaboration loads, and support thousands of concurrent participants without degradation.
Consolidation and Platform Unification
The diagram software market is also experiencing consolidation in functionality. Organizations increasingly prefer unified platforms that combine:
Whiteboarding
Structured diagramming
Task management
Data visualization
Workflow automation
Knowledge management
This consolidation reduces tool sprawl, lowers subscription costs, and streamlines onboarding. The top 10 diagram software platforms in 2026 differentiate themselves not only through features but through their ability to act as integrated innovation workspaces.
Economic Outlook and Long-Term Market Direction
The diagram software industry has entered a phase of high-value maturity. Revenue growth is increasingly driven by enterprise subscriptions, AI feature add-ons, and expanded integration capabilities. Meanwhile, open-source and perpetual-license options continue to thrive among cost-conscious users and technical communities.
Looking ahead, several trends are expected to shape the future of diagram software:
Deeper integration with enterprise resource planning systems
Greater automation of compliance and governance processes
Enhanced performance optimization for large-scale collaboration
Expansion of visual intelligence and predictive modeling features
Increased personalization driven by AI learning models
The next generation of diagram software will likely function as a cognitive interface for organizations, translating raw data and abstract strategies into visual systems that guide decision-making at scale.
Final Perspective: Building the Visual Language of the Modern Enterprise
The top 10 diagram software in the world in 2026 collectively represent the emergence of a universal visual language for modern organizations. These platforms empower teams to think more clearly, collaborate more efficiently, and execute more strategically.
Diagramming is no longer about connecting shapes with arrows. It is about:
Transforming complexity into structured insight
Aligning distributed teams through shared visual contexts
Linking data directly to execution frameworks
Ensuring security and compliance in regulated environments
Accelerating innovation through AI-driven automation
As enterprises continue to navigate rapid technological change, diagram software stands as a foundational layer of digital transformation. Organizations that select the right platform based on their operational priorities, security requirements, and collaboration needs will gain measurable advantages in clarity, speed, and strategic alignment.
In 2026, the global diagram software market is not merely thriving; it is redefining how businesses conceptualize, communicate, and construct the future.
If you find this article useful, why not share it with your hiring manager and C-level suite friends and also leave a nice comment below?
We, at the 9cv9 Research Team, strive to bring the latest and most meaningful data, guides, and statistics to your doorstep.
To get access to top-quality guides, click over to 9cv9 Blog.
To hire top talents using our modern AI-powered recruitment agency, find out more at 9cv9 Modern AI-Powered Recruitment Agency.
People Also Ask
What is the best diagram software in the world in 2026?
The best diagram software in 2026 depends on your needs. Enterprise teams prefer structured tools with compliance controls, while creative teams choose AI-powered whiteboards with real-time collaboration and integration features.
Which diagram software is best for large enterprises in 2026?
Large enterprises prioritize platforms with SOC 2 compliance, data linking, role-based access controls, and 99.9% uptime SLAs to support secure and scalable operations.
What is the most popular free diagram software in 2026?
Free diagram software remains widely used for technical documentation and flowcharts, especially tools that offer open-source licensing and local file storage options.
Which diagram tool has the best AI features in 2026?
AI-powered diagram tools can generate flowcharts, mind maps, and process diagrams from prompts, auto-align layouts, and provide intelligent formatting suggestions.
Is cloud-based diagram software better than desktop tools?
Cloud-based diagram software enables real-time collaboration and faster deployment, while desktop tools may offer deeper offline functionality and advanced drafting control.
What diagram software is best for UML and BPMN diagrams?
Structured diagram platforms with native UML and BPMN libraries are ideal for software architecture, business process modeling, and enterprise IT documentation.
Which diagram software integrates with Jira and Confluence?
Several professional diagram tools integrate directly with Jira and Confluence, allowing teams to embed flowcharts and architecture diagrams inside documentation pages.
What is the best diagram software for IT infrastructure mapping?
IT teams prefer diagram tools with AWS, Azure, Cisco, and Kubernetes stencils, plus real-time data linking for accurate infrastructure visualization.
How important is SOC 2 compliance in diagram software?
SOC 2 compliance is critical for enterprises, as it verifies security controls, data protection practices, and operational reliability through third-party audits.
Which diagram software supports real-time collaboration?
Leading diagram platforms in 2026 support live cursor tracking, simultaneous editing, and large-scale workshops with thousands of participants.
What is the difference between whiteboard tools and structured diagram software?
Whiteboard tools focus on creative brainstorming and infinite canvases, while structured diagram software emphasizes precision, standards compliance, and technical accuracy.
Which diagram software is best for remote teams?
Remote teams benefit from cloud-native diagram tools that offer video collaboration, AI-assisted ideation, and seamless cross-location performance.
Can diagram software integrate with Excel and databases?
Advanced diagram platforms allow live data imports from Excel, SQL databases, and APIs to create dynamic, auto-updating visualizations.
What is the most affordable diagram software in 2026?
Affordable diagram tools include free open-source options and platforms offering perpetual licenses to reduce long-term subscription costs.
Is AI diagram generation reliable for professional use?
AI diagram generation accelerates workflows and improves layout consistency, but professional teams often refine outputs for precision and compliance.
Which diagram software is best for project management visualization?
Tools that combine mind maps, timelines, Kanban boards, and task delegation features are ideal for visual project planning and tracking.
How secure is online diagram software?
Enterprise-grade diagram platforms use encryption, access controls, regional data storage, and continuous compliance monitoring to ensure data security.
What diagram software works on Windows, Mac, and Linux?
Cross-platform diagram tools offer consistent functionality across Windows, macOS, Linux, and web browsers for flexible deployment.
Which tool is best for mind mapping in 2026?
Mind mapping software in 2026 includes AI-assisted structuring, hierarchical visualization, and export options for documents and presentations.
Can diagram software handle thousands of users at once?
Top-tier cloud diagram tools support thousands of concurrent users, though very large boards with complex objects may impact performance.
What diagram software is best for startups?
Startups often choose cost-effective platforms with free tiers, AI features, and broad template libraries to maximize value with limited budgets.
Do diagram tools support Visio file compatibility?
Many leading diagram platforms support importing and exporting Visio files, making migration and collaboration easier across teams.
How does uptime affect diagram software performance?
A 99.9% uptime SLA ensures minimal disruption, which is crucial for organizations relying on diagram tools for real-time collaboration.
Which diagram software is best for engineering diagrams?
Engineering teams require detailed symbol libraries for circuit diagrams, P&ID, and network setups, along with precision alignment tools.
Are there diagram tools with perpetual licenses?
Some diagram software providers offer one-time purchase licenses, appealing to teams that want predictable, long-term costs.
What features should I look for in diagram software in 2026?
Key features include AI generation, data linking, real-time collaboration, compliance certifications, integration capabilities, and scalability.
Is mobile support important for diagram software?
Mobile compatibility enables quick edits and access on the go, though full editing capabilities are often stronger on desktop platforms.
Which diagram software is best for knowledge management?
Knowledge management platforms focus on structured information mapping, outline exports, and data-linked visual frameworks.
How does diagram software improve productivity?
Cloud-based diagram tools reduce deployment time, enhance collaboration efficiency, and centralize workflows within shared visual environments.
Why is diagram software important for digital transformation?
Diagram software supports digital transformation by connecting ideation, data visualization, automation, and execution into a unified visual system.
Sources
The Business Research Company
Market Growth Reports
Business Research Insights
Gartner
Deloitte
Research and Markets
EdrawMax
Miro
Creately
Venngage
ISMS
The Digital Project Manager
TrustRadius
Capterra
Slashdot
SourceForge
Zapier
SaaSworthy
Ritza
SmartDraw
Crozdesk
KYP
Edraw AI
Ramp
MockFlow
Gliffy
GetApp
Qualys
Sprinto
Workstreet

")


