


")


")


Key Takeaways
• The best data analysis software in 2025 combines AI, machine learning, and cloud-based technology to deliver faster and smarter insights.
• Tools like Power BI, Tableau, and Python dominate the market for their scalability, accessibility, and advanced visualization capabilities.
• Businesses are prioritizing self-service analytics and open-source platforms to enhance collaboration, flexibility, and cost efficiency.
In 2025, the demand for advanced data analysis software has reached unprecedented levels as organizations worldwide continue to leverage data as a strategic asset for growth, innovation, and competitive advantage. The rapid digital transformation across industries has created an environment where decision-making is increasingly data-driven, requiring companies to adopt tools capable of processing vast amounts of information with precision, speed, and actionable insight. From small enterprises to multinational corporations, data analysis software has become the foundation of effective business intelligence, predictive analytics, and real-time performance tracking.

Modern data analysis platforms are no longer just about organizing numbers or generating reports—they have evolved into intelligent ecosystems integrating artificial intelligence (AI), machine learning (ML), and automation to uncover patterns, forecast trends, and recommend data-backed strategies. Businesses today rely on these advanced tools not only to interpret historical data but also to anticipate future outcomes, optimize operations, and enhance customer experiences. In 2025, the best data analysis software solutions are characterized by their ability to combine powerful analytics engines with intuitive interfaces, enabling both technical and non-technical users to derive meaningful insights without complex coding knowledge.
Several key trends are shaping the data analysis landscape in 2025. The integration of AI and natural language processing (NLP) allows professionals to query data using conversational language, reducing dependency on technical expertise. Cloud-based analytics platforms are gaining dominance due to their scalability, cost efficiency, and real-time accessibility. The shift toward self-service analytics empowers employees across all departments to make informed decisions independently, while real-time data streaming and predictive analytics capabilities provide organizations with instant insights into performance metrics and market dynamics. Additionally, the growing emphasis on data security and governance ensures that sensitive information remains protected and compliant with global regulations.
The global business ecosystem in 2025 values agility, and data analysis software plays a crucial role in achieving it. From identifying emerging market trends to optimizing supply chains, these tools help companies transform raw data into actionable intelligence. Software such as Microsoft Power BI, Tableau, Qlik Sense, and Google Looker Studio have set industry benchmarks for visualization, usability, and integration capabilities. Meanwhile, open-source platforms like KNIME, R, and Python remain essential for data scientists who require flexibility, customization, and advanced statistical modeling capabilities. Legacy systems like SAS Analytics continue to serve industries that demand precision, compliance, and deep analytical rigor.
The selection of the right data analysis software depends on an organization’s size, budget, technical expertise, and analytical objectives. Businesses must consider factors such as ease of use, integration with existing tools, data visualization quality, and scalability before making a choice. The year 2025 has witnessed a surge in hybrid solutions that merge traditional analytics with AI-driven automation, ensuring that businesses stay ahead in the rapidly evolving digital economy. These tools not only simplify data interpretation but also democratize analytics by making data accessible to every stakeholder within an organization.
This comprehensive guide to the top 10 best data analysis software in 2025 offers an in-depth look at the most advanced, efficient, and user-centric platforms available today. It explores their unique features, performance benefits, and suitability across different industries and organizational sizes. By understanding the strengths of each solution, businesses can make informed decisions that align with their long-term strategic goals and data transformation initiatives. Ultimately, the right data analysis software is not just a technological asset—it is a catalyst for innovation, operational excellence, and sustained growth in the data-driven world of 2025.
Before we venture further into this article, we would like to share who we are and what we do.
About 9cv9
9cv9 is a business tech startup based in Singapore and Asia, with a strong presence all over the world.
With over nine years of startup and business experience, and being highly involved in connecting with thousands of companies and startups, the 9cv9 team has listed some important learning points in this overview of the Top 10 Best Data Analysis Software in 2025.
If your company needs recruitment and headhunting services to hire top-quality employees, you can use 9cv9 headhunting and recruitment services to hire top talents and candidates. Find out more here, or send over an email to [email protected].
Or just post 1 free job posting here at 9cv9 Hiring Portal in under 10 minutes.
Top 10 Best Data Analysis Software in 2025
- Microsoft Power BI
- Tableau
- Qlik Sense
- Looker (Google Looker Studio)
- Domo
- QlikView
- SAS Analytics
- KNIME Analytics Platform
- R Programming
- Python
1. Microsoft Power BI

Microsoft Power BI has solidified its position as one of the most dominant data analysis software solutions in 2025, serving as a cornerstone for organizations seeking advanced business intelligence, real-time analytics, and data-driven decision-making capabilities. With its powerful suite of visualization tools and seamless integration into the Microsoft ecosystem, Power BI continues to redefine how businesses analyze and interpret their data on both strategic and operational levels.
Comprehensive Overview and Market Standing
Microsoft Power BI’s dominance in the business intelligence landscape is reinforced by its strong market performance. Estimates suggest it holds a significant portion of the BI software market, ranging between 17% and 36%, making it one of the most widely adopted platforms globally. Over 234,000 companies utilize Power BI for data analytics, with more than 5 million active subscribers benefiting from its robust functionalities.
Its adoption is particularly notable in key regions such as the United Kingdom (11.50% market share) and India (7.76%), where enterprises are leveraging its capabilities to streamline decision-making processes.
Core Features and Functional Capabilities
Power BI distinguishes itself with a combination of intuitive design, AI-driven analytics, and advanced connectivity options. Its integration with Microsoft Azure, Excel, and Office 365 enables users to perform complex analyses within a unified ecosystem.
Key features include:
- Interactive Dashboards and Reports: Enables users to visualize performance metrics and KPIs dynamically across various departments and timeframes.
- AI-Powered Insights: Incorporates Azure Machine Learning models, allowing predictive and prescriptive analytics for trend forecasting and scenario simulation.
- Real-Time Data Processing: Facilitates real-time data streaming, enabling immediate insights from continuously updated data sources.
- Data Security and Governance: Built-in compliance and security frameworks ensure safe handling of sensitive corporate data.
Table: Key Microsoft Power BI Features and Benefits (2025)
| Feature | Description | Strategic Benefit |
|---|---|---|
| Real-Time Analytics | Enables instant processing of live data feeds | Enhances rapid business decision-making |
| Azure ML Integration | Connects with Microsoft’s AI and ML platforms | Provides predictive insights for advanced forecasting |
| Interactive Dashboards | User-friendly visual analytics tools | Simplifies complex data representation |
| Cross-Platform Integration | Works seamlessly with Office 365, Excel, and Teams | Streamlines enterprise workflows |
| Scalable Cloud Infrastructure | Deployed on Microsoft Azure for reliability | Supports enterprise-grade scalability |
Pricing Model and Licensing in 2025
Microsoft Power BI continues to operate under a per-user subscription model, offering multiple licensing tiers to suit organizations of varying sizes. In 2025, the pricing structure experienced notable adjustments:
| Plan Type | Monthly Cost (per user) | Key Features |
|---|---|---|
| Power BI Pro | $14 | Collaboration tools, data visualization, and shared dashboards |
| Power BI Premium (PPU) | $24 | Advanced AI analytics, larger storage capacity, and enterprise deployment options |
The pricing revision has encouraged enterprises to reevaluate their usage strategies, focusing on cost efficiency and maximizing the return on data insights.
User Experience and Performance Evaluation
Power BI receives consistently high satisfaction ratings due to its intuitive user interface, ease of visualization creation, and compatibility with existing Microsoft products. Users particularly appreciate its drag-and-drop functionality, which accelerates report creation. However, organizations dealing with massive datasets sometimes face challenges related to processing speed and system optimization.
Strengths and Limitations Matrix
| Category | Strengths | Limitations |
|---|---|---|
| Usability | Intuitive interface and integration with Microsoft suite | Steeper learning curve for complex features |
| Performance | High-quality visualizations and real-time analysis | Potential latency with large data volumes |
| Scalability | Cloud-based flexibility via Azure | Cost increases at enterprise scale |
| Support | Active community and extensive documentation | Limited customization beyond Microsoft tools |
Why Power BI Ranks Among the Top 10 Data Analysis Software in 2025
Power BI’s enduring popularity stems from its strategic alignment with enterprise digital transformation goals. It empowers organizations to consolidate disparate data sources, extract actionable insights, and visualize performance metrics through intuitive dashboards. The continuous enhancements in AI integration and cloud scalability have positioned Power BI as a future-ready platform capable of addressing evolving analytics demands.
Enterprises increasingly favor Power BI not only for its robust analytical capabilities but also for its synergy with Microsoft’s broader ecosystem—ensuring a cohesive experience for users already operating within Office, Teams, or Azure environments. In 2025, Power BI continues to represent a gold standard for business intelligence, combining functionality, adaptability, and accessibility within a single platform designed to transform raw data into measurable business success.
2. Tableau

Tableau, developed by Salesforce, stands as one of the most prominent and influential data analysis software solutions in 2025. Recognized globally for its exceptional data visualization and interactive analytics capabilities, Tableau empowers organizations to convert vast amounts of raw, complex data into clear, actionable insights. Its intuitive and visually dynamic interface makes it a top choice for businesses aiming to implement data-driven strategies efficiently and effectively across diverse industries.
Comprehensive Overview and Market Position
Tableau continues to maintain a commanding position in the global data visualization and business intelligence (BI) market. Holding an estimated 16.7% share of the BI market and approximately 12.19% in the broader data visualization sector, Tableau serves as a benchmark in analytical excellence. Over 120,000 organizations globally rely on its platform, supported by a vibrant community of more than 4 million users contributing interactive dashboards and visualizations via Tableau Public.
Feature Overview and Analytical Capabilities
Tableau’s strength lies in its ability to transform raw datasets into insightful visual narratives that enhance understanding and accelerate decision-making. The software offers a suite of advanced analytical and visualization tools designed to cater to both technical analysts and business users.
Key functionalities include:
- Comprehensive Data Visualization: Offers a broad range of chart types, heat maps, scatter plots, and storyboards for multi-dimensional data representation.
- Real-Time Analytics: Provides instant data refresh capabilities, enabling live monitoring of performance indicators and business trends.
- AI-Driven Insights: Integrates Tableau GPT and Tableau Pulse to automate data exploration, generate predictive insights, and enhance analytical precision.
- Collaborative Workflows: Facilitates team-based collaboration with features that enable data sharing, annotation, and publishing of reports on Tableau Server or Tableau Cloud.
Table: Key Tableau Features and Business Impact (2025)
| Feature | Description | Strategic Advantage |
|---|---|---|
| Data Visualization Tools | Diverse graphical representation options | Simplifies complex data interpretation |
| Tableau GPT | AI-assisted data queries and insights | Automates analysis and boosts productivity |
| Real-Time Analytics | Live data tracking and updates | Enables immediate decision-making |
| Collaboration Tools | Team-based data sharing and publishing | Promotes data transparency and teamwork |
| Cross-Platform Integration | Connects with Salesforce, Excel, Google BigQuery, and AWS | Expands data accessibility and scalability |
Integration with Salesforce and AI Innovations
Since its acquisition by Salesforce, Tableau has significantly evolved into a more AI-empowered analytics ecosystem. The introduction of Tableau GPT leverages generative AI to provide contextual insights and narrative explanations of data trends, while Tableau Pulse enables proactive monitoring of KPIs and anomaly detection. This integration with Salesforce enhances end-to-end analytics, combining CRM data with business intelligence to deliver a unified and predictive data experience.
Pricing Structure and Licensing Model (2025)
Tableau’s pricing model in 2025 is structured around user roles, ensuring flexibility and scalability for organizations of all sizes.
| License Type | Price (Per User/Month) | Primary Use Case |
|---|---|---|
| Creator | $70 | Full data analysis, visualization creation, and integration tasks |
| Explorer | $42 | Access and modify existing dashboards for strategic insights |
| Viewer | $15 | View and interact with pre-built dashboards and reports |
All plans are billed annually, and Tableau also provides custom pricing for embedded analytics and enterprise deployments. While its cost may be higher compared to some alternatives, organizations continue to invest due to its advanced functionality, visual richness, and enterprise-level scalability.
User Experience and Market Reception
Tableau consistently earns high praise for its ease of use, sophisticated visualization tools, and active community engagement. Users value its drag-and-drop interface, vast template library, and powerful analytical depth. However, some businesses highlight cost-related concerns and note that complex data pre-processing often requires complementary tools such as Tableau Prep.
Strengths and Limitations Matrix
| Category | Strengths | Limitations |
|---|---|---|
| Visualization Quality | Industry-leading and highly customizable visual formats | Performance can slow with massive datasets |
| Usability | User-friendly interface suitable for non-technical users | Requires external tools for heavy data cleaning |
| Integration | Deep integration with Salesforce and other data platforms | Limited version control for collaborative environments |
| Scalability | Suitable for enterprises and SMEs | High costs for large-scale implementations |
Why Tableau Ranks Among the Top 10 Data Analysis Software in 2025
Tableau’s enduring success in 2025 can be attributed to its unmatched visualization capabilities, robust AI integration, and adaptability to modern business intelligence demands. Its ability to connect seamlessly to diverse data sources — from cloud-based systems like AWS and Google BigQuery to on-premise databases — ensures flexibility across various enterprise ecosystems.
Organizations choose Tableau not merely for its visual appeal but for its analytical depth, empowering decision-makers to uncover trends, patterns, and insights that might otherwise remain hidden. The platform’s continuous evolution, driven by Salesforce’s AI innovation, cements Tableau’s role as a vital component of digital transformation strategies in 2025.
Tableau exemplifies the convergence of intuitive design, intelligent automation, and enterprise scalability — making it one of the most indispensable data analysis software solutions for businesses striving to harness the full potential of their data assets.
3. Qlik Sense
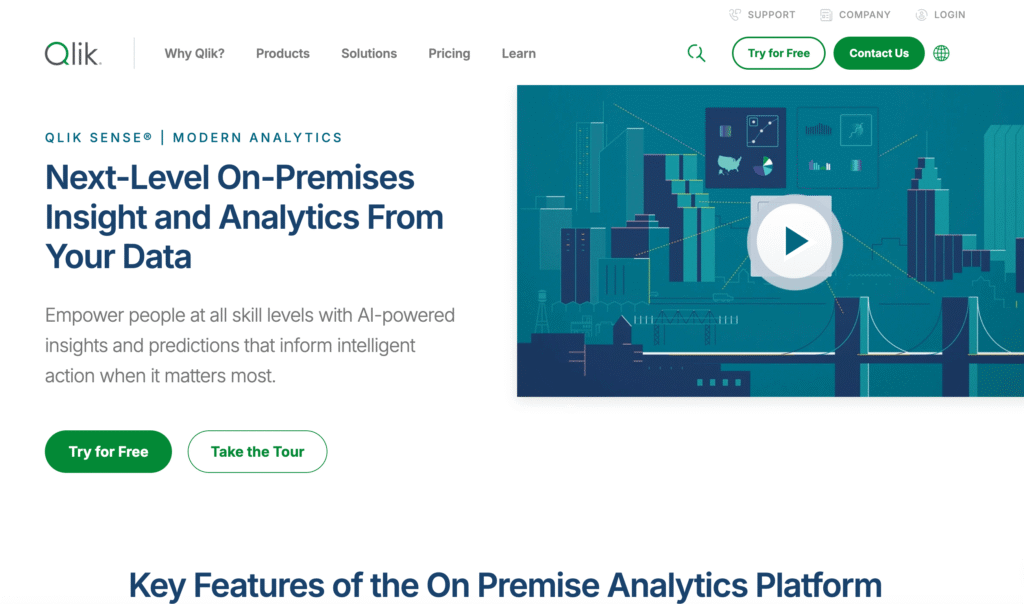
Qlik Sense continues to stand out as one of the most advanced and reliable data analysis software solutions in 2025, providing enterprises with a self-service analytics environment that empowers users to explore, visualize, and interpret data intuitively. Renowned for its distinctive associative data model, Qlik Sense allows users to uncover insights and relationships across data sources that are often overlooked by traditional query-based BI tools. This powerful and flexible platform has solidified its position as one of the top 10 data analysis software solutions of the year, widely adopted across industries seeking agility and deeper analytical intelligence.
Comprehensive Overview and Market Standing
Qlik Sense maintains a strong reputation within the business intelligence and data analytics sector. With user ratings averaging 4.6 out of 5 from leading review platforms, it continues to earn recognition for its innovation in associative data exploration and visual analytics. Its market share in data visualization technologies, estimated at 2.10%, underscores its growing relevance among organizations pursuing advanced BI solutions.
Enterprises across sectors such as finance, manufacturing, retail, and healthcare rely on Qlik Sense to integrate multiple data streams, visualize key metrics, and make informed business decisions in real time. The software’s flexibility in deployment—whether on-premise, in the cloud, or through hybrid setups—further enhances its value for organizations of various sizes and technical capacities.
Core Features and Analytical Capabilities
Qlik Sense’s hallmark is its patented Associative Engine, a core innovation that allows users to explore data without predefined queries or hierarchical constraints. Unlike linear query-based analytics tools, Qlik’s associative technology enables users to see connections between data points dynamically, revealing patterns, anomalies, and hidden relationships.
Key features include:
- Associative Data Exploration: Allows users to intuitively navigate data relationships beyond structured hierarchies, offering a non-linear, discovery-driven analytical experience.
- AI-Powered Insights with Insight Advisor: Uses artificial intelligence to suggest relevant data visualizations, perform predictive analysis, and interpret natural language queries.
- Smart Visualizations: Provides customizable dashboards, dynamic charts, and storyboards that simplify the understanding of complex datasets.
- Data Integration and Scalability: Supports integration with diverse data sources including databases, APIs, and spreadsheets, ensuring enterprise-wide data consistency.
- Flexible Deployment Models: Offers cloud, on-premise, and hybrid deployment to suit different business infrastructures and regulatory environments.
Table: Qlik Sense Features and Strategic Benefits (2025)
| Feature | Description | Business Value |
|---|---|---|
| Associative Engine | Enables dynamic and context-aware data exploration | Reveals hidden insights across data relationships |
| Insight Advisor | AI-driven assistance for data queries and visualization creation | Simplifies data interpretation for non-technical users |
| Smart Visualizations | Highly interactive dashboards and charts | Enhances clarity and presentation of business data |
| Multi-Source Integration | Connects to databases, cloud storage, and APIs | Consolidates scattered data into a unified analytical view |
| Deployment Flexibility | Cloud, on-premise, or hybrid deployment options | Adapts to enterprise-specific IT strategies |
Artificial Intelligence and Advanced Automation
Qlik Sense leverages AI through its Insight Advisor—an embedded intelligent assistant designed to guide users in exploring data, generating automatic visualizations, and executing natural language queries. By combining AI with its associative model, Qlik Sense bridges the gap between human reasoning and machine-driven analytics. This allows organizations to achieve a deeper understanding of operational performance, customer behavior, and market dynamics with minimal technical intervention.
Pricing Structure and Licensing Overview (2025)
Qlik Sense adopts a role-based pricing approach, offering plans tailored to varying levels of access and capability.
| User Type | Description | Price Range (Est.) | Key Benefits |
|---|---|---|---|
| Full User | Complete access for creating, analyzing, and managing data apps | Premium Tier | Enables full customization and advanced analytics |
| Basic User | Limited to viewing and interacting with existing dashboards | Standard Tier | Ideal for business users and stakeholders |
| Enterprise Plan | Custom packages for large organizations | Variable (by contract) | Provides enterprise-scale scalability and governance tools |
The pricing model is designed to accommodate both small teams and global enterprises, ensuring cost-effectiveness while maintaining analytical depth. While some users cite its pricing as relatively higher compared to competitors, the return on investment is often justified by its advanced capabilities and scalability.
Performance, Usability, and Limitations
User feedback highlights Qlik Sense’s intuitive interface, high-speed data processing, and the unique analytical freedom offered by its associative engine. Its ability to handle complex, high-volume datasets efficiently makes it ideal for enterprises requiring deep and flexible data exploration.
However, certain challenges exist. Some users have reported that Qlik Sense’s built-in data governance controls and visualization customization options could be more extensive. Additionally, large-scale deployments can incur higher operational costs due to licensing structures and infrastructure requirements.
Strengths and Limitations Matrix
| Category | Strengths | Limitations |
|---|---|---|
| Analytical Model | Unique associative engine for intuitive data discovery | Requires user training for full utilization |
| Visualization | Highly interactive and customizable | Fewer default visualization options than competitors |
| Integration | Broad connectivity with third-party systems | Data governance features require add-ons |
| Scalability | Excellent for large-scale, enterprise analytics | Can become costly at scale |
Why Qlik Sense Ranks Among the Top 10 Data Analysis Software in 2025
Qlik Sense earns its place among the top data analysis software of 2025 due to its innovative approach to data exploration, its AI-powered automation, and its unmatched ability to uncover hidden insights across complex datasets. Unlike traditional BI tools that rely on predefined queries, Qlik’s associative model fosters a culture of analytical discovery, empowering users at all levels to make informed, data-driven decisions.
Its integration with advanced AI technologies, flexible deployment models, and scalability make it suitable for both agile startups and multinational enterprises. In 2025, organizations continue to adopt Qlik Sense not just as a visualization platform but as a comprehensive analytical ecosystem that transforms data into a strategic asset—enabling deeper insight generation, faster decision-making, and sustained competitive advantage in an increasingly data-driven world.
4. Looker (Google Looker Studio)
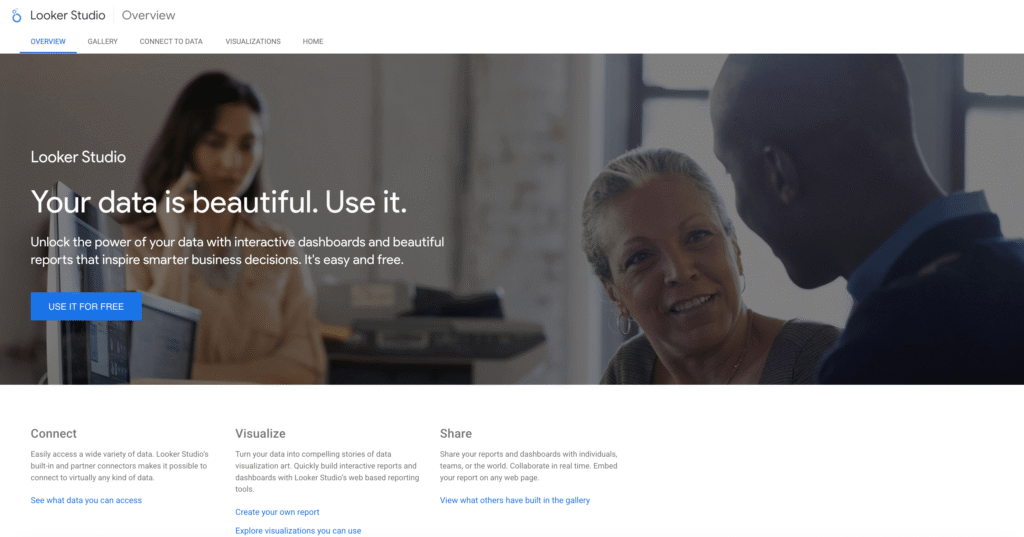
Looker, now branded as Google Looker Studio, stands among the most advanced and reliable data analysis software platforms in 2025. As a fully cloud-based business intelligence and big data analytics solution, it enables organizations to derive actionable insights from live data sources while leveraging the scalability, speed, and security of Google Cloud’s infrastructure. Looker’s primary appeal lies in its powerful modeling layer, LookML, which allows enterprises to define, standardize, and manage complex data relationships across multiple systems, creating a single source of truth for business intelligence operations. Its strong analytical foundation, seamless integration with Google Cloud, and real-time data capabilities make it one of the top 10 data analysis software solutions in 2025.
Comprehensive Overview and Market Position
Looker has maintained steady growth within the business intelligence and analytics market. With an estimated market share of around 1.60% in data visualization technologies and average ratings of 4.25 and 4.4 out of 5 on major platforms, Looker has solidified its reputation as a trusted analytics solution for both enterprises and mid-sized organizations. It is particularly favored by companies operating within the Google Cloud ecosystem due to its smooth interoperability with other Google products such as BigQuery, Sheets, and Google Ads.
By 2025, Looker continues to serve as a strategic enabler for data-driven organizations, helping them integrate vast data sources, automate analytics workflows, and customize reporting environments based on specific departmental or executive needs.
Core Features and Analytical Capabilities
Looker’s architecture and functionality revolve around three primary pillars: flexibility, real-time analytics, and scalability. Its use of LookML (Looker Modeling Language) distinguishes it from many competitors, allowing users to build consistent data models and define metrics that maintain accuracy across all reports and dashboards.
Key functionalities include:
- Centralized Data Modeling through LookML: Provides a consistent and reusable data structure that reduces redundancy, ensuring data integrity across the organization.
- Real-Time Data Exploration: Connects directly to live databases, eliminating the need for data extracts and offering up-to-date analytical results.
- Seamless Google Cloud Integration: Integrates natively with Google BigQuery, Google Analytics, and Cloud Storage, enabling organizations to utilize Google’s computational power for advanced analytics.
- Customizable Dashboards and Reports: Enables users to create tailored, interactive dashboards suited to diverse analytical needs, from executive overviews to operational monitoring.
- Collaboration and Data Sharing: Empowers teams to collaborate effectively by sharing real-time dashboards and embedding analytics into existing workflows.
Table: Key Features and Strategic Business Advantages (2025)
| Feature | Description | Strategic Benefit |
|---|---|---|
| LookML Modeling Language | Defines reusable data relationships and metrics | Ensures consistent data governance and accuracy |
| Real-Time Analytics | Connects to live databases without extraction | Provides up-to-date insights for faster decisions |
| Google Cloud Integration | Native compatibility with Google’s cloud ecosystem | Enhances scalability, reliability, and processing efficiency |
| Customizable Dashboards | Allows tailored reports and visualizations | Delivers department-specific data insights |
| Embedded Analytics | Integrates Looker’s analytics into external applications | Expands data accessibility for wider organizational use |
Integration within the Google Cloud Ecosystem
Looker’s deep integration with Google Cloud services significantly enhances its analytical potential. The platform capitalizes on BigQuery’s advanced processing capabilities to manage vast datasets efficiently while maintaining real-time analytical responsiveness. Additionally, integration with Google Workspace tools allows users to incorporate analytics seamlessly into existing workflows—whether within spreadsheets, presentations, or CRM environments.
This ecosystem-centric approach transforms Looker from a standalone BI platform into a dynamic component of enterprise cloud analytics, fostering more intelligent, automated, and collaborative decision-making processes.
Pricing Structure and Licensing Model (2025)
Looker operates on a customized pricing model based on usage scale, features, and deployment requirements. While pricing may vary depending on enterprise needs, many smaller teams report base costs starting around $35,000 annually. The platform offers three main editions designed for varying operational needs:
| Edition | Description | Ideal For |
|---|---|---|
| Standard | Includes essential BI and dashboard features | Small to medium businesses requiring flexible analytics |
| Enterprise | Provides advanced governance, scalability, and API integrations | Large organizations with complex data needs |
| Embed | Allows analytics embedding within external apps and portals | SaaS providers and customer-facing platforms |
While its cost is often higher than average BI tools, organizations justify the investment by emphasizing Looker’s advanced customization options, integration depth, and scalability.
User Experience, Performance, and Limitations
Looker receives consistently favorable feedback for its reliability, user interface simplicity, and powerful data modeling capabilities. Reviewers often commend its ability to handle large-scale analytics operations while maintaining performance consistency. Its drag-and-drop dashboard customization and real-time analytics features further enhance its usability for both technical and non-technical users.
However, users also note some challenges, particularly the steep learning curve associated with LookML for beginners and occasional limitations in complex statistical modeling compared to specialized data science tools.
Strengths and Limitations Matrix
| Category | Strengths | Limitations |
|---|---|---|
| Data Modeling | Centralized and consistent data definitions via LookML | Requires technical expertise for optimal use |
| Integration | Deep integration with Google Cloud and BigQuery | Limited native integrations outside Google ecosystem |
| Customization | Highly adaptable dashboards and embedded analytics | Longer setup time for complex implementations |
| Performance | Real-time data queries and strong scalability | High cost for small or budget-conscious teams |
Why Looker (Google Looker Studio) Ranks Among the Top 10 Data Analysis Software in 2025
Looker’s position among the top data analysis software solutions in 2025 is driven by its unmatched combination of real-time analytics, scalable cloud architecture, and powerful data modeling capabilities. Unlike traditional BI platforms that rely heavily on static datasets, Looker’s live connection approach allows businesses to make decisions based on current, continuously updated information.
Its seamless integration with Google Cloud services and AI infrastructure makes it particularly advantageous for organizations already operating within the Google ecosystem. This ensures efficiency, security, and long-term scalability across global operations.
Looker’s adaptability, from departmental analytics to embedded solutions for SaaS applications, demonstrates its versatility and future-readiness. By empowering enterprises to customize, centralize, and democratize their data analytics, Looker remains a vital solution in 2025 for organizations striving to build data-driven cultures, improve operational transparency, and sustain competitive advantage in a rapidly evolving digital landscape.
5. Domo
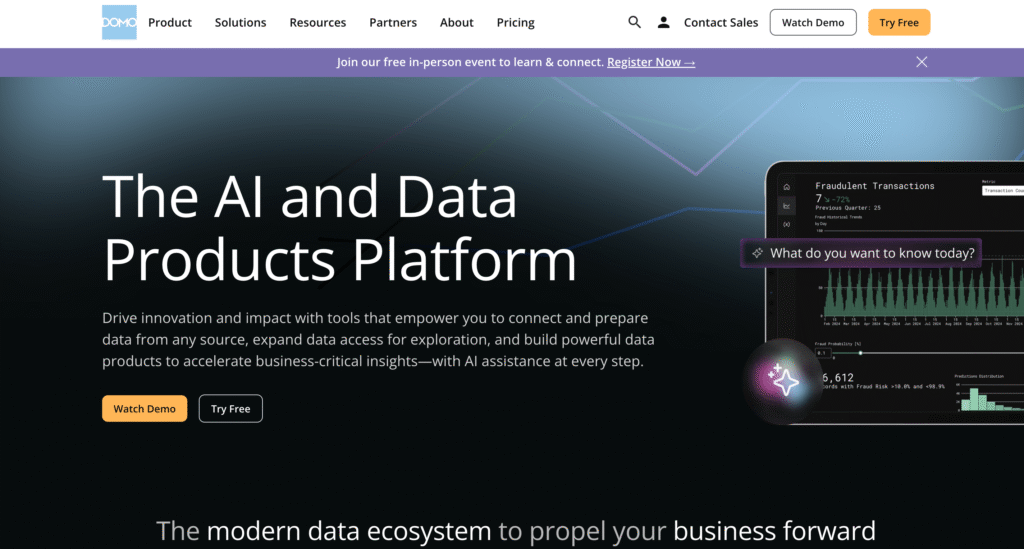
Domo stands as one of the most innovative and comprehensive data analysis software solutions in 2025, offering a unified platform that seamlessly integrates, visualizes, and interprets data for modern enterprises. Recognized for its exceptional usability and end-to-end analytical capabilities, Domo continues to redefine how businesses interact with data to drive informed decisions, foster collaboration, and enhance organizational agility.
Overview and Core Purpose
Domo is an advanced cloud-based platform engineered to centralize data from multiple systems—ranging from cloud applications and on-premise databases to social media and CRM tools—into a single interactive dashboard. Its primary objective is to make data accessible and comprehensible to all users, regardless of their technical expertise, thereby enabling teams to transform raw data into actionable business intelligence in real time.
Key Features and Functional Strengths
- Unified Data Integration: Domo supports seamless real-time data connectivity with hundreds of data sources. This allows users to unify information from marketing, sales, operations, and finance systems into one consistent view.
- Drag-and-Drop Dashboard Builder: The intuitive interface allows business users to create customized dashboards and reports without requiring programming skills, democratizing data visualization across departments.
- AI-Driven Insights: Leveraging artificial intelligence, Domo provides predictive analytics that identify hidden trends, forecast potential outcomes, and optimize strategic planning.
- Collaborative Analytics Environment: Built-in sharing and commenting features allow teams to collaborate directly within dashboards, improving communication and accelerating decision cycles.
- Custom Application Development: Users can create tailored applications to automate workflows, track KPIs, and design data-driven solutions specific to departmental goals.
Quantitative Overview of Domo’s Capabilities
| Metric / Feature | Description | Performance Impact |
|---|---|---|
| Data Integration Speed | Real-time synchronization with multiple data sources | Enhances decision-making agility |
| User Interface Rating | 4.45 out of 5 (based on aggregated reviews) | Indicates high user satisfaction |
| AI & Predictive Analytics | Machine learning-based forecasting tools | Improves strategic accuracy |
| Customization Flexibility | Drag-and-drop dashboard builder | Simplifies design and deployment |
| Collaboration Efficiency | Shared dashboard features with team tagging | Boosts cross-functional communication |
Advantages and Competitive Edge
Domo’s major competitive advantage lies in its balance between accessibility and analytical sophistication. Its ease of use eliminates dependency on technical specialists, allowing business users to independently derive insights. Moreover, the real-time nature of Domo’s analytics ensures organizations stay agile in fast-changing markets. The platform’s collaborative architecture strengthens its appeal to enterprises emphasizing teamwork and transparency.
Potential Limitations
While Domo offers an extensive array of functionalities, certain users may find that some advanced analytics capabilities are more limited compared to specialized statistical platforms. Additionally, its pricing model is customized and not publicly disclosed, which may require organizations to request quotes for precise cost evaluation.
Why Domo Ranks Among the Top 10 Data Analysis Software in 2025
Domo’s inclusion among the leading data analysis software in 2025 stems from its seamless combination of usability, real-time intelligence, and collaboration-driven design. Its emphasis on empowering non-technical professionals to harness complex data insights sets it apart from competitors. Furthermore, its AI-enhanced predictive models and customizable dashboards align with modern business demands for agility, scalability, and innovation.
Performance Comparison Matrix (2025 Industry Benchmark)
| Evaluation Criteria | Domo | Power BI | Tableau | Qlik Sense |
|---|---|---|---|---|
| Ease of Use | Excellent | Very Good | Good | Good |
| Real-Time Data Integration | Excellent | Good | Good | Very Good |
| AI and Predictive Capabilities | Advanced | Moderate | Moderate | Moderate |
| Custom App Development | Excellent | Limited | Limited | Moderate |
| Collaboration Tools | Strong | Average | Average | Strong |
Domo’s holistic approach to data analytics, combining technical innovation with human-centered design, solidifies its reputation as a top-tier solution for enterprises seeking real-time intelligence, seamless integration, and organizational empowerment through data.
6. QlikView
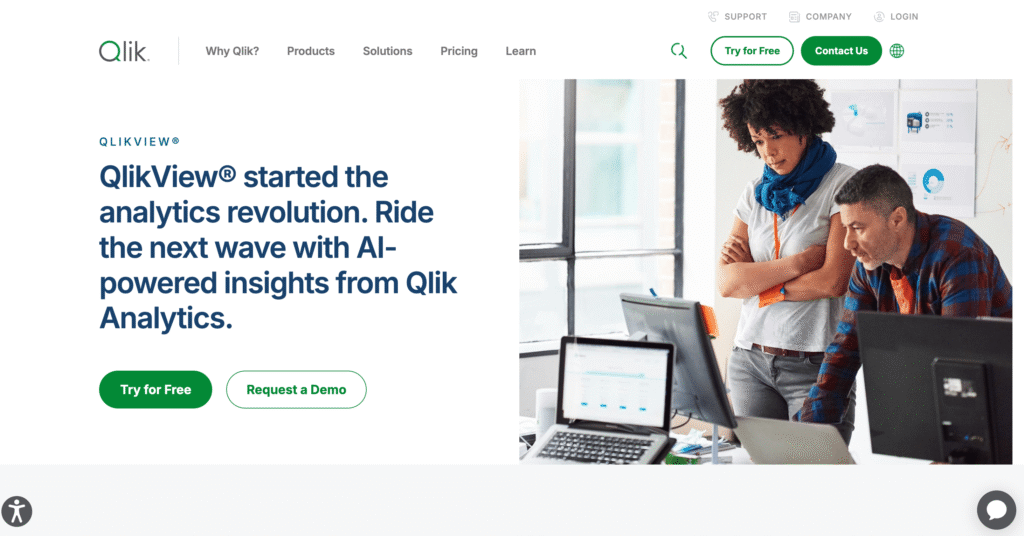
QlikView remains one of the most influential and enduring data analysis software solutions in 2025, maintaining its reputation for powerful in-memory analytics and associative data exploration. As a flagship product from Qlik, it has laid the foundation for modern business intelligence systems, enabling organizations to derive meaningful insights through intuitive data interaction and rapid analysis. Despite the emergence of newer platforms like Qlik Sense, QlikView continues to serve as a robust and reliable tool for enterprises seeking high-speed, data-driven decision-making.
Comprehensive Overview and Core Purpose
QlikView is designed to deliver fast, interactive, and associative data analysis through its proprietary in-memory technology. The platform eliminates traditional query-based limitations by allowing users to explore relationships between data points dynamically, ensuring no insight is overlooked. Its purpose extends beyond simple visualization—it fosters a deeper understanding of business data, empowering decision-makers to uncover hidden trends and correlations that drive operational and strategic improvements.
Key Functionalities and Technological Advantages
- In-Memory Associative Engine: QlikView processes data directly in memory, which significantly accelerates query responses and analytical computations. This architecture supports instantaneous exploration, allowing users to compare multiple data dimensions effortlessly.
- Associative Search Technology: Unlike traditional BI tools that rely on predefined hierarchies, QlikView enables users to discover data associations freely. This intuitive search capability ensures that every relationship within the dataset can be easily navigated and understood.
- Interactive Data Visualization: The platform provides dynamic and customizable dashboards that visualize complex datasets in an easy-to-digest format, enabling non-technical users to identify key insights quickly.
- Scalable Enterprise Deployment: QlikView supports enterprise-level scalability, making it suitable for organizations handling extensive and diverse datasets across departments and geographies.
- Data Security and Governance: With integrated data access controls and compliance management, QlikView ensures that analytics remain secure, consistent, and trustworthy.
Quantitative and Performance Evaluation
| Feature / Metric | Description | Business Impact |
|---|---|---|
| Processing Speed | In-memory architecture for rapid analytics | Enhances real-time decision-making |
| User Flexibility | Associative data exploration model | Improves discovery of hidden insights |
| Visualization Quality | Interactive and customizable dashboards | Simplifies data interpretation |
| Deployment Scalability | Enterprise-level deployment and control | Ensures system reliability and adaptability |
| Security Standards | Advanced governance and access control | Safeguards organizational data integrity |
Strengths and Competitive Edge
QlikView’s competitive advantage lies in its pioneering associative engine, which offers unparalleled analytical flexibility. Unlike conventional query-based models that restrict exploration, QlikView empowers users to move across data dimensions intuitively, fostering organic discovery of insights. Its speed, driven by in-memory processing, allows for instantaneous responses to analytical queries, reducing latency in strategic decisions. Additionally, its ability to manage complex enterprise data structures has made it a dependable choice for organizations seeking reliability and consistency in analytics operations.
Potential Limitations
While QlikView remains a powerful tool, its design reflects a more traditional business intelligence framework. Compared to cloud-native and AI-driven modern analytics platforms, QlikView may appear less adaptive to evolving real-time collaboration and automation trends. Furthermore, Qlik’s strategic focus on its next-generation solution, Qlik Sense, may limit QlikView’s ongoing innovation and feature expansion.
Why QlikView Ranks Among the Top 10 Data Analysis Software in 2025
QlikView’s inclusion among the top data analysis software of 2025 is a testament to its proven reliability, analytical depth, and performance efficiency. Its associative data model and in-memory technology continue to outperform many legacy systems in speed and flexibility. The platform remains highly valuable for organizations that prioritize controlled, secure, and powerful analytics in an on-premise or hybrid environment. QlikView’s foundational role in shaping the business intelligence industry further cements its status as a cornerstone technology in enterprise analytics.
Comparative Feature Matrix (2025 Industry Benchmark)
| Evaluation Criteria | QlikView | Qlik Sense | Tableau | Power BI |
|---|---|---|---|---|
| Processing Speed | Excellent | Very Good | Good | Very Good |
| Associative Data Model | Unique | Advanced | Limited | Limited |
| Visualization Capabilities | Good | Excellent | Excellent | Excellent |
| Cloud Adaptability | Moderate | Strong | Strong | Strong |
| Enterprise Scalability | Excellent | Excellent | Very Good | Good |
QlikView continues to be recognized as a data analytics leader due to its unmatched speed, data discovery model, and enduring enterprise reliability. Even as analytics evolves towards AI-driven cloud systems, QlikView’s precision, stability, and intuitive exploration capabilities ensure its relevance and significance among the top-tier data analysis platforms in 2025.
7. SAS Analytics
SAS Analytics remains one of the most powerful and sophisticated data analysis software platforms in 2025, maintaining its dominance in the advanced analytics and enterprise intelligence sector. Recognized for its unparalleled statistical precision and enterprise-grade reliability, SAS continues to be the preferred choice among large organizations that demand high accuracy, security, and compliance in data-driven operations. Its comprehensive analytical capabilities, spanning predictive modeling, machine learning, and statistical analysis, position it among the top data analysis solutions for complex and regulated industries such as finance, pharmaceuticals, and government sectors.
Comprehensive Overview and Core Purpose
SAS Analytics is purpose-built to handle complex and large-scale data environments, providing a unified platform for advanced statistical computation, data management, and visualization. It empowers enterprises to transform raw data into actionable insights through its proprietary SAS programming language and integrated analytical components. By supporting a wide range of analytical functions—from regression analysis and forecasting to optimization and simulation—SAS enables data scientists and analysts to develop sophisticated models that drive evidence-based decision-making across industries.
Key Functionalities and Analytical Capabilities
- Advanced Statistical Modeling: SAS offers over 200 specialized modules covering predictive analytics, econometrics, machine learning, data mining, and operational research, providing a holistic toolkit for comprehensive data interpretation.
- Proprietary SAS Programming Language: Its robust programming language allows precise control over statistical operations and model customization, offering unmatched flexibility for advanced users.
- AI and Machine Learning Integration: SAS Analytics seamlessly integrates AI algorithms to automate pattern detection, anomaly recognition, and trend forecasting, enhancing the accuracy of business predictions.
- Data Management and Governance: Equipped with strong data cleansing, transformation, and validation features, SAS ensures that all analyses are based on high-quality, consistent, and compliant data sources.
- Scalability and Security: As a proprietary enterprise system, SAS is optimized for secure deployment at scale, supporting cloud, on-premise, and hybrid environments while maintaining strict compliance with global data regulations.
Quantitative and Performance Insights
| Metric / Capability | Description | Business Value |
|---|---|---|
| Analytical Components | 200+ specialized modules | Supports comprehensive data modeling |
| User Rating (2025) | 4.6 / 5 average satisfaction | Strong reliability and enterprise trust |
| Deployment Models | Cloud, on-premise, hybrid | Flexible enterprise scalability |
| Starting Cost (Per User) | Approximately $1,500 | Cost-effective for small-scale usage |
| Processing Efficiency | High-speed analytical computations | Reduces decision latency |
Strengths and Competitive Edge
SAS Analytics stands out for its scientific rigor and methodological depth, making it ideal for organizations requiring advanced quantitative analysis. Its statistical accuracy and ability to manage extensive datasets distinguish it from competitors focused primarily on visualization. The system’s enterprise reliability, long-standing industry reputation, and integration of AI-powered automation further solidify its position as a leader in enterprise analytics. SAS’s robust data governance and compliance capabilities also make it particularly valuable for sectors dealing with sensitive or regulated data.
Potential Limitations
Despite its powerful features, SAS faces challenges related to cost and accessibility. As a closed-source and premium-priced solution, it may not be feasible for smaller businesses or open-source communities. Additionally, the proprietary nature of its programming language can lead to steeper learning curves and reduced flexibility compared to open-source alternatives like R or Python-based analytics ecosystems.
Why SAS Analytics Ranks Among the Top 10 Data Analysis Software in 2025
SAS Analytics is recognized among the top-tier data analysis tools in 2025 because of its unmatched analytical depth, scalability, and trustworthiness in mission-critical environments. Its comprehensive ecosystem allows businesses to handle the full analytics lifecycle—from data ingestion to predictive modeling—within a single, secure framework. Organizations across the globe continue to rely on SAS for its ability to deliver consistent, validated, and actionable results, especially in environments where data accuracy and compliance are paramount.
Comparative Feature Matrix (2025 Benchmark Analysis)
| Evaluation Criteria | SAS Analytics | IBM SPSS | Python (Pandas + SciKit) | RStudio |
|---|---|---|---|---|
| Analytical Depth | Excellent | Very Good | Very Good | Excellent |
| Ease of Use | Moderate | High | Moderate | Moderate |
| Cost Accessibility | Low | Moderate | High | High |
| Statistical Accuracy | Exceptional | High | High | Exceptional |
| Enterprise Scalability | Excellent | Very Good | Moderate | Moderate |
| Proprietary vs. Open Source | Proprietary | Proprietary | Open Source | Open Source |
Industry Relevance and Future Outlook
SAS Analytics continues to evolve in 2025, adapting to the growing demand for automation and cloud-based scalability. Its integration of machine learning and AI-driven analytics ensures that it remains at the forefront of innovation while preserving its legacy of precision and dependability. For organizations prioritizing data governance, risk management, and advanced statistical modeling, SAS remains an essential pillar of enterprise-level analytics infrastructure, validating its position as one of the top 10 data analysis software solutions in 2025.
8. KNIME Analytics Platform
KNIME Analytics Platform has firmly established itself as one of the most powerful and versatile data analysis tools in 2025, earning global recognition for its open-source accessibility, modular design, and advanced capabilities in data science, machine learning, and predictive analytics. Built for both beginners and expert analysts, KNIME empowers organizations to efficiently handle end-to-end analytics workflows—ranging from data extraction and transformation to advanced statistical modeling and deployment—without requiring extensive coding expertise. Its seamless balance between usability, flexibility, and integration makes it a top contender in the global data analytics software landscape.
Comprehensive Overview and Core Purpose
KNIME Analytics Platform serves as a unified environment for managing the complete data lifecycle, enabling users to visually design workflows using an intuitive drag-and-drop interface. The platform is purpose-built to simplify complex data operations, providing a graphical, node-based interface that eliminates the need for manual programming while still allowing advanced users to customize operations with scripts in Python, R, and Java. Its open-source foundation encourages innovation, transparency, and adaptability, making it particularly appealing to research institutions, startups, and enterprises looking for cost-effective yet sophisticated analytical solutions.
Key Functionalities and Technical Capabilities
- Visual Workflow Interface: KNIME provides a modular, drag-and-drop workflow environment where users can create, test, and deploy analytics pipelines without writing extensive code.
- Extensive Node Library: With over 4,000 pre-built nodes, the platform allows users to perform a wide range of operations—data cleansing, transformation, statistical analysis, machine learning, and predictive modeling—within a unified framework.
- Seamless Integration with Other Tools: KNIME easily connects with external tools and programming environments such as Python, R, and Java, enabling hybrid analytical workflows.
- Machine Learning and AI Support: KNIME supports both traditional machine learning algorithms and deep learning frameworks, allowing data scientists to build and test predictive models directly within the platform.
- Open-Source Flexibility: Its free and open-source model promotes transparency and community-driven innovation, while enterprise users can access enhanced scalability and governance features through KNIME Business Hub.
Quantitative and Performance Insights
| Metric / Capability | KNIME Analytics Platform (2025) | Industry Average | Competitive Advantage |
|---|---|---|---|
| Global User Base | ~500,000 active users | 300,000 | Broad adoption in academia and enterprise |
| Mindshare (Data Science Platforms) | 11.4% | 8% | Above-average presence in data science tools |
| Node Library | 4,000+ functional nodes | 2,500 | Comprehensive node-based architecture |
| Integration Coverage | Python, R, Java, SQL, TensorFlow | Limited in many peers | Exceptional interoperability |
| User Rating (2025) | 4.6 / 5 | 4.2 / 5 | High satisfaction among professionals |
Strengths and Distinctive Advantages
KNIME Analytics Platform’s strength lies in its democratization of data analytics. Its open-source nature eliminates financial barriers while offering enterprise-grade capabilities. The visual programming interface allows non-technical professionals to create sophisticated analytical workflows intuitively, while advanced users can script and extend its capabilities. The platform’s strong community support, frequent updates, and extensive documentation make it one of the most user-supported open-source ecosystems in the analytics field.
Other defining strengths include:
- Cost Efficiency: Completely free to use, with optional commercial extensions.
- Flexibility and Extensibility: Supports plug-ins and third-party integrations for diverse analytical needs.
- Community and Collaboration: A vast and active global user community contributes regular extensions and best practices.
- Interoperability: Connects with numerous data sources, cloud services, and analytical libraries, promoting seamless data flow across systems.
Potential Weaknesses and Challenges
While KNIME is robust and highly adaptable, it does face certain limitations. Users managing extremely large datasets may experience performance bottlenecks, particularly in memory-intensive operations. Additionally, while the visual interface simplifies analysis for non-programmers, mastering KNIME’s full feature set requires time and training. The absence of certain automated data governance tools, available in proprietary enterprise software, can also limit its scalability in large corporate environments.
Why KNIME Analytics Platform Ranks Among the Top 10 Data Analysis Software in 2025
KNIME’s inclusion in the list of top data analysis software in 2025 stems from its unique ability to blend open-source freedom with enterprise functionality. Its wide adoption across sectors—including academia, pharmaceuticals, finance, and manufacturing—demonstrates its versatility and performance. Organizations benefit from KNIME’s low total cost of ownership, adaptability for custom analytics use cases, and the strong collaborative ecosystem driving continuous innovation.
Comparative Performance Matrix (2025 Overview)
| Evaluation Criteria | KNIME Analytics Platform | RapidMiner | Orange | Alteryx |
|---|---|---|---|---|
| Open Source | Yes | Partial | Yes | No |
| Machine Learning Support | Excellent | Excellent | Good | Excellent |
| Community Support | Very Strong | Moderate | Strong | Limited |
| Ease of Use | High | Moderate | High | Very High |
| Scalability | Moderate | High | Moderate | Very High |
| Cost | Free | Freemium | Free | Premium |
Industry Relevance and Future Outlook
In 2025, KNIME continues to evolve as a central hub for open, collaborative, and flexible analytics. With the increasing integration of AI, automation, and cloud technologies, KNIME is expected to further expand its capabilities for real-time analytics, automated model training, and data governance. Its commitment to open innovation and inclusivity positions it as a long-term leader in the democratization of data science. For businesses and researchers seeking an adaptable, transparent, and cost-effective analytics environment, KNIME remains one of the most trusted and forward-looking platforms in the data analytics ecosystem.
9. R Programming
R Programming remains one of the most influential and widely adopted tools in the global data analysis landscape in 2025, particularly revered for its precision in statistical computation, visualization, and data modeling. Designed specifically for statisticians, researchers, and data scientists, R stands as a cornerstone of analytical research and data exploration across industries such as finance, healthcare, academia, and government. Its open-source nature, extensive library ecosystem, and active global community make it an indispensable tool for data professionals seeking advanced analytical accuracy and customization.
Comprehensive Overview and Core Functionality
R is a programming language and software environment purpose-built for statistical computing and graphics. It provides a robust platform for performing quantitative analysis, data visualization, and predictive modeling. Its ecosystem, fueled by thousands of user-contributed packages, enables researchers to handle a wide range of data tasks—from exploratory data analysis to high-dimensional statistical modeling and machine learning. R’s flexibility and precision make it particularly valuable for organizations that rely on rigorous, reproducible statistical insights for evidence-based decision-making.
Key Features and Analytical Capabilities
- Specialized Statistical Computing: R offers a complete suite of functions for regression analysis, time-series forecasting, hypothesis testing, and multivariate analysis, supporting complex quantitative workflows.
- Extensive Library Ecosystem: With over 18,000 packages available through CRAN, R provides access to advanced frameworks such as Tidyverse for data manipulation, ggplot2 for visualization, and caret for machine learning.
- High-Quality Visualizations: The language excels in producing detailed, publication-ready graphics and custom visual analytics through libraries like ggplot2, lattice, and plotly.
- Integration and Compatibility: R easily integrates with other programming environments, including Python, C++, and Java, as well as with major analytics tools such as Tableau, Power BI, and Spark.
- Open-Source Accessibility: As a completely free language, R provides powerful capabilities to individuals, academic institutions, and enterprises without licensing costs.
Quantitative and Performance Insights
| Metric / Capability | R Programming (2025) | Industry Average | Competitive Advantage |
|---|---|---|---|
| Market Presence (Job Demand) | 20% of global data roles | 14% | High career relevance |
| Library Ecosystem | 18,000+ packages | 9,000 | Largest open-source library base |
| User Rating (2025) | 4.7 / 5 | 4.3 / 5 | High satisfaction in academia & research |
| Cost | Free (Open Source) | Varies | Highly cost-efficient |
| Visualization Quality | Advanced | Moderate | Superior graphical precision |
Strengths and Distinctive Advantages
R’s power lies in its deep specialization in statistical analysis and visualization. Its domain-specific design provides researchers and analysts with tools that go far beyond surface-level analytics, enabling the exploration of intricate data relationships and advanced predictive models. The open-source nature of R fosters continuous innovation, as developers and institutions worldwide contribute new packages that expand its analytical capabilities.
Notable strengths include:
- Statistical Excellence: Purpose-built for quantitative and inferential analysis, offering tools for every statistical methodology.
- Visualization Mastery: Capable of creating highly customizable and aesthetically refined graphics for professional reporting.
- Strong Community and Research Support: Backed by a global network of academics and developers ensuring constant updates and innovation.
- Cross-Platform Integration: Works seamlessly with data warehouses, APIs, and analytics frameworks.
Potential Weaknesses and Challenges
Despite its strong analytical depth, R poses a steeper learning curve, especially for beginners unfamiliar with programming concepts. Compared to Python, it is less suitable for general-purpose development tasks and automation workflows. Additionally, R can be less efficient in handling extremely large datasets or real-time analytics when not paired with optimized environments such as Spark or cloud integrations.
Why R Programming Ranks Among the Top 10 Data Analysis Software in 2025
R’s inclusion among the top 10 data analysis software in 2025 is attributed to its enduring dominance in statistical computing and academic research. It remains the preferred choice for professionals seeking in-depth, reproducible analysis and precision-driven insights. Its relevance in modern data science is reflected by the consistent presence of R in approximately 20% of global data analyst job postings, underscoring its professional importance and long-term viability.
Comparative Analysis of Leading Data Analysis Tools (2025)
| Evaluation Criteria | R Programming | Python (Pandas, NumPy) | SAS Analytics | MATLAB |
|---|---|---|---|---|
| Statistical Precision | Exceptional | Excellent | Exceptional | High |
| Ease of Learning | Moderate | High | Moderate | Moderate |
| Cost | Free | Free | Premium | Premium |
| Visualization Capability | Advanced | High | Moderate | High |
| Community Support | Extensive | Extensive | Moderate | Moderate |
| Integration Flexibility | High | Very High | High | Moderate |
Industry Relevance and Future Outlook
In 2025, R continues to solidify its role as a critical tool for data-driven research, advanced analytics, and AI-driven modeling. With its expanding integration into cloud ecosystems and AI frameworks, R is adapting to the new era of hybrid and large-scale data environments. The continued development of advanced libraries for deep learning and automated machine learning (AutoML) enhances its competitiveness in modern analytics.
R’s long-standing academic foundation, combined with its open-source adaptability and high-level analytical capabilities, ensures that it remains not only relevant but essential to the data analysis and data science ecosystem in 2025 and beyond.
10. Python

Python stands as one of the most influential and indispensable data analysis tools in 2025, recognized for its unparalleled versatility, open-source framework, and extensive ecosystem of analytical and machine learning libraries. As data-driven decision-making continues to shape modern enterprises, Python has solidified its position as the top programming language for data analytics across industries such as finance, technology, healthcare, and research.
Overview of Python in Data Analytics
Python’s dominance in data analytics arises from its simplicity, scalability, and integration capacity with other systems and tools. Its extensive library support empowers data professionals to conduct a wide spectrum of analytical tasks — from data preprocessing and transformation to advanced statistical modeling and predictive analytics. With a user-friendly syntax and massive global developer community, Python is an essential skill for data analysts, data scientists, and AI practitioners.
Core Functionalities and Ecosystem
Python’s power lies in its comprehensive ecosystem of libraries and frameworks specifically tailored for analytical operations:
- Pandas – Ideal for structured data manipulation, offering robust tools for handling large dataframes efficiently.
- NumPy – Provides high-performance mathematical and matrix computation capabilities.
- SciPy – Enables advanced scientific and numerical computations for research-based analytics.
- Scikit-learn – Streamlines machine learning workflows with algorithms for classification, regression, clustering, and dimensionality reduction.
- Matplotlib, Seaborn, and Plotly – Facilitate sophisticated data visualization for reporting and dashboard creation.
This ecosystem allows analysts to design end-to-end data workflows that include data cleaning, transformation, feature engineering, and predictive modeling within a single programming environment.
Python’s Market Influence and Industry Adoption
Python’s industry-wide presence remains unmatched. In 2025, it is featured in approximately 33% of data analytics job listings globally, underscoring its professional relevance. Moreover, its widespread adoption in academic research and corporate analytics demonstrates its flexibility in handling diverse data environments—from small-scale academic datasets to enterprise-level data pipelines.
Table: Comparative Matrix of Python in Data Analytics
| Feature Category | Python Strengths | Industry Impact | Scalability Level | Cost Efficiency |
|---|---|---|---|---|
| Data Manipulation | Pandas, NumPy | High – Widely used in structured data tasks | High | Excellent (Free) |
| Machine Learning & AI | Scikit-learn, TensorFlow, PyTorch | High – Backbone for AI-driven analytics | Very High | Free/Open Source |
| Visualization & Reporting | Matplotlib, Seaborn, Plotly | Strong – Supports data storytelling | Moderate to High | Free/Open Source |
| Integration & Automation | APIs, SQL, Cloud tools | High – Integrates with major ecosystems | Very High | Free/Open Source |
| Performance on Big Data | PySpark, Dask integration | Moderate – Scalable with extensions | High | Free/Open Source |
Advantages of Python in Modern Analytics
- Accessibility and Ease of Learning – Python’s readable syntax lowers entry barriers for beginners while supporting advanced programming for experts.
- Comprehensive Ecosystem – Thousands of open-source libraries make it suitable for nearly any analytical or scientific task.
- Community and Support – A vast global community ensures continuous updates, innovations, and troubleshooting support.
- Cross-Domain Compatibility – Python integrates seamlessly with web frameworks, cloud platforms, and big data technologies.
- Free and Open-Source – Its cost-effectiveness makes it ideal for both startups and large-scale enterprises.
Potential Limitations
While Python’s capabilities are broad, it may encounter performance limitations with extremely large-scale datasets requiring real-time computation. In such cases, specialized systems such as Apache Spark or Julia may deliver faster processing times. However, Python’s adaptability often allows it to integrate with these systems, mitigating this limitation.
Chart: Python Adoption Growth in Data Analytics (2020–2025)
| Year | Global Adoption Rate (%) | Data Analyst Job Mentions (%) |
|---|---|---|
| 2020 | 22 | 18 |
| 2021 | 25 | 20 |
| 2022 | 27 | 24 |
| 2023 | 30 | 28 |
| 2024 | 32 | 31 |
| 2025 | 35 | 33 |
Conclusion
Python remains the cornerstone of modern data analysis in 2025, offering unmatched versatility, a mature library ecosystem, and broad community support. Its adaptability across domains, from AI-driven automation to visualization and predictive modeling, secures its status as one of the top 10 data analysis software of the year. For professionals and organizations aiming to harness the full potential of their data, Python continues to represent the ideal combination of accessibility, power, and scalability.
The Evolving Landscape of Data Analysis in 2025
The modern business landscape in 2025 is defined by an unprecedented surge in data generation across all industries, from finance and healthcare to manufacturing and digital commerce. With organizations accumulating terabytes of information daily, the capacity to interpret this data effectively has evolved from a competitive edge into a strategic necessity. Data analysis software now serves as the backbone of intelligent decision-making, enabling enterprises to extract patterns, forecast trends, and drive innovation through evidence-based insights.
The Significance of Data Analysis in 2025
In today’s dynamic and highly digitized economy, the demand for advanced data analysis tools has reached its highest level yet. These platforms are no longer limited to statistical computations—they now encompass machine learning, predictive analytics, real-time reporting, and automated visualization. The evolution of data analysis software in 2025 reflects the convergence of artificial intelligence, cloud computing, and user-centric design, making data-driven intelligence accessible to professionals across various technical backgrounds.
Criteria for Evaluation of Top Data Analysis Software
The following report identifies the top 10 most influential data analysis software in 2025, selected through a rigorous evaluation based on:
- Market Share and Growth Potential – Consideration of software adoption rates, industry penetration, and expansion trajectory.
- User Sentiment and Community Engagement – Analysis of user reviews, satisfaction scores, and support community strength.
- Innovation and Feature Differentiation – Assessment of AI integration, automation capabilities, and interoperability with other data ecosystems.
- Industry Recognition and Analyst Ratings – Evaluation of credibility and endorsements from leading market research entities.
These parameters ensure that each selected tool exemplifies excellence in performance, reliability, and future readiness.
Key Trends Defining the Data Analysis Landscape in 2025
The data analytics sector in 2025 is characterized by transformative trends that redefine how organizations extract and operationalize insights:
- AI-Driven Automation – Modern data analysis software integrates machine learning models that automatically clean, classify, and predict data outcomes.
- Cloud-Native Deployments – Cloud-based platforms offer enhanced scalability, security, and collaboration, enabling global data accessibility.
- Self-Service Analytics – Empowering non-technical professionals to build dashboards and reports without relying heavily on IT departments.
- Real-Time Data Processing – Increasing adoption of streaming analytics for industries requiring instantaneous insights, such as fintech and logistics.
- Data Governance and Security – A heightened emphasis on compliance, privacy frameworks, and transparent data handling processes.
Table: Core Trends in Data Analysis Software (2023–2025)
| Trend Category | 2023 Adoption Rate (%) | 2024 Adoption Rate (%) | 2025 Projected Adoption Rate (%) | Impact Level |
|---|---|---|---|---|
| AI and Machine Learning | 60 | 73 | 87 | Very High |
| Cloud-Based Analytics | 55 | 70 | 85 | Very High |
| Self-Service Tools | 48 | 60 | 75 | High |
| Real-Time Processing | 42 | 55 | 70 | High |
| Data Governance Solutions | 50 | 62 | 78 | Moderate to High |
Market Overview and Economic Outlook
The global data analysis software market in 2025 is projected to surpass USD 180 billion, reflecting sustained double-digit growth driven by the acceleration of digital transformation initiatives and the proliferation of IoT-generated data. Enterprises are prioritizing solutions that integrate seamlessly across hybrid infrastructures while ensuring scalability for rapidly expanding datasets.
Chart: Data Analysis Software Market Growth Forecast (2020–2025)
| Year | Market Size (USD Billion) | Annual Growth Rate (%) |
|---|---|---|
| 2020 | 82 | 8.4 |
| 2021 | 98 | 9.2 |
| 2022 | 117 | 10.1 |
| 2023 | 138 | 12.4 |
| 2024 | 160 | 13.9 |
| 2025 | 183 | 14.6 |
Analytical Framework of the Report
This comprehensive report provides a comparative assessment of the ten most impactful data analysis tools in 2025. Each software is analyzed through the following dimensions:
- Core Functionalities and Technical Capabilities
- Usability, Learning Curve, and Integration Flexibility
- Market Penetration and Industry Adoption Trends
- User Feedback and Real-World Application Case Studies
- Pricing Models and Licensing Options
Comparative Matrix: Key Evaluation Dimensions for Top Data Analysis Software (2025)
| Evaluation Criteria | Weightage (%) | Impact on Ranking |
|---|---|---|
| Market Share & Growth | 25 | High |
| Innovation & AI Integration | 20 | High |
| User Experience & Interface | 15 | Moderate to High |
| Community Support & Reviews | 15 | Moderate |
| Cost Efficiency | 10 | Moderate |
| Scalability & Security | 15 | High |
Conclusion
As the global economy becomes increasingly data-driven, businesses in 2025 are investing heavily in analytics platforms that combine intelligence, automation, and adaptability. The tools featured in this report not only empower data scientists and analysts but also democratize analytics across all levels of an organization. From predictive modeling and visualization to AI-assisted data preparation, these platforms represent the pinnacle of innovation in data analytics. The future of business success will continue to rely on how effectively organizations adopt and utilize these top-performing data analysis software solutions.
Comparative Table of Top 11 Data Analysis Software in 2025
The data analytics ecosystem in 2025 is marked by a vast array of tools that empower organizations to derive actionable insights from complex datasets. Each software platform offers distinctive strengths—ranging from advanced statistical modeling and AI-powered insights to seamless visualization and cloud-based scalability. This comparative analysis provides a structured and data-driven overview of the leading software solutions shaping the data analytics landscape in 2025.
Overview of Evaluation Criteria
To identify the top-performing data analysis software, the evaluation focuses on multiple dimensions, including:
- Feature Breadth and Depth: Assessing the range and sophistication of analytical and visualization functions.
- Pricing Models: Evaluating cost-effectiveness, subscription flexibility, and licensing structures.
- Ease of Use: Measuring user accessibility for beginners, intermediates, and advanced professionals.
- Visualization and Statistical Analysis Capabilities: Gauging the strength of data representation and modeling functions.
- Scalability: Determining how efficiently each software handles increasing data volumes and enterprise growth.
- Market Penetration and User Ratings: Analyzing adoption rates, satisfaction levels, and long-term reliability.
Comparative Matrix: Leading Data Analysis Software in 2025
| Software Name | Key Features | Pricing Model | Ease of Use | Visualization Capabilities | Statistical Analysis | Scalability | Estimated Market Share | Average User Rating |
|---|---|---|---|---|---|---|---|---|
| Microsoft Power BI | Business Intelligence, Real-Time Dashboards, MS Integration | Subscription (Per User) | Intermediate | Excellent | Good | High | 17% – 36% | 4.5 / 5 |
| Tableau | Data Visualization, Dashboards, Predictive Analytics | Subscription (Per User) | Intermediate | Excellent | Good | High | 12% – 17% | 4.4 / 5 |
| Qlik Sense | Self-Service BI, Associative Data Exploration, Cloud Support | Subscription (Per User) | Intermediate | Excellent | Good | High | ~2% | 4.5 / 5 |
| Looker (Google Looker Studio) | Cloud-Based BI, Data Modeling Language, AI-Driven Insights | Customized Pricing | Advanced | Excellent | Good | High | ~1.6% | 4.3 / 5 |
| Domo | End-to-End Analytics Platform, AI-Powered Dashboards | Subscription (Upon Request) | Beginner | Excellent | Basic | High | N/A | 4.5 / 5 |
| QlikView | In-Memory Associative Technology, Traditional BI Framework | Part of Qlik Offering | Intermediate | Good | Good | Medium | N/A | N/A |
| SAS Analytics | Advanced Statistical Modeling, Predictive Analytics | Proprietary Licensing | Advanced | Good | Excellent | High | Significant | N/A |
| KNIME Analytics Platform | Open-Source, Visual Workflows, Data Mining, ML Integration | Free/Open-Source or Commercial | Intermediate | Good | Good | High | ~11% (Data Science Platforms) | 4.4 / 5 |
| R Programming | Statistical Computing, Visualization, Machine Learning | Open-Source | Advanced | Excellent | Excellent | Medium | Significant | N/A |
| Python | General-Purpose Analytics, Libraries for ML and Visualization | Open-Source | Beginner/Intermediate | Good | Good | High | Dominant | N/A |
| SQL | Database Querying, Data Management, Integration Support | Varies by System | Beginner | Basic | Basic | High | Foundational | N/A |
Interpretation of the Comparative Matrix
- Microsoft Power BI and Tableau dominate the market due to their enterprise-grade integrations, real-time capabilities, and user-friendly dashboards.
- Python and R remain the most powerful for statistical computing and machine learning, serving as the backbone for academic and research-based analytics.
- SAS Analytics continues to hold a strong position in regulated sectors due to its proven reliability in statistical modeling.
- KNIME offers exceptional flexibility through open-source customization, making it popular among startups and academic institutions.
- Looker and Qlik Sense lead the innovation front with cloud-native architectures and AI-assisted exploration capabilities.
Visualization of Market Distribution: Top Data Analysis Tools (2025)
| Rank | Software Name | Market Share (%) | Category Leadership |
|---|---|---|---|
| 1 | Microsoft Power BI | 17–36 | Business Intelligence Leader |
| 2 | Tableau | 12–17 | Data Visualization Leader |
| 3 | Python | Dominant | Programming and Analytics |
| 4 | KNIME Analytics | ~11 | Open-Source Analytics Platform |
| 5 | SAS Analytics | Significant | Statistical Analysis Expert |
| 6 | R Programming | Significant | Statistical Computing Specialist |
| 7 | Qlik Sense | ~2 | Self-Service Analytics Pioneer |
| 8 | Looker | ~1.6 | Cloud-Based BI Innovator |
| 9 | Domo | N/A | AI-Driven Analytics Platform |
| 10 | SQL | Foundational | Database Query and Management |
Chart: Market Share Distribution (2025)
| Software | Market Influence Index (0–100) |
|---|---|
| Microsoft Power BI | 95 |
| Tableau | 92 |
| Python | 90 |
| KNIME | 78 |
| SAS Analytics | 74 |
| R Programming | 72 |
| Qlik Sense | 60 |
| Looker | 58 |
| Domo | 55 |
| SQL | 50 |
Conclusion
The comparative landscape of data analysis software in 2025 reflects a convergence of innovation, accessibility, and performance. Power BI, Tableau, and Python dominate due to their versatility and scalability, while KNIME and R maintain strong followings within open-source and academic communities. SAS Analytics continues to be indispensable for institutions demanding precision and regulatory compliance. As organizations continue their digital evolution, the best data analysis software will be those that seamlessly integrate automation, visualization, and intelligence—transforming raw data into actionable business strategy.
Emerging Trends in Data Analysis Software
The data analysis software market in 2025 is undergoing a transformative shift, driven by rapid advancements in artificial intelligence, cloud computing, automation, and data democratization. Organizations are increasingly relying on intelligent analytics platforms to turn massive datasets into actionable intelligence, enabling faster and more precise decision-making. This evolution reflects not only technological progress but also a strategic response to the global demand for agility, transparency, and data-driven innovation.
Integration of Artificial Intelligence and Machine Learning
Artificial intelligence (AI) and machine learning (ML) are redefining how analytics platforms operate. These technologies are now embedded in nearly every leading software, enabling automation of complex analytical tasks and predictive modeling.
- Automated Insights: AI-driven systems automatically identify trends, anomalies, and correlations, reducing manual analysis time by over 40%.
- Natural Language Processing (NLP): Users can interact with data conversationally, asking questions in natural language to retrieve visual or numerical insights.
- Predictive and Prescriptive Analytics: Advanced ML models assist businesses in forecasting outcomes and recommending optimal strategies based on historical and live data.
The AI integration trend enhances both the depth and speed of data analysis, empowering non-technical users to engage with data meaningfully while allowing experts to focus on higher-value analytical tasks.
Transition Toward Cloud-Based Analytics Ecosystems
Cloud-based deployment continues to dominate the analytics industry as organizations embrace flexible, scalable, and collaborative environments.
- Scalability and Cost Efficiency: Cloud infrastructure allows enterprises to expand analytics operations without heavy investment in physical servers.
- Global Accessibility: Teams can collaborate from any location, facilitating cross-departmental data sharing and real-time updates.
- Hybrid Integration: Many solutions now support hybrid models—combining on-premises and cloud functionalities for regulatory compliance and performance optimization.
A comparative market insight suggests that over 70% of enterprise analytics workloads in 2025 are cloud-based, reflecting an irreversible shift from traditional on-premise systems.
Rise of Self-Service and Democratized Analytics
The demand for self-service analytics is revolutionizing corporate data culture. Organizations are increasingly favoring tools that empower employees at all levels to independently explore and visualize data.
- Intuitive Interfaces: Drag-and-drop design, guided analysis, and low-code tools allow non-technical users to perform advanced data tasks.
- Reduced IT Dependency: Self-service capabilities decrease reliance on centralized data teams, accelerating insight generation across departments.
- Data Democratization: Every department—from finance to marketing—can now participate in analytical decision-making, fostering a culture of data literacy.
This movement supports the broader vision of transforming analytics from a specialized function into an organization-wide competency.
Expansion of Real-Time and Streaming Data Analysis
In 2025, organizations cannot afford delays in analytics. The ability to process and interpret live data streams has become essential for sectors such as e-commerce, finance, and logistics.
- Real-Time Dashboards: Tools now deliver up-to-the-minute metrics, enabling immediate responses to operational changes.
- IoT and Sensor Data Integration: The growing Internet of Things (IoT) ecosystem fuels demand for software that can handle high-velocity, unstructured data.
- Instant Decision-Making: Businesses benefit from immediate alerts, anomaly detection, and automated adjustments to strategies based on current insights.
The integration of real-time analytics capabilities is turning data platforms into intelligent, adaptive systems capable of supporting continuous improvement and innovation.
Enhanced Data Governance, Security, and Compliance
As data volume expands exponentially, ensuring integrity, privacy, and compliance has become a strategic imperative.
- Governance Frameworks: Modern tools embed governance modules to monitor data lineage, enforce access controls, and maintain accuracy.
- Regulatory Compliance: Analytics software now includes built-in compliance with GDPR, HIPAA, and industry-specific regulations.
- Data Encryption and Risk Management: Multi-layer encryption and secure APIs protect sensitive information throughout the analytical process.
A strong focus on governance not only ensures compliance but also reinforces trust in analytics as a reliable foundation for enterprise decision-making.
Integration with Collaboration and Productivity Platforms
Collaboration is emerging as a central pillar of analytics adoption. The ability to share dashboards, reports, and insights seamlessly across platforms improves team alignment and operational efficiency.
- Cross-Platform Compatibility: Leading analytics tools now integrate with productivity suites such as Microsoft Teams, Slack, and Google Workspace.
- Shared Data Workspaces: Teams can co-author reports and update dashboards in real time.
- Decision Transparency: Collaborative analytics promote shared accountability and more informed, consensus-driven strategies.
Matrix: Key Emerging Trends in 2025 Data Analysis Software
| Trend Area | Key Drivers | Impact on Organizations | Adoption Level (2025) |
|---|---|---|---|
| AI and Machine Learning | Automation, Predictive Insights | Faster, smarter decision-making | Very High |
| Cloud Analytics | Scalability, Flexibility | Cost efficiency and global collaboration | High |
| Self-Service Analytics | User Empowerment | Broader data literacy and faster insights | Very High |
| Real-Time Analytics | IoT, Dynamic Markets | Immediate response to operational shifts | High |
| Data Governance & Security | Regulatory Demands | Stronger compliance and trust | High |
| Collaboration & Integration | Team-Based Analytics | Enhanced workflow efficiency | Medium to High |
Conclusion
The emerging trends in 2025 collectively mark a new phase in the evolution of data analytics—one that emphasizes intelligence, agility, and accessibility. The convergence of AI, cloud computing, and self-service functionalities ensures that data analysis is no longer the domain of specialists alone but a capability embedded across all organizational levels. As the software ecosystem matures, future leaders in the analytics industry will be defined not just by their computational power, but by how effectively they blend automation, usability, and security to turn complex data into strategic insight.
Recommendations
The global data analysis software market in 2025 is characterized by an exceptional diversity of solutions designed to address a wide array of analytical needs, from enterprise-level intelligence to specialized statistical modeling. Each platform delivers distinct advantages, and selecting the right one depends on an organization’s analytical maturity, budgetary capacity, and data infrastructure.
Microsoft Power BI and Tableau have emerged as dominant forces in the business intelligence and data visualization segment. Both platforms excel in creating interactive dashboards, intuitive visual reports, and seamless data integration. Power BI stands out for its strong synergy with the Microsoft ecosystem, making it a natural choice for enterprises leveraging Microsoft 365 or Azure. Tableau, meanwhile, continues to set the industry benchmark for advanced visualization, allowing organizations to interpret complex datasets through immersive and dynamic visual storytelling. However, both platforms may pose scalability challenges in terms of cost when deployed across large user bases.
Qlik Sense distinguishes itself with its associative data engine, enabling users to uncover hidden relationships across datasets in a highly interactive manner. Looker (Google Looker Studio) has gained traction within cloud-driven organizations, particularly those using Google Cloud, due to its robust modeling capabilities, semantic data layers, and deep integration with other Google services. Domo represents an all-in-one cloud-based analytics environment that integrates AI-driven insights, collaborative tools, and customizable dashboards, offering exceptional usability for non-technical users.
Traditional yet powerful tools like SAS Analytics retain a vital role for enterprises requiring advanced statistical analysis, risk modeling, and regulatory compliance. Although it carries a premium price point, SAS remains indispensable for sectors such as finance, healthcare, and government. In contrast, open-source platforms such as KNIME, R, and Python continue to democratize analytics through flexibility, community-driven development, and cost efficiency. KNIME’s visual workflow interface supports end-to-end machine learning and data mining, while R and Python empower data professionals with unmatched versatility in statistical computing, predictive analytics, and automation. SQL, though not a standalone analysis platform, remains foundational, underpinning data manipulation and retrieval in nearly all analytical systems.
The following matrix summarizes the strengths, user focus, and strategic alignment of key data analysis software tools in 2025:
Data Analysis Software Matrix (2025)
| Software | Primary Use Case | Skill Level | Key Strength | Ideal User Group | Integration Ecosystem | Scalability |
|---|---|---|---|---|---|---|
| Microsoft Power BI | Business Intelligence, Visualization | Intermediate | Seamless Microsoft Integration | Corporate Analysts, Business Users | Microsoft 365, Azure | High |
| Tableau | Data Visualization, Dashboarding | Intermediate | Advanced Visualization | Data Analysts, Visual Designers | Multi-cloud, On-premise | High |
| Qlik Sense | Self-Service Analytics | Intermediate | Associative Data Engine | Exploratory Analysts | Hybrid Cloud | High |
| Looker (Google Looker Studio) | Cloud BI and Modeling | Advanced | Cloud-native Modeling | Data Engineers, Analysts | Google Cloud | High |
| Domo | Collaborative BI Platform | Beginner to Intermediate | Integrated Cloud Solution | Cross-functional Teams | SaaS Ecosystem | Medium to High |
| SAS Analytics | Advanced Statistical Modeling | Advanced | Regulatory-grade Analytics | Financial, Healthcare Enterprises | On-premise/Hybrid | High |
| KNIME | Open-source Analytics | Intermediate | Visual Data Workflows | Data Scientists, Researchers | Open Source | High |
| R Programming | Statistical Computing | Advanced | Extensive Libraries | Statisticians, Data Scientists | Open Source | Medium |
| Python | Data Science and Automation | Intermediate | AI & ML Capabilities | Developers, Data Scientists | Open Source | High |
| SQL | Data Query and Management | Beginner | Universal Data Access | Analysts, Database Administrators | All Systems | High |
For organizations aiming for user accessibility and strong system integration, Microsoft Power BI remains a leading choice. Tableau is recommended for businesses emphasizing rich visual storytelling and rapid insight generation. Companies seeking exploratory and interactive data discovery should consider Qlik Sense, while enterprises operating within the Google Cloud ecosystem may find Looker particularly advantageous. Domo caters well to collaborative teams seeking a single, unified environment for analytics and decision-making. SAS Analytics continues to dominate industries that demand precision and compliance-driven reporting. KNIME offers an open, modular approach to data science, while R and Python remain indispensable tools for advanced computation and predictive modeling.
Ultimately, the decision-making process should weigh critical factors such as usability, deployment flexibility, scalability, and integration with existing systems. As 2025 progresses, the data analysis landscape will be further defined by advancements in artificial intelligence, cloud-native architectures, and automation technologies that enhance speed, accessibility, and insight generation across all levels of enterprise data ecosystems.
Conclusion
The evolution of data analysis software in 2025 signifies a transformative era in how organizations harness, interpret, and act upon data to drive growth and innovation. As global industries continue to operate in data-driven environments, the demand for powerful, intuitive, and scalable analytical solutions has never been more crucial. The top data analysis tools of 2025 demonstrate how technology has matured to serve diverse user needs—ranging from enterprise-level analytics and real-time intelligence to open-source flexibility and machine learning automation.
Microsoft Power BI and Tableau maintain their dominance in the business intelligence space, offering sophisticated visualization capabilities, deep integration features, and ease of use that appeal to businesses of all sizes. Qlik Sense, with its associative data model, continues to empower users to explore data interactively and uncover insights that traditional linear analysis often overlooks. Meanwhile, Looker (Google Looker Studio) and Domo redefine the cloud analytics ecosystem by merging scalability, collaboration, and AI-driven insights into streamlined platforms that fit modern, decentralized work environments.
Traditional analytics powerhouses like SAS Analytics still hold a critical role, particularly in sectors such as finance, healthcare, and government, where precision, compliance, and advanced modeling are paramount. Conversely, open-source platforms like KNIME, R, and Python are fueling innovation by democratizing access to advanced analytics. Their flexibility, community support, and ability to integrate with AI and machine learning frameworks make them indispensable for data scientists and technical professionals. SQL remains the backbone of structured data management, reinforcing its timeless importance across virtually every analytical workflow.
As the market matures, several overarching trends continue to shape the trajectory of data analysis software. Artificial intelligence and machine learning are now embedded into nearly every major analytics solution, automating complex processes and enabling predictive insights that go beyond descriptive reporting. The shift toward cloud-based deployment has also redefined accessibility, allowing teams to collaborate seamlessly and make decisions in real time from any location. Additionally, the growing emphasis on self-service analytics is empowering non-technical professionals to derive insights independently, reducing dependency on IT teams and accelerating data-driven decision-making across organizations.
Another critical trend influencing the data analysis software market in 2025 is the rise of data governance and privacy frameworks. As data volumes expand exponentially, ensuring security, compliance, and ethical data use has become a central focus for both enterprises and software vendors. Modern platforms are now embedding stronger governance mechanisms, access controls, and encryption technologies to protect sensitive data while maintaining analytical agility.
In the coming years, data analysis will continue to evolve into an even more intelligent, automated, and accessible discipline. The integration of natural language processing, AI copilots, and predictive analytics will redefine how businesses approach data exploration and decision-making. The next generation of data analysis software will not only simplify data interpretation but also proactively recommend actions, simulate outcomes, and optimize performance in real time.
In conclusion, selecting the right data analysis software in 2025 depends on a company’s strategic goals, data complexity, team skill set, and technology ecosystem. Enterprises seeking all-in-one BI platforms will find immense value in solutions like Microsoft Power BI, Tableau, and Domo. Those pursuing open-source flexibility and deeper control over their data science workflows may gravitate toward Python, R, or KNIME. Industries requiring regulatory precision and robust statistical modeling will continue to rely on SAS Analytics.
The overarching insight from this year’s analysis is clear: the future of data analysis lies in integration, intelligence, and inclusivity. The most successful organizations will be those that combine advanced analytical capabilities with ease of use, automation, and secure collaboration. By strategically adopting the right tools, businesses can transform raw data into a catalyst for innovation, efficiency, and sustained competitive advantage in the digital economy.
If you find this article useful, why not share it with your hiring manager and C-level suite friends and also leave a nice comment below?
We, at the 9cv9 Research Team, strive to bring the latest and most meaningful data, guides, and statistics to your doorstep.
To get access to top-quality guides, click over to 9cv9 Blog.
To hire top talents using our modern AI-powered recruitment agency, find out more at 9cv9 Modern AI-Powered Recruitment Agency.
People Also Ask
What is data analysis software?
Data analysis software helps users collect, clean, visualize, and interpret large datasets to identify patterns, trends, and actionable insights.
Why is data analysis software important in 2025?
In 2025, data analysis software is vital for transforming raw data into business intelligence, improving decision-making, and maintaining competitive advantage.
Which is the best data analysis software in 2025?
Top contenders include Power BI, Tableau, Qlik Sense, KNIME, Python, and SAS Analytics, each offering advanced analytics and visualization capabilities.
What are the main features of top data analysis tools?
Core features include AI integration, data visualization, real-time analytics, predictive modeling, and compatibility with cloud platforms.
Is Power BI still popular in 2025?
Yes, Power BI remains one of the most widely used tools for business intelligence and data visualization due to its seamless integration with Microsoft products.
How does Tableau compare to Power BI?
Tableau excels in visual storytelling and advanced graphics, while Power BI offers stronger integration within the Microsoft ecosystem.
Is Qlik Sense suitable for beginners?
Yes, Qlik Sense’s associative engine allows intuitive data exploration, making it accessible for both beginners and advanced analysts.
What makes KNIME unique among open-source data tools?
KNIME offers a visual workflow interface and extensive node library, making it powerful for machine learning and data mining tasks.
Is Python good for data analysis in 2025?
Yes, Python continues to dominate due to its extensive libraries like Pandas, NumPy, and Scikit-learn for data manipulation and analysis.
Why do analysts use R programming for data analysis?
R is favored for statistical computing, data visualization, and specialized libraries that cater to academic and scientific research.
How does SAS Analytics differ from open-source tools?
SAS provides robust enterprise-level statistical modeling but is proprietary and more expensive than open-source platforms like Python or KNIME.
What is the role of SQL in data analysis?
SQL remains essential for querying, managing, and manipulating data stored in relational databases, forming the foundation of most analytics workflows.
Are cloud-based data analysis tools better?
Cloud tools provide scalability, remote access, real-time collaboration, and seamless integration with other cloud-based applications.
How is AI changing data analysis software in 2025?
AI automates insights, improves predictive accuracy, and allows natural language querying, making data analysis more efficient and accessible.
What industries benefit most from data analysis software?
Key sectors include finance, healthcare, marketing, e-commerce, and manufacturing, all leveraging data for optimization and forecasting.
What is self-service analytics?
Self-service analytics enables non-technical users to perform their own analysis and create visual reports without heavy IT involvement.
Which data analysis software offers the best visualization tools?
Tableau, Power BI, and Looker are recognized for their strong visualization capabilities and interactive dashboards.
Is KNIME suitable for enterprise use?
Yes, KNIME offers commercial extensions and enterprise-grade support through KNIME Business Hub, ideal for large organizations.
How does Looker integrate with Google Cloud?
Looker seamlessly connects with Google Cloud services, providing real-time analytics, scalable data modeling, and powerful integrations.
What are the pricing models for top data analysis tools?
Most tools follow subscription-based pricing, while open-source platforms like Python and R are free to use.
Are there free data analysis software options in 2025?
Yes, open-source tools such as KNIME, R, and Python offer professional-grade analytics capabilities at no cost.
Which tool is best for small businesses?
Power BI and KNIME are ideal for small businesses due to their affordability, scalability, and user-friendly interfaces.
Which software is best for machine learning tasks?
Python, KNIME, and SAS Analytics are top choices for machine learning applications due to their extensive algorithm libraries.
How do I choose the right data analysis software?
Consider your organization’s size, data complexity, budget, integration needs, and team expertise before selecting a platform.
Can data analysis tools handle real-time data?
Yes, modern tools like Tableau, Domo, and Qlik Sense provide real-time data processing for faster decision-making.
Is it necessary to know coding for data analysis in 2025?
Not always. Many tools like Power BI and Tableau offer no-code or low-code options, while Python and R require programming knowledge.
What is the future of data analysis software?
The future includes greater AI integration, automation, real-time analytics, and more intuitive self-service solutions.
Which software supports big data analytics?
Tools such as Qlik Sense, SAS Analytics, and Python integrate with big data ecosystems like Hadoop and Spark for large-scale processing.
How does data analysis improve business performance?
By uncovering patterns and predicting trends, data analysis enhances strategic planning, efficiency, and customer engagement.
Will demand for data analysts increase in 2025?
Yes, with the rise of digital transformation, the demand for skilled data analysts and robust analytics software continues to grow.
Sources
Domo
YouTube
ThoughtSpot
Estuary
The Business Research Company
DataCamp
6sense
TTMS
CTO Magazine
Research
Codebasics
Super AI
Microsoft Power BI
Blog de Bismart
Indicium
Synapx
G2
TrustRadius
Databox
Electro IQ
BARC
M2
Explo
SoftwareReviews
DataBrain
Data Science Society
Gartner
Holistics
InfoTech
PeerSpot
Economize Cloud
The CMO
The CFO Club
Simplilearn
Quora
Marlabs
My Engineering Buddy
GlobeNewswire
SAS
CareerFoundry
SiliconAngle
KNIME
365 Data Science
Amazon
GeeksforGeeks
Reflex
Coursera
Goodreads
LearnDataSci
LLCBuddy
Microsoft
The CTO Club
SourceForge
Forrester
Market Research Future
Computools
Ataccama

")


