


")


")


Key Takeaways
- Salaries in Australia for 2026 are stabilising at 3.0%–3.25% annual growth, with the highest pay concentrated in mining, medical specialties, technology, and senior corporate leadership roles.
- Industry, experience, qualifications, and geographic location remain the strongest drivers of earning potential, with ACT and Western Australia leading national average weekly earnings.
- Total remuneration strategies, including flexible work, salary packaging, superannuation increases, and performance incentives, are now critical factors shaping take-home pay and employee retention in 2026.
Understanding salaries in Australia for 2026 requires more than a quick glance at average wage figures. The Australian labour market has entered a new phase of economic adjustment, where wage growth is stabilising, industry demand is shifting, and cost-of-living pressures are reshaping how professionals evaluate income. After a period of rapid post-pandemic salary acceleration between 2022 and 2024, the market has transitioned into a more measured and skills-driven environment. For employees, employers, investors, and policy observers, 2026 represents a year of recalibration rather than contraction.

Wage growth across Australia is now settling into a sustainable range, generally forecast between 3.0 percent and 3.25 percent annually. This moderation signals the end of broad, aggressive pay rises seen during labour shortages, but it does not indicate stagnation. Instead, salary increases are becoming more targeted and aligned with productivity, strategic value, and technical expertise. In practical terms, high-income growth remains strong in certain sectors, while more routine roles experience slower progression.
A complete guide to salaries in Australia for 2026 must examine the full landscape: national averages and median earnings, minimum wage adjustments, superannuation changes, industry-specific salary benchmarks, graduate entry points, executive compensation, regional income variations, and the growing importance of salary packaging and benefits. Salary is no longer defined by base pay alone. Flexible work arrangements, performance incentives, tax-effective packaging, and location-based allowances are increasingly central to real income outcomes.
Industry remains the most powerful driver of earning potential. Mining and resources continue to dominate weekly earnings, supported by strong export demand and capital-intensive operations. Medical specialists sit at the top of the income distribution, reflecting extended training requirements and workforce scarcity. Technology and artificial intelligence roles are commanding premium pay as organisations accelerate digital transformation. Finance, corporate leadership, and senior strategy roles also remain among the highest compensated positions in the country.
At the same time, service-oriented sectors such as retail, hospitality, and certain care-based roles operate within tighter margin environments. While these industries employ large portions of the workforce, their wage structures are more closely aligned with award systems and minimum wage adjustments. This divergence creates a two-speed salary market, where earnings growth is strongest in specialised, high-skill domains.
Geographic location further shapes salary outcomes. The Australian Capital Territory, Western Australia, and the Northern Territory lead in average weekly earnings due to public administration, defence, and resource concentration. Sydney remains the centre of corporate and financial leadership salaries, though housing affordability pressures are reshaping perceptions of disposable income. Regional centres are gaining attention as viable alternatives for professionals seeking stronger real purchasing power combined with remote or hybrid work opportunities.
Experience and qualifications also play a defining role in 2026 income trajectories. Senior professionals in technical and managerial roles often earn significantly more than early-career counterparts. Advanced degrees, professional certifications, and leadership capability can accelerate progression into higher salary brackets. The growing integration of artificial intelligence across industries is further elevating demand for specialised STEM expertise combined with strong human-centred leadership skills.
Regulatory settings provide an essential backdrop to this salary environment. The national minimum wage increase, the rise of the Superannuation Guarantee to 12 percent, and adjustments to income thresholds shape the legal framework within which salaries operate. These policies influence both employee take-home pay and employer cost structures, reinforcing the importance of total remuneration planning.
This guide explores every major dimension of the Australian salary landscape in 2026. It analyses average and median income data, examines industry-specific benchmarks, outlines the highest paying careers, reviews graduate salary trends, compares regional and metropolitan earnings, and explains how benefits and packaging strategies can influence net income. It also evaluates the broader economic forces driving wage stability, including productivity trends, inflation pressures, and labour market participation rates.
For professionals, this guide provides clarity on where the strongest income opportunities lie and what skills are most valuable in a cooling yet competitive market. For employers, it offers insight into how to structure competitive compensation frameworks while maintaining financial sustainability. For policymakers and workforce planners, it highlights structural trends that will shape the Australian labour market throughout the remainder of the decade.
Salaries in Australia for 2026 are no longer defined by volatility, but by strategic alignment. The key question is no longer how fast wages are rising, but where and why they are rising. By understanding industry dynamics, geographic factors, seniority progression, and total reward strategies, individuals and organisations can make informed decisions in an evolving economic landscape.
This complete guide provides the data, context, and strategic perspective needed to navigate Australia’s salary environment with confidence in 2026.
Before we venture further into this article, we would like to share who we are and what we do.
About 9cv9
9cv9 is a business tech startup based in Singapore and Asia, with a strong presence all over the world.
With over nine years of startup and business experience, and being highly involved in connecting with thousands of companies and startups, the 9cv9 team has listed some important learning points in this overview of Salaries in Australia for 2026: A Complete Guide.
If your company needs recruitment and headhunting services to hire top-quality employees, you can use 9cv9 headhunting and recruitment services to hire top talents and candidates. Find out more here, or send over an email to [email protected].
Or just post 1 free job posting here at 9cv9 Hiring Portal in under 10 minutes.
Salaries in Australia for 2026: A Complete Guide
- Macroeconomic Foundations of Wage Growth and Inflationary Parity
- National Earning Benchmarks and Demographic Variations
- Structural Analysis of Salaries by Industry Sector
- High-Earning Professional Roles and Medical Specialties
- Regional and Metropolitan Salary Comparisons
- The Impact of Seniority and Experience
- Graduate Salaries and Early Career Entry Points
- The Evolving Benefit Landscape and Salary Packaging
- Regulatory Governance and Minimum Wage Standards
- Navigation of the 2026 Remuneration Frontier
1. Macroeconomic Foundations of Wage Growth and Inflationary Parity
A complete guide to salaries in Australia for 2026 must begin with the broader economic environment influencing pay levels across industries. Salary growth does not occur in isolation. It is shaped by inflation trends, labour market strength, productivity performance, and policy decisions made by economic authorities.
In 2026, Australia’s wage environment reflects a transition from post-pandemic volatility toward a more stable and controlled growth phase. The rapid wage acceleration experienced during 2022 and 2023 has moderated. Employers, employees, and HR leaders are now operating within a climate focused on sustainability rather than aggressive expansion.
Stabilisation of the Wage Price Index and Its Impact on Salary Growth
The Wage Price Index remains the most reliable indicator of underlying wage movements in Australia. Unlike average earnings data, it measures changes in the price of labour while excluding variations caused by workforce composition or hours worked. This makes it a critical benchmark for salary forecasting and compensation planning in 2026.
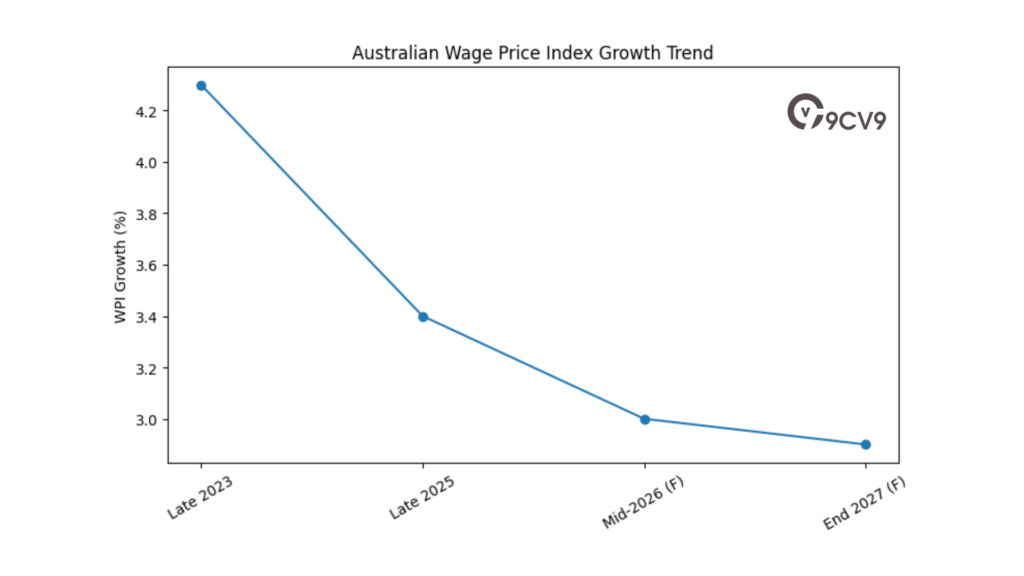
By early 2026, wage growth has stabilised. The Reserve Bank of Australia projects that annual wage growth will settle near 3.0 percent by mid-2026. Looking further ahead, growth is expected to ease slightly to around 2.9 percent by the end of 2027.
This moderation marks a clear shift from the post-pandemic peak of 4.3 percent recorded in late 2023. That earlier period was characterised by labour shortages and strong competition for talent. The 2026 outlook suggests that widespread, high-percentage pay rises are no longer the dominant feature of Australia’s salary market.
Australian Wage Growth Trend Overview
| Period | Wage Price Index Growth | Economic Context | Salary Market Implication |
|---|---|---|---|
| Late 2023 | 4.3% | Post-pandemic labour shortages | Broad-based and aggressive salary increases |
| Late 2025 | 3.4% | Inflation easing, labour demand moderating | Controlled wage adjustments |
| Mid-2026 (Forecast) | 3.0% | Capacity pressures easing | Targeted and strategic salary planning |
| End 2027 (Forecast) | 2.9% | Labour market moving toward balance | Sustainable long-term wage growth environment |
Inflation, Real Wages, and Purchasing Power in 2026
When analysing salaries in Australia for 2026, it is essential to compare wage growth with inflation. Real wages improve only when salary increases exceed the rise in consumer prices.
In late 2025, real wage growth turned positive for the first time in several years. Wage growth of 3.4 percent slightly exceeded Consumer Price Index growth of 3.2 percent. This shift signalled a gradual recovery in purchasing power.
However, many sectors continue to report that real earnings remain below pre-pandemic levels once cumulative inflation is considered. This means that while employees may now see modest improvements, full recovery has not yet been achieved across the entire economy.
Wage Growth vs Inflation Snapshot
| Economic Indicator | Latest Recorded Level | Trend Direction | Implication for Employees |
|---|---|---|---|
| Wage Price Index Growth | 3.4% | Moderating | Stable but lower than peak growth |
| Consumer Price Index Growth | 3.2% | Easing | Inflation pressures gradually reducing |
| Real Wage Position | Slightly Positive | Improving slowly | Limited recovery in purchasing power |
| Inflation Target Midpoint | 2.5% | Policy Benchmark | Central reference for monetary stability |
Comparative Forecasts for Australian Wage Growth 2025–2027
Forecasts from major institutions show a broadly consistent outlook, although some variation exists in the projected pace of wage growth. These differences reflect contrasting assumptions about labour market strength and economic resilience.
Australian Wage Growth Forecast Comparison
| Forecasting Body | Reference Period | Projected Wage Growth (%) | Primary Economic Driver |
|---|---|---|---|
| Reserve Bank of Australia | Mid-2026 | 3.0% | Easing labour market pressures |
| Australian Treasury | FY 2025–2026 | 3.25% | Strong service-sector demand |
| Reserve Bank of Australia | June 2027 | 2.9% | Labour market shifting toward equilibrium |
| OECD | 2026 | 1.8% GDP Growth | Global economic slowdown |
| Ai Group Leaders | 2026 Outlook | Moderate Conditions | Higher energy and input costs |
The Treasury’s slightly higher projection reflects its view that the labour market remains relatively tight by historical standards. Even so, unemployment is expected to rise gradually into the mid-4 percent range, reducing extreme wage pressures while maintaining steady employment conditions.
Labour Market Conditions and Salary Pressure
In 2026, Australia’s labour market is transitioning from tight to balanced. Although unemployment is edging higher, it remains comparatively low. This means salary growth continues, but at a measured pace.
Broad increases across all roles are becoming less common. Instead, pay rises are increasingly directed toward high-demand professions, technical roles, and positions that directly support operational efficiency.
Labour Market Outlook Matrix
| Labour Indicator | 2026 Outlook | Salary Impact |
|---|---|---|
| Unemployment Rate | Mid-4% range | Reduced pressure for large across-the-board increases |
| Hiring Competition | Strong in niche sectors | Higher pay growth in specialised roles |
| General Employment Demand | Stable | Moderate annual salary adjustments |
| Skills Shortages | Targeted industries | Premium compensation in high-skill fields |
Productivity Challenges and Their Influence on Salaries
A key structural issue influencing salaries in Australia for 2026 is the gap between wage growth and productivity performance. Labour productivity declined by 1.2 percent year-on-year in the December quarter of 2024. Economists expect productivity to remain weak through 2025 and into 2026.
When wages rise faster than productivity, unit labour costs increase. This creates pressure on business margins and can contribute to inflation risks. Policymakers remain concerned about maintaining the long-term inflation target midpoint of 2.5 percent.
Wage Growth and Productivity Relationship
| Metric | Current Trend | Economic Consequence | Business Response Strategy |
|---|---|---|---|
| Wage Growth | Moderate | Rising payroll expenses | Careful budgeting and performance-linked increases |
| Labour Productivity | Weak or contracting | Lower output per worker | Investment in automation and skills development |
| Unit Labour Costs | Increasing | Margin pressure and inflation risk | Focus on efficiency-driven roles |
| Inflation Target | 2.5% midpoint | Policy anchor for stability | Cautious compensation planning |
Strategic Implications for Employers and HR Decision-Makers
In 2026, compensation strategies in Australia are increasingly focused on alignment with productivity, technology adoption, and long-term financial sustainability. Businesses are moving away from uniform salary increases and toward differentiated pay models.
High-performing employees and roles that drive digital transformation, operational efficiency, and revenue growth are more likely to receive above-average salary adjustments. Meanwhile, standard roles may see increases closer to the national wage growth average of around 3 percent.
For organisations preparing salary budgets, understanding macroeconomic trends is essential. Wage growth, inflation forecasts, productivity data, and labour market conditions must all be considered when building competitive and sustainable pay structures.
Conclusion: The Salary Outlook for Australia in 2026
The salary environment in Australia for 2026 reflects a period of economic normalisation. Wage growth has moderated from its peak, inflation pressures are easing, and the labour market is gradually balancing.
Annual salary growth is expected to remain around 3 percent, with slight variation depending on sector and skill demand. Real wages are improving modestly, but recovery remains gradual. Productivity challenges continue to shape compensation strategy and policy discussions.
For employers, employees, and HR leaders seeking a complete guide to salaries in Australia for 2026, the central theme is stability with strategic focus. Sustainable growth, productivity alignment, and targeted compensation planning define the Australian salary market in the year ahead.
2. National Earning Benchmarks and Demographic Variations
Understanding national earning benchmarks is essential for anyone reviewing salaries in Australia for 2026. These figures provide insight into what full-time and part-time workers are earning, how compensation differs across demographics, and where income concentration exists. A complete guide to salaries in Australia must go beyond headline averages and examine median earnings, distribution patterns, and gender-based differences to present an accurate picture of the labour market.
Average Weekly Earnings Across Australia
As of May 2025, full-time adult ordinary time earnings reached approximately 2,010.00 dollars per week. This reflects annual growth of 4.5 percent. When overtime payments and bonuses are included, average weekly total earnings for full-time adults increase to 2,086.30 dollars.
However, average or “mean” earnings are often influenced by high-income sectors such as mining and professional services. These industries significantly lift the national average, making it appear higher than what many Australians actually earn.
To better understand the salary landscape in Australia for 2026, it is important to compare mean and median income figures.
Comparison of Average and Median Weekly Earnings
| Earnings Measure | Weekly Amount (AUD) | Annual Growth Rate | Interpretation for Salary Benchmarking |
|---|---|---|---|
| Full-Time Ordinary Time Earnings | 2,010.00 | 4.5% | Reflects base earnings excluding overtime |
| Full-Time Total Earnings (Incl. Extras) | 2,086.30 | Noted Increase | Includes overtime and bonuses |
| Median Weekly Earnings (All Employees) | 1,425.00 | 1.9% | Represents typical worker across full-time and part-time roles |
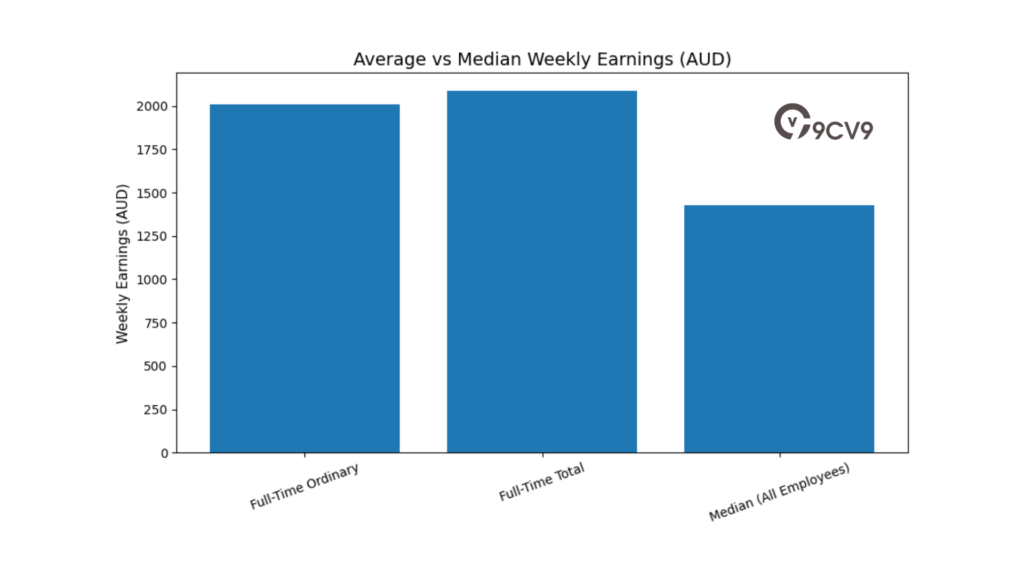
The median weekly earning of 1,425 dollars, recorded in August 2025, includes full-time, part-time, and casual employees. Because the median represents the midpoint of earnings distribution, it provides a more accurate picture of the typical Australian worker’s income.
The gap between the mean and median highlights income concentration in higher-paying industries, while a large share of the workforce continues to earn within more moderate pay brackets.
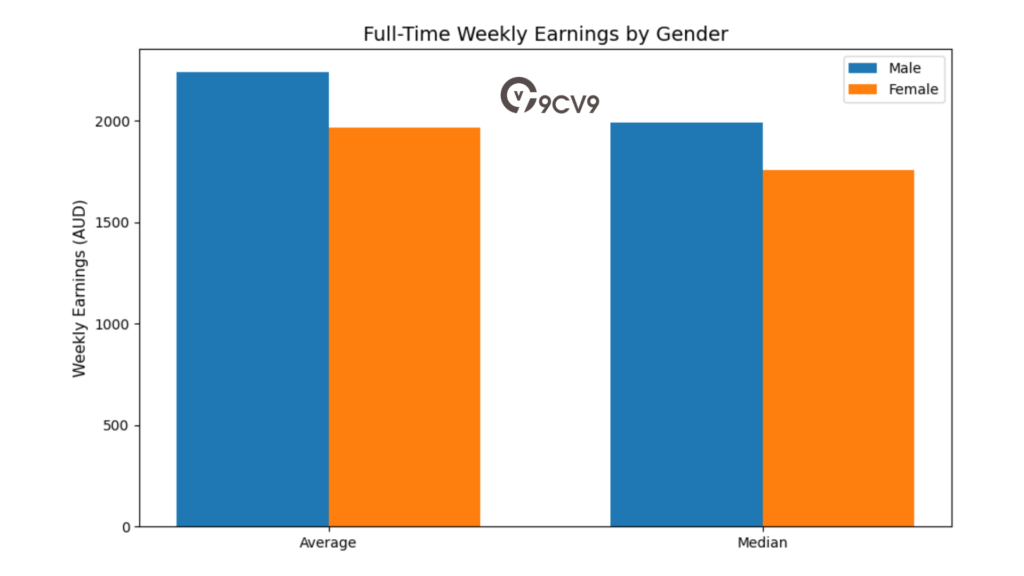
Distribution of Weekly Earnings by Gender and Employment Status
Salary distribution varies significantly by employment type and gender. Full-time workers earn substantially more than part-time workers, and differences between male and female earnings remain evident in 2026.
Distribution of Weekly Total Cash Earnings by Employment Category
| Employment Category | Average Weekly (AUD) | 1st Quartile (AUD) | Median (AUD) | 3rd Quartile (AUD) |
|---|---|---|---|---|
| Full-Time Males | 2,241.10 | 1,472.00 | 1,994.00 | 2,741.00 |
| Full-Time Females | 1,966.10 | 1,370.00 | 1,758.00 | 2,353.00 |
| All Full-Time Persons | 2,130.60 | 1,424.00 | 1,887.00 | 2,560.00 |
| Part-Time Males | 852.50 | 350.00 | 710.00 | 1,120.00 |
| Part-Time Females | 882.10 | 420.00 | 796.00 | 1,193.00 |
| All Employees (Total) | 1,611.10 | 878.00 | 1,436.00 | 2,122.00 |
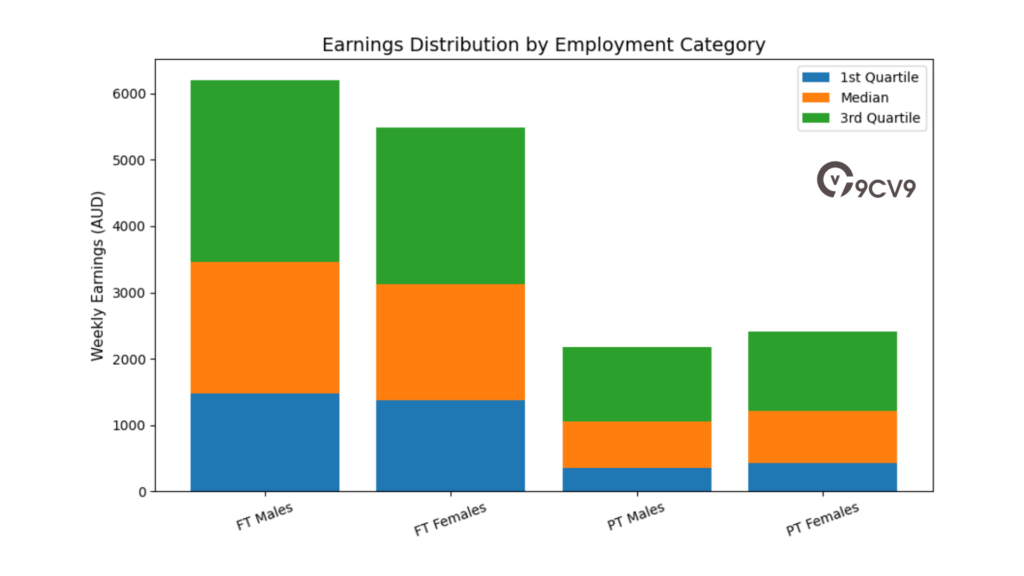
This data demonstrates that full-time roles continue to command significantly higher earnings than part-time roles. It also reveals the persistence of pay differences between male and female employees, particularly in full-time work categories.
Gender Pay Gap in Australia for 2026
The gender pay gap remains a structural feature of the Australian labour market. As of May 2025, the national gender pay gap stood at 11.5 percent. On average, women earned 88 cents for every dollar earned by men.
This translates to a weekly difference of approximately 242.30 dollars, or around 12,600 dollars annually.
State-based differences are significant. Western Australia records the widest gap at 19.6 percent, largely due to the dominance of high-paying mining roles, which are disproportionately male. Tasmania reports the narrowest gap at 1.9 percent.
Gender Pay Gap by Selected States
| State or Territory | Gender Pay Gap (%) | Key Influencing Factor |
|---|---|---|
| Western Australia | 19.6% | Mining sector concentration |
| National Average | 11.5% | Sector and employment-type distribution |
| Tasmania | 1.9% | More balanced industry and employment mix |
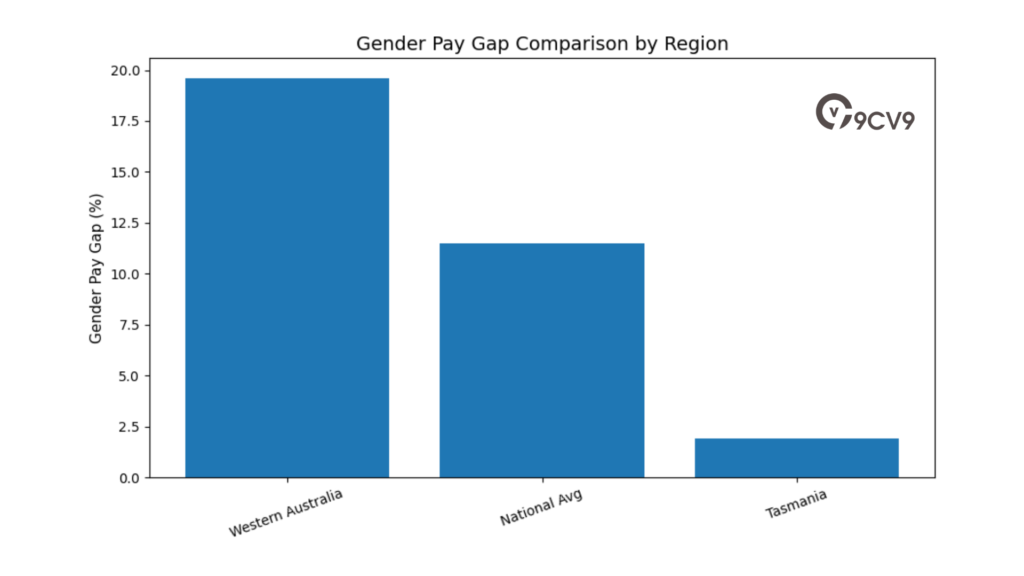
These differences reflect the uneven distribution of men and women across high-paying technical roles compared to lower-paying care and service occupations. Employment patterns, particularly the higher proportion of women in part-time work, also contribute to this gap.
Historical Growth in Median Weekly Earnings
Long-term data shows that nominal earnings in Australia have increased steadily over decades. However, growth has not been uniform. The past three years, from 2022 to 2025, saw particularly strong increases due to a tight labour market and high workforce participation.
Historical Median Weekly Earnings for Full-Time Workers
| Year (August) | Female Full-Time (AUD) | Male Full-Time (AUD) | Economic Context |
|---|---|---|---|
| 1976 | 126 | 159 | Baseline measurement period |
| 1985 | 287 | 357 | Inflation adjustment period |
| 1995 | 500 | 580 | Transition toward service-based economy |
| 2005 | 760 | 900 | Early mining boom expansion |
| 2015 | 1,125 | 1,300 | Post-global financial crisis stability |
| 2020 | 1,342 | 1,500 | Pandemic disruption period |
| 2023 | 1,500 | 1,700 | Post-pandemic labour market recovery |
| 2025 | 1,631 | 1,841 | Current reporting cycle |
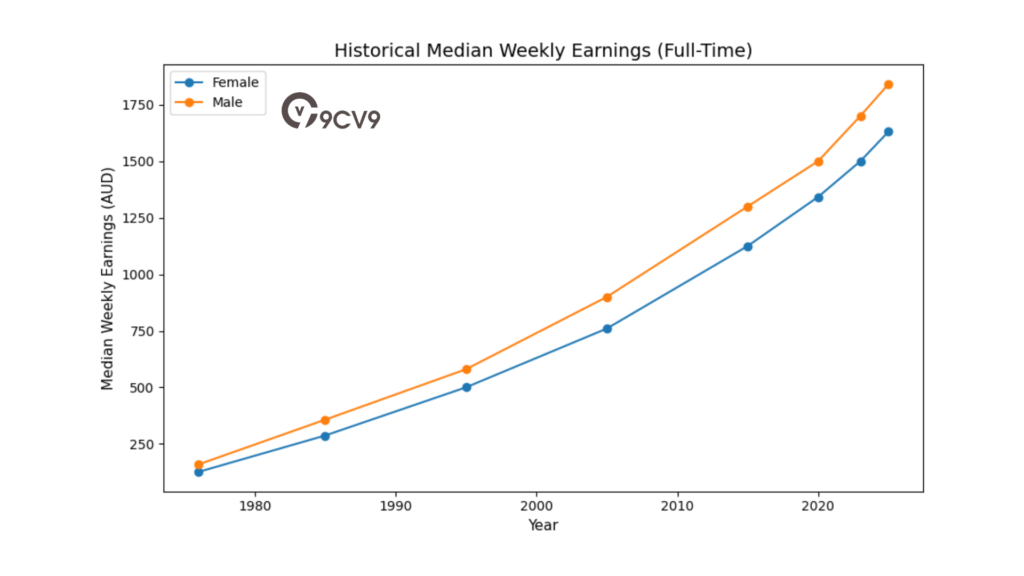
While nominal wage growth has been consistent over the long term, the period between 2022 and 2025 stands out due to record participation rates of 66.8 percent and strong competition for labour.
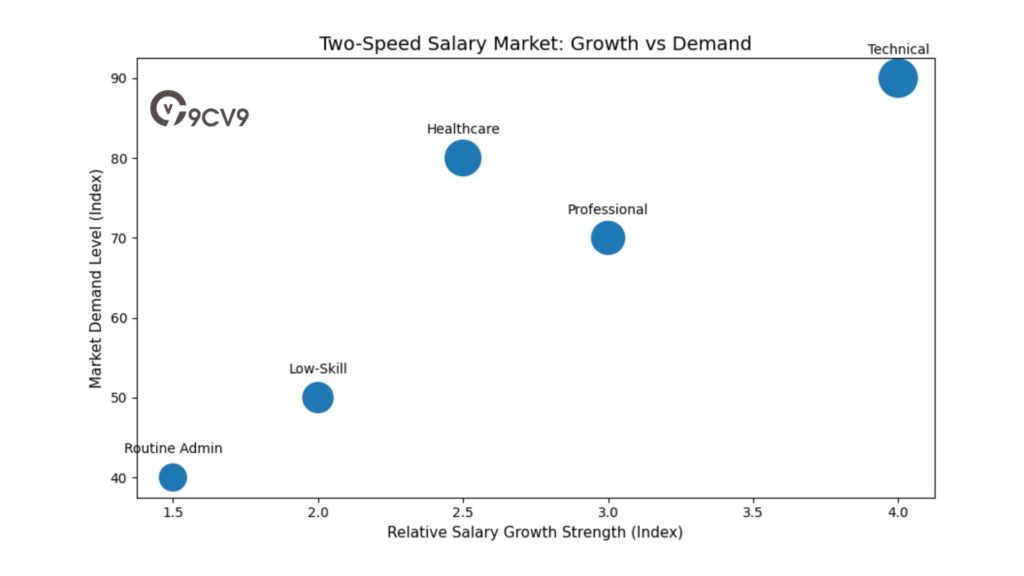
Two-Speed Salary Market in 2026
As Australia enters 2026, the labour market shows a “two-speed” dynamic. Median earnings are rising more quickly in business-critical and high-skill roles, including technology, engineering, finance, and specialised healthcare.
In contrast, routine, automatable, or lower-productivity roles are experiencing slower salary growth. This divergence is influenced by automation trends, productivity pressures, and sector-specific demand.
Salary Growth Matrix by Role Type
| Role Category | Salary Growth Trend | Market Demand Level | Long-Term Outlook |
|---|---|---|---|
| Technical and Engineering | Strong | High | Continued upward salary pressure |
| Professional Services | Moderate to Strong | Stable | Competitive but stabilising |
| Healthcare and Aged Care | Moderate | Consistent | Gradual increases tied to workforce shortages |
| Routine Administrative Roles | Slow | Declining | Limited growth due to automation |
| Casual and Low-Skill Service | Modest | Stable | Wage growth aligned with minimum wage adjustments |
Conclusion: What National Benchmarks Mean for 2026 Salaries
A complete guide to salaries in Australia for 2026 must recognise the difference between averages and typical earnings, the persistence of demographic wage gaps, and the uneven distribution of salary growth across sectors.
National benchmarks show that while overall earnings have increased, income distribution remains concentrated in specialised industries. Median earnings provide a clearer view of everyday salary realities. Gender-based differences persist but vary widely by state and industry.
The Australian salary market in 2026 is defined by stability at the national level, rising participation, and divergence between high-value and routine roles. For employers, policymakers, and professionals, understanding these benchmarks is critical for informed compensation planning and workforce strategy.
3. Structural Analysis of Salaries by Industry Sector

A complete guide to salaries in Australia for 2026 must include a detailed structural analysis of pay levels across industry sectors. The Australian economy shows significant differences between high-capital industries such as mining and utilities, and high-employment service industries such as retail and hospitality.
These differences are influenced by capital intensity, skill requirements, productivity levels, regulatory frameworks, and workforce composition. In 2026, Australia continues to demonstrate one of the widest salary gaps between top-paying and lowest-paying industries among advanced economies.
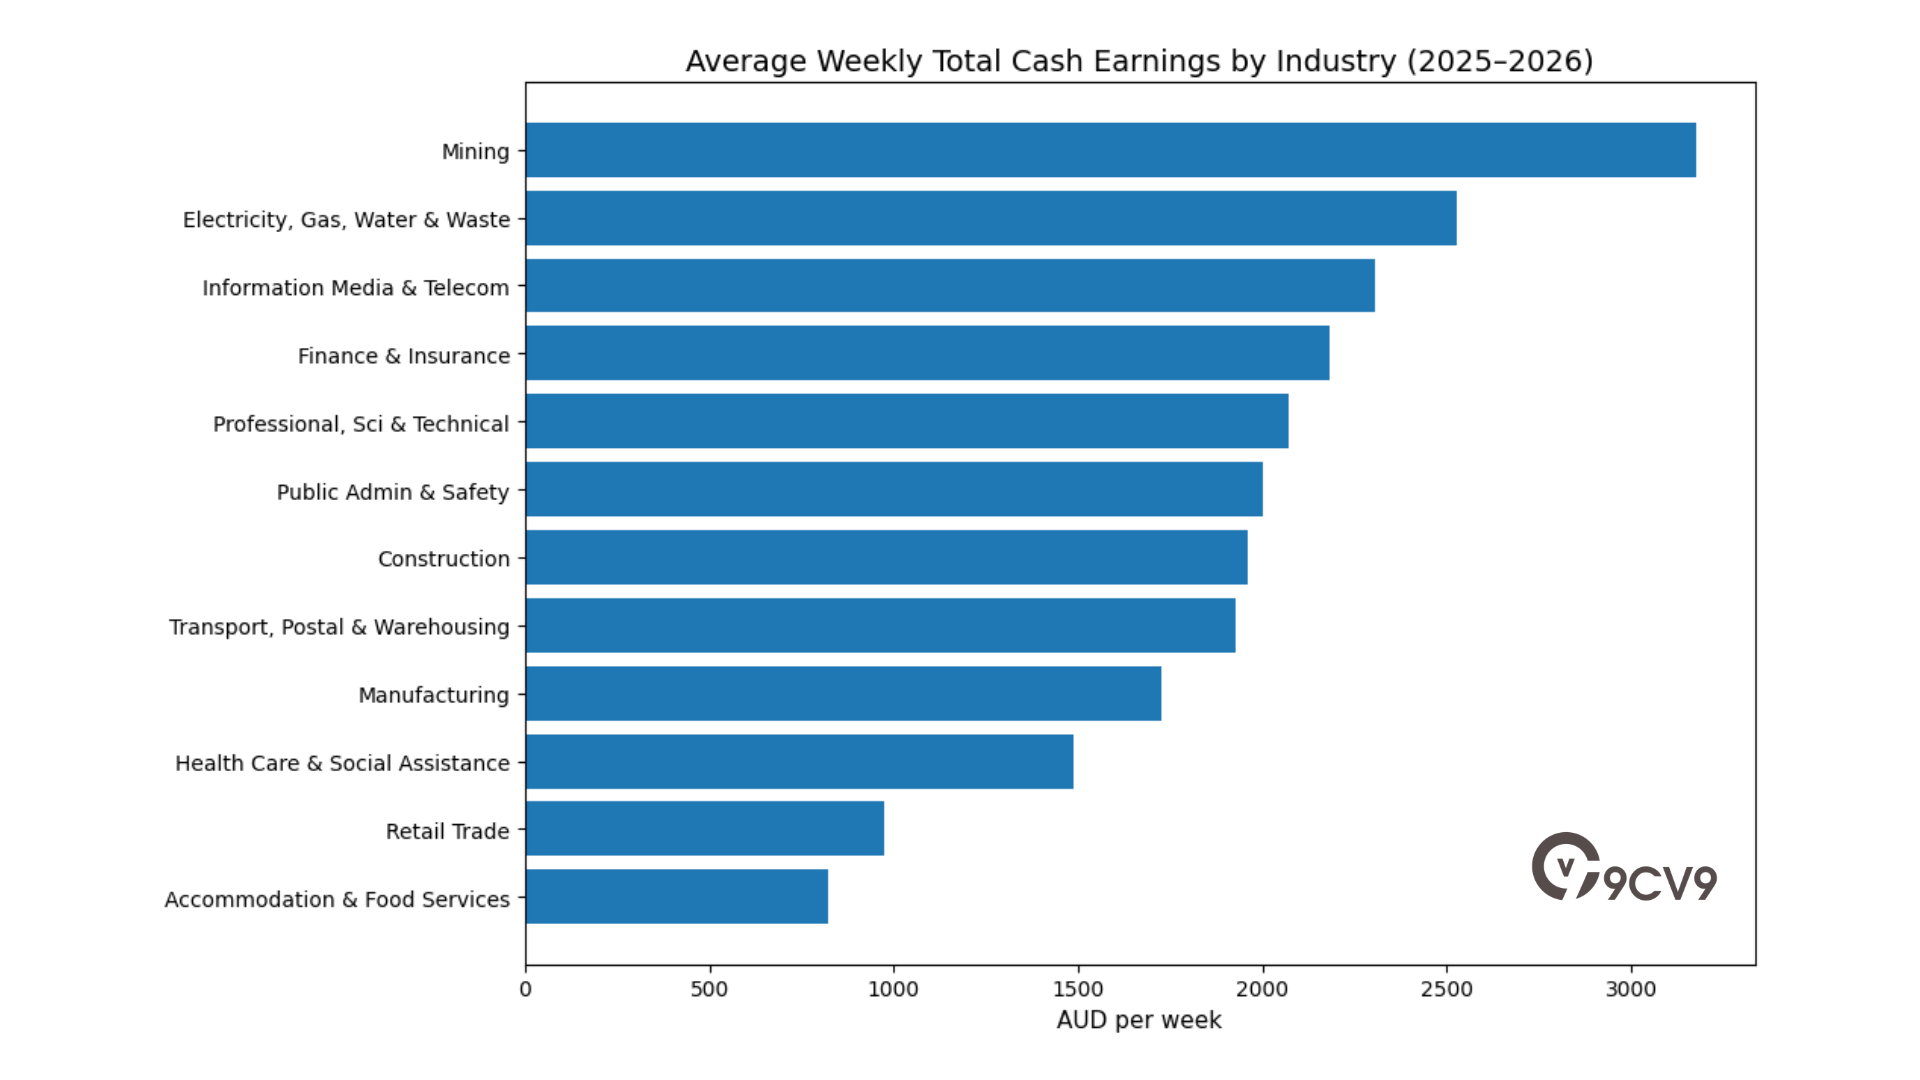
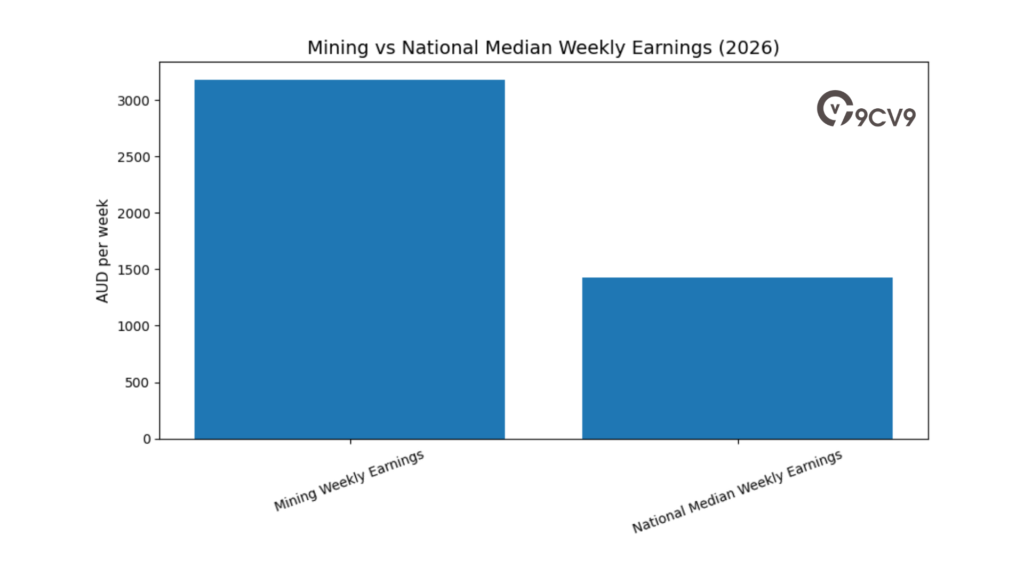
At the top of the income scale, mining remains the highest-paying sector, reflecting strong export demand, high productivity per worker, and a capital-intensive business model. At the lower end, accommodation and food services record the lowest average weekly earnings, largely due to part-time employment, casual contracts, and lower hourly skill requirements.
Sectoral Earnings and Productivity Overview
The following table illustrates average weekly total cash earnings, hourly earnings, and average paid hours across major industries in 2025–2026.
Sectoral Earnings and Work Hours Comparison
| Industry Sector | Avg Weekly Total Cash Earnings (AUD) | Avg Hourly Cash Earnings (AUD) | Avg Weekly Hours Paid |
|---|---|---|---|
| Mining | 3,177.70 | 74.10 | 42.4 |
| Electricity, Gas, Water & Waste | 2,525.30 | 63.80 | 38.2 |
| Information Media & Telecommunications | 2,304.80 | 59.80 | 34.4 |
| Finance & Insurance Services | 2,181.20 | 56.10 | 35.6 |
| Professional, Scientific & Technical | 2,072.40 | 54.50 | 33.9 |
| Public Administration & Safety | 2,001.00 | 55.20 | 34.4 |
| Construction | 1,960.80 | 49.00 | 38.7 |
| Transport, Postal & Warehousing | 1,926.40 | 48.00 | 37.6 |
| Manufacturing | 1,725.00 | 44.30 | 36.2 |
| Health Care & Social Assistance | 1,487.90 | 52.80 | 27.7 |
| Retail Trade | 975.00 | 34.30 | 25.6 |
| Accommodation & Food Services | 823.60 | 32.10 | 22.9 |
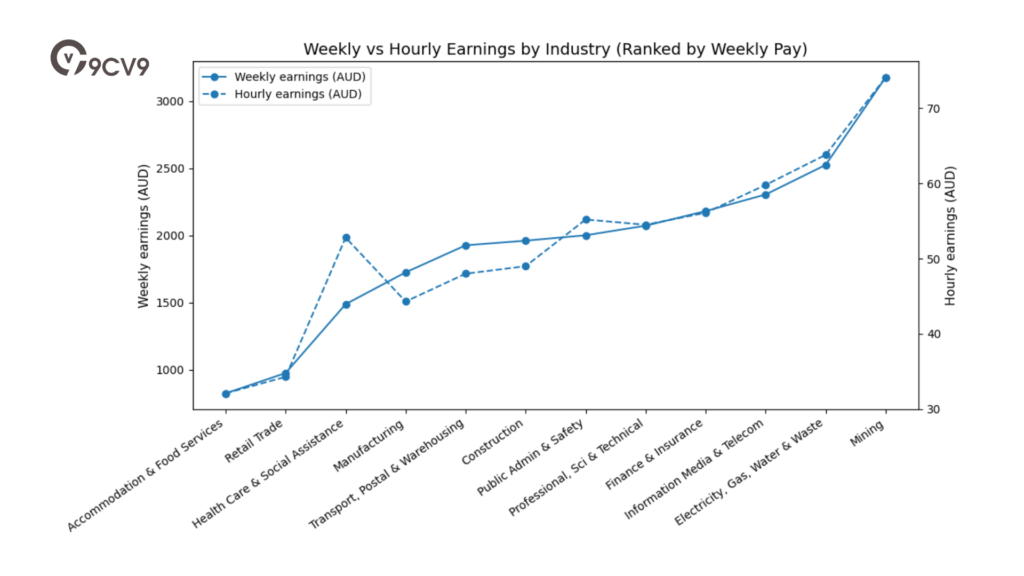
This data highlights several important structural patterns within the Australian salary market in 2026.
High-Paying Capital-Intensive Industries
Mining leads all sectors with average weekly total earnings exceeding 3,100 dollars. This is driven by high global commodity demand, capital-heavy operations, remote site allowances, and skill-intensive roles. Workers in this sector also record the highest average weekly paid hours at 42.4 hours.
Utilities and infrastructure sectors, including electricity, gas, water, and waste services, also show strong earnings. These industries benefit from technical specialization, regulated pricing models, and stable long-term investment cycles.
Technology and knowledge-based sectors such as information media, telecommunications, finance, and professional services also maintain high average hourly rates. Although weekly hours in these sectors are slightly lower, strong hourly earnings reflect skill premiums and productivity per worker.
Lower-Paying High-Volume Service Industries
Retail trade and accommodation and food services remain at the lower end of the salary spectrum. The key reasons include:
• High levels of part-time and casual employment
• Lower average weekly hours
• Greater use of entry-level labour
• Tighter operating margins
While hourly wages in these sectors comply with award structures and minimum wage regulations, total weekly earnings are lower due to reduced working hours.
Salary Distribution Matrix by Industry Type
| Industry Category | Capital Intensity | Skill Requirement | Avg Weekly Earnings Level | Salary Growth Outlook |
|---|---|---|---|---|
| Mining & Resources | Very High | High | Very High | Stable to Moderate |
| Utilities & Infrastructure | High | High | High | Stable |
| Technology & Finance | Moderate | Very High | High | Strong |
| Construction & Transport | Moderate | Moderate | Upper-Mid | Moderate |
| Healthcare & Social Assistance | Moderate | High | Mid | Strong |
| Retail & Hospitality | Low | Low to Moderate | Low | Modest |
Healthcare and the Expanding Care Economy
Although healthcare and social assistance report lower average weekly totals compared to mining and finance, the sector remains one of the most important drivers of employment growth in Australia for 2026.
The healthcare and social assistance industry is projected to add approximately 301,000 jobs by November 2026. This makes it one of the fastest-growing sectors in the national economy.
While average weekly earnings are influenced by part-time employment patterns, specialist professionals within healthcare command some of the highest hourly rates in the country. Surgeons, specialists, advanced practitioners, and allied health professionals benefit from strong demand and skill scarcity.
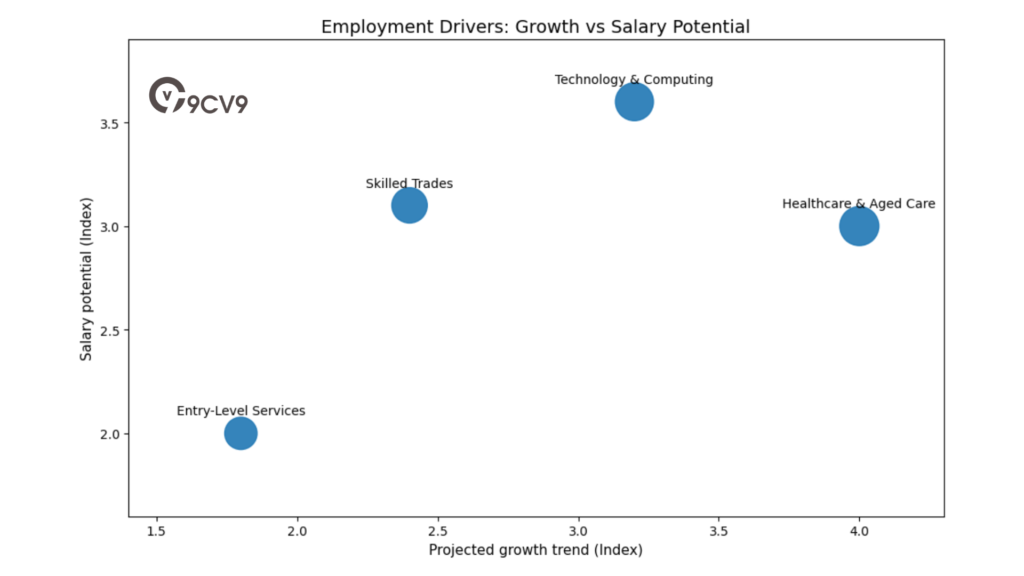
The Rise of the Care Economy
Government analysts identify the care economy as the primary engine of future employment growth. This includes:
• Care services such as healthcare and aged care
• Computing roles in digital and IT services
• Cognitive skill-based professions
• Communication-driven service occupations
Approximately 90 percent of new jobs expected over the next five years will require post-secondary qualifications. This shift indicates that higher education, vocational training, and professional certifications are becoming increasingly important determinants of earning potential in Australia.
Employment and Qualification Outlook
| Employment Driver Category | Projected Growth Trend | Qualification Requirement | Salary Potential |
|---|---|---|---|
| Healthcare & Aged Care | Very Strong | Post-secondary required | Moderate to High |
| Technology & Computing | Strong | Degree or technical cert | High |
| Skilled Trades | Moderate | Vocational certification | Mid to High |
| Entry-Level Services | Stable | Minimal formal requirement | Low to Moderate |
Two-Speed Industry Salary Market in 2026
Australia’s industry salary structure in 2026 reflects a two-speed dynamic. Capital-intensive and knowledge-driven industries continue to generate high earnings due to productivity and export strength. Meanwhile, labour-intensive service sectors remain essential for employment volume but offer lower weekly earnings.
The gap between industries is expected to remain pronounced, particularly as automation, digital transformation, and global demand continue to favour high-skill and high-productivity sectors.
Conclusion: What Industry Structure Means for Salary Planning in 2026
An informed understanding of industry-based salary differences is critical when analysing salaries in Australia for 2026. National averages alone do not reflect the sharp contrasts between mining and hospitality, or between technology and retail.
High-paying industries are characterised by capital investment, advanced skills, and productivity efficiency. Lower-paying sectors typically involve shorter working hours, higher casualisation, and tighter profit margins.
For professionals, career mobility into high-skill sectors can significantly increase earning potential. For employers and policymakers, addressing productivity, training, and workforce development remains central to shaping a balanced and competitive salary landscape in Australia.
a. The Resources and Energy Sector
The Mining Industry as a Foundation of National Earnings
Within a complete guide to salaries in Australia for 2026, the resources and energy sector stands out as the strongest contributor to high-income employment. Mining continues to provide one of the highest earning baselines in the national economy. Its compensation levels are significantly above the national average and reflect the sector’s capital intensity, export strength, and productivity performance.
Average weekly total cash earnings in mining remain above 3,177 dollars, placing it well ahead of all other industries. This high baseline is not limited to base wages alone. The industry is structured around additional income components that further increase take-home pay for many workers.
Compensation Structure in Mining and Energy
Unlike many service industries, the mining sector incorporates structured allowances and performance-linked incentives. These additional payments are particularly common in remote and regional operations, including fly-in fly-out arrangements. Workers in these roles often receive location allowances, site bonuses, and production-based incentives.
Mining Compensation Components Matrix
| Compensation Element | Description | Impact on Total Earnings |
|---|---|---|
| Base Salary | Fixed annual wage based on role and experience | Provides strong national salary benchmark |
| FIFO Allowances | Compensation for remote and rotational work arrangements | Increases overall take-home pay |
| Regional Residency Allowances | Incentives for living in remote mining communities | Offsets cost of living and location factors |
| Performance Bonuses | Linked to productivity or company profitability | Enhances annual income variability |
| Overtime and Shift Loading | Payment for extended hours or irregular schedules | Boosts weekly earnings significantly |
This layered structure means that actual annual income for mining professionals frequently exceeds the advertised base salary.
Graduate Salaries in the Resources Sector
Early-career professionals entering the mining and energy sector are offered highly competitive packages compared with most other Australian industries. For example, graduate programs commencing in early 2027 are offering base salaries ranging from 89,000 to 115,000 dollars annually. These packages are further enhanced through allowances and performance-based incentives.
Graduate Salary Benchmark in Mining
| Role Level | Base Salary Range (AUD) | Additional Incentives Included | Comparative Position in National Market |
|---|---|---|---|
| Graduate Engineer | 89,000 – 115,000 | Yes | Among the highest graduate pay bands |
| Technical Graduate | 90,000 – 110,000 | Yes | Above national graduate median |
| Operations Trainee | 85,000 – 105,000 | Often included | Competitive across industrial sectors |
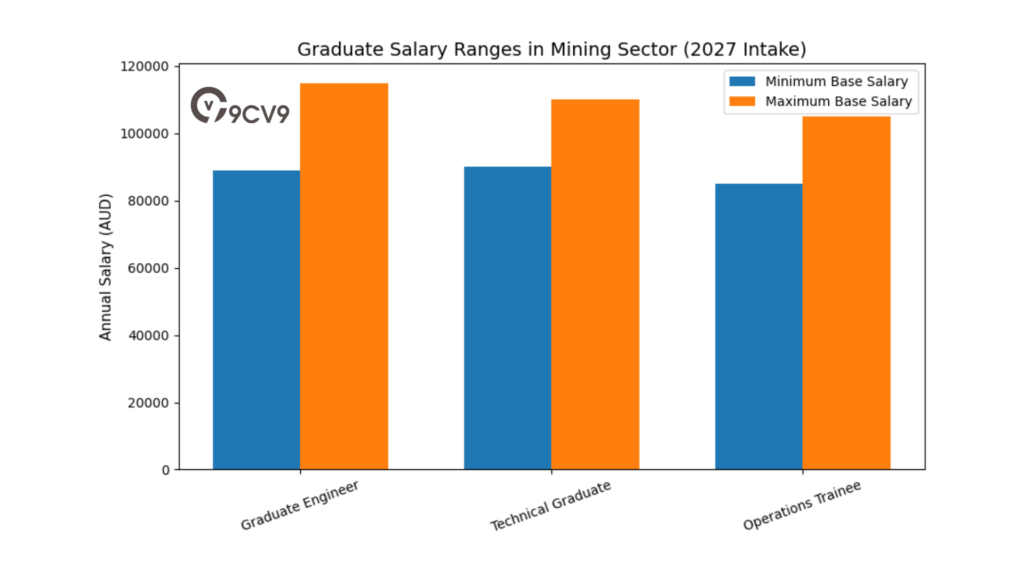
These entry-level salary levels are substantially higher than the national median earnings for full-time employees. As a result, mining continues to attract graduates in engineering, geoscience, technology, and project management.
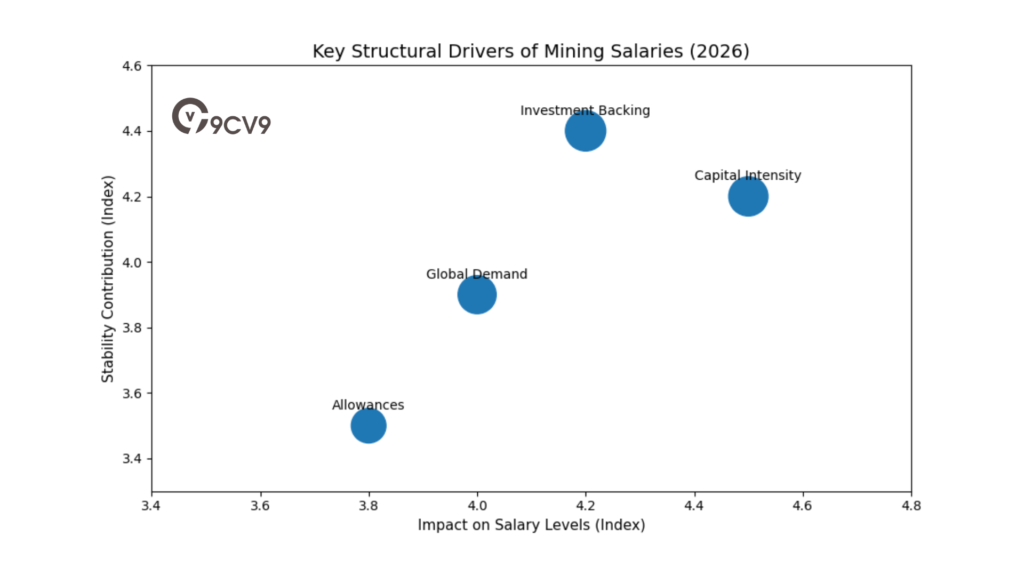
Profit Stability and Investment Backing
The strength of mining salaries in Australia for 2026 is closely linked to the sector’s financial performance. The industry benefits from stable export demand, large-scale infrastructure investment, and long-term global commodity needs.
Profit margins in major resource firms remain robust. Superannuation funds, which allocate a significant portion of their portfolios to resources and energy assets, are projected to reach total profits of approximately 404.8 billion dollars in 2026. This level of investment reinforces the sector’s financial resilience and supports its capacity to maintain high wage levels.
Resources Sector Financial Stability Matrix
| Financial Indicator | 2026 Outlook | Influence on Salaries |
|---|---|---|
| Corporate Profit Margins | Stable to Strong | Sustains high base salaries |
| Superannuation Fund Exposure | Significant allocation | Provides long-term capital backing |
| Global Commodity Demand | Ongoing structural demand | Supports employment continuity |
| Infrastructure Investment | Continued expansion | Drives need for skilled workforce |
The integration of institutional investment and export-driven revenue strengthens the long-term wage outlook in the resources and energy sector.
Role of FIFO and Regional Employment
Fly-in fly-out arrangements remain central to the sector’s employment model. Workers travel to remote sites for rostered shifts and then return to metropolitan areas. While this model supports high income levels, it also reflects the geographic concentration of resource extraction in remote regions.
Higher earnings in these roles compensate for demanding schedules, location isolation, and shift-based operations. As a result, mining salaries are often viewed as premium compensation packages rather than standard employment arrangements.
Strategic Outlook for Mining Salaries in 2026
In the broader Australian salary landscape for 2026, the resources and energy sector continues to represent the upper tier of income potential. The combination of high base wages, structured allowances, bonus frameworks, and strong institutional investment positions mining as a benchmark industry for compensation.
However, entry into the sector typically requires specialised education, technical certification, or engineering qualifications. As automation and sustainability initiatives expand, demand for advanced technical skills is likely to increase further.
For professionals evaluating salary opportunities in Australia, the mining and energy sector remains one of the most financially rewarding career pathways. For employers and policymakers, maintaining productivity and investment stability will be key to preserving this position within the national earnings structure.
b. Information Technology and the Artificial Intelligence Premium
The Shift Toward Specialised Technology Roles
A complete guide to salaries in Australia for 2026 must recognise the structural transformation taking place within the technology sector. The industry is moving away from broad, generalist engineering roles toward highly specialised expertise in artificial intelligence, cybersecurity architecture, cloud infrastructure, and enterprise systems governance.
Digital adoption has accelerated across finance, healthcare, mining, government, retail, and manufacturing. As a result, demand for senior technology leadership has intensified. Organisations are no longer simply hiring developers; they are investing in strategic technology leaders who can guide digital transformation, manage AI integration, and protect enterprise systems from growing cyber threats.
This shift has introduced what many analysts describe as an “AI premium” in salary structures, where professionals with advanced artificial intelligence and security architecture expertise command significantly higher compensation.
Senior Technology Leadership Salary Benchmarks
In 2026, salaries for IT Directors and Chief Information Officers have reached record levels. Depending on company size, industry complexity, and transformation scope, total compensation packages now range between 280,000 and 480,000 dollars annually.
Senior Technology Executive Salary Range
| Executive Role | Estimated Salary Range (AUD) | Key Value Drivers | Market Demand Level |
|---|---|---|---|
| IT Director | 280,000 – 380,000 | Enterprise systems leadership, digital roadmap | High |
| Chief Information Officer | 320,000 – 480,000 | Strategic transformation, AI adoption, governance | Very High |
| Chief Technology Officer | 300,000 – 450,000 | Innovation leadership, platform scalability | Very High |
| Head of Cybersecurity | 250,000 – 400,000 | Risk mitigation, regulatory compliance, threat defence | Extremely High |
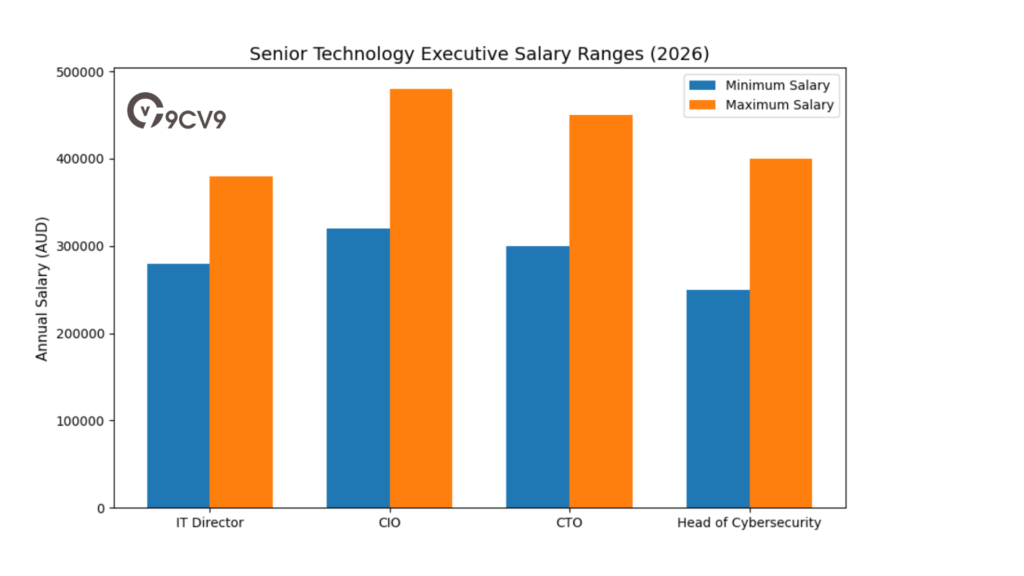
These figures reflect a tightening talent pool at the executive and enterprise architecture level. Companies competing for experienced leaders are often offering performance incentives, long-term equity participation, and retention bonuses in addition to base salary.
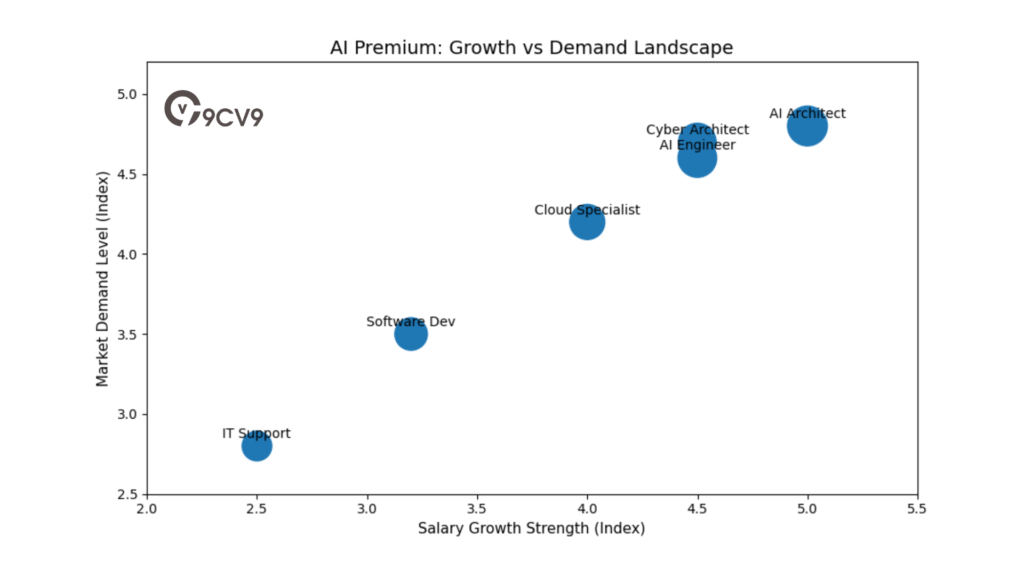
The Artificial Intelligence Salary Premium
Artificial intelligence has become a defining force in Australia’s 2026 technology salary market. Organisations implementing generative AI, predictive analytics, and automation tools require professionals who understand machine learning infrastructure, data governance, and ethical AI deployment.
The shortage of experienced AI professionals has resulted in above-average salary growth compared with traditional software development roles.
AI and Specialised Technology Salary Comparison
| Role Category | Salary Growth Trend | Relative Pay Position | Key Skill Requirement |
|---|---|---|---|
| AI Engineer | Strong | Very High | Machine learning, data modelling |
| AI Architect | Very Strong | Premium Tier | Enterprise AI integration, governance |
| Cybersecurity Architect | Strong | High | Threat modelling, compliance frameworks |
| Cloud Infrastructure Specialist | Moderate to Strong | High | Scalable systems design |
| General Software Developer | Moderate | Upper Mid | Application development |
| IT Support and Operations | Stable | Mid | Systems maintenance |
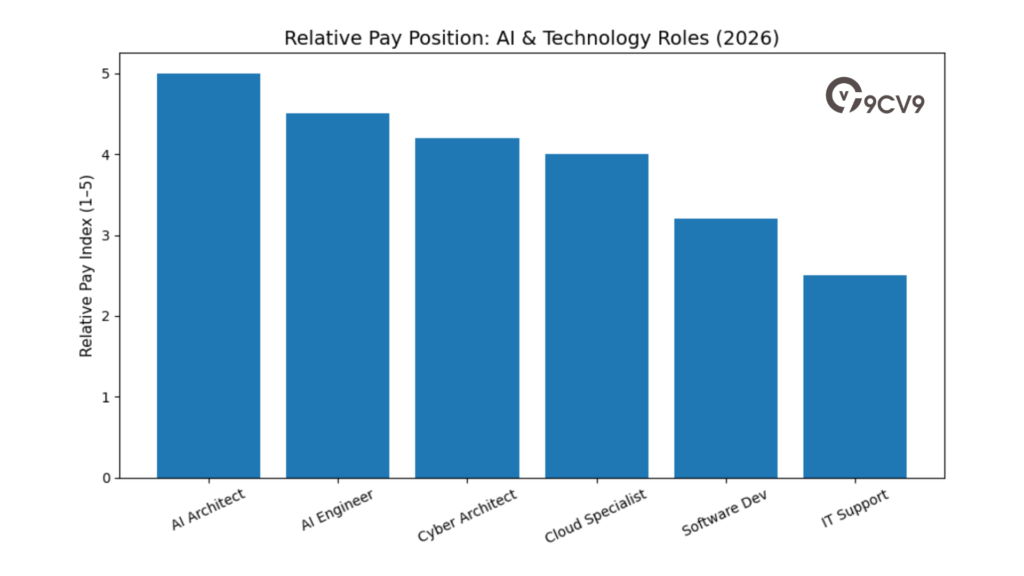
Professionals with expertise in generative AI frameworks and advanced cybersecurity strategy are receiving premium compensation offers, particularly in industries handling sensitive data such as finance, healthcare, and government.
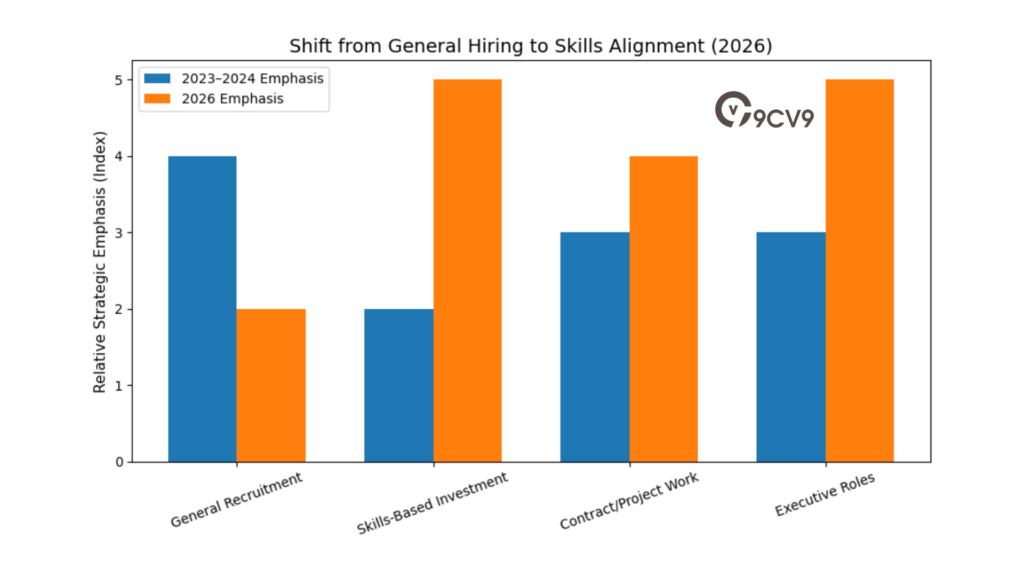
From Transactional Hiring to Skills Alignment
One of the most significant changes in 2026 is the shift in hiring strategy. Employers are no longer filling roles based purely on headcount requirements. Instead, organisations are allocating targeted growth budgets to business-critical skill areas.
This approach focuses on “skills alignment,” meaning companies assess strategic capability gaps before approving technology hires. Budget allocation is increasingly directed toward:
• Generative AI integration
• Data security and privacy protection
• Cloud transformation and hybrid infrastructure
• Automation and process optimisation
Technology Hiring Strategy Matrix
| Hiring Approach | 2023–2024 Trend | 2026 Trend | Impact on Salaries |
|---|---|---|---|
| General Recruitment | Broad hiring for expansion | More selective | Stable pay for general roles |
| Skills-Based Investment | Emerging focus | Primary strategy | Premium pay for critical expertise |
| Contract and Project Work | Common for scaling | Strategic and targeted | Higher rates for niche specialists |
| Executive Technology Roles | Competitive | Intensely competitive | Significant salary escalation |
This strategic shift has widened the compensation gap between highly specialised experts and mid-level or generalist roles.
Technology Sector Salary Outlook for 2026
The Australian technology salary market in 2026 reflects a two-tier structure. At the top are AI architects, cybersecurity leaders, and enterprise CIOs commanding premium packages. At the mid-level are developers, engineers, and operations professionals experiencing steady but more moderate salary growth.
Industry-wide digital transformation ensures continued demand for technical skills. However, the strongest salary increases are reserved for professionals who can combine technical expertise with strategic business insight.
Conclusion: The Role of IT and AI in Australia’s Salary Growth
In the broader context of salaries in Australia for 2026, the technology sector represents one of the most dynamic and rapidly evolving pay environments. Executive-level compensation has reached new highs, and specialised AI and cybersecurity roles are driving a clear salary premium.
Organisations are prioritising strategic capability over volume hiring, directing compensation budgets toward roles that enable long-term competitiveness and digital resilience. For professionals seeking strong income growth, expertise in artificial intelligence, security architecture, and enterprise systems leadership offers some of the most lucrative opportunities in the Australian labour market.
c. Finance and Corporate Services
Executive Compensation in the Corporate Sector
A complete guide to salaries in Australia for 2026 must include a detailed review of finance and corporate leadership pay structures. Corporate executive roles remain among the highest-paying positions in the country, particularly within finance, accounting, and enterprise governance functions.
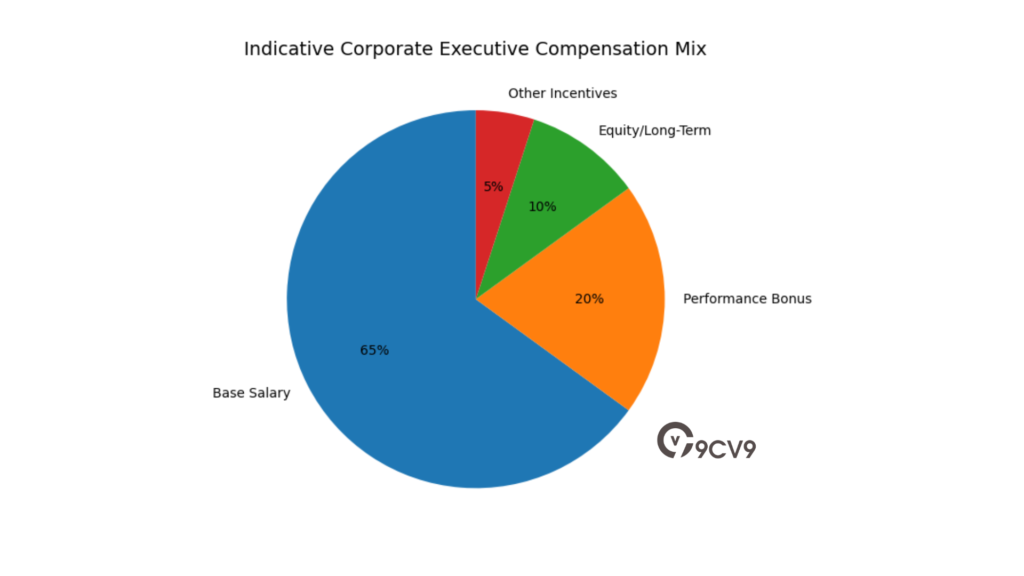
Chief Financial Officers and senior finance leaders play a central role in capital allocation, regulatory compliance, strategic planning, and risk management. As a result, their compensation is closely tied to organisational size, revenue scale, and operational complexity.
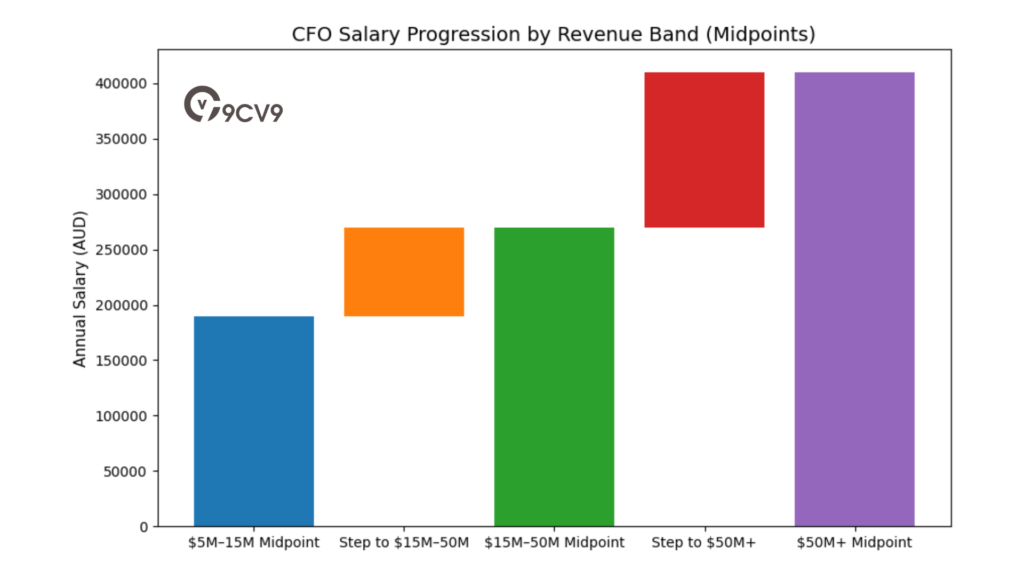
In 2026, CFO salary benchmarks are primarily influenced by company revenue, rather than job title alone. Larger organisations with greater financial oversight requirements and global exposure typically offer substantially higher base pay.
CFO Base Salary by Company Revenue Size
| Company Revenue Band | Base Salary Range (AUD) | Organisational Complexity Level | Compensation Position in Market |
|---|---|---|---|
| 5M – 15M Revenue | 160,000 – 220,000 | Moderate | Competitive mid-market tier |
| 15M – 50M Revenue | 220,000 – 320,000 | High | Upper mid-tier corporate level |
| 50M+ Revenue | 320,000 – 500,000+ | Very High | Executive premium tier |
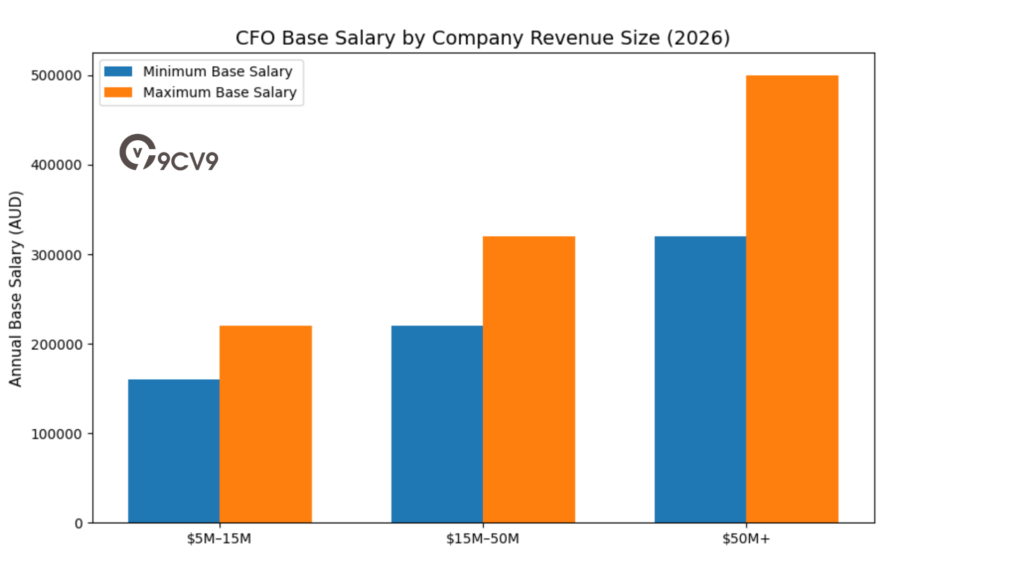
In organisations exceeding 50 million dollars in revenue, total remuneration often extends beyond base salary. Long-term incentives, equity participation, profit-sharing arrangements, and performance bonuses can significantly increase total earnings beyond the base range.
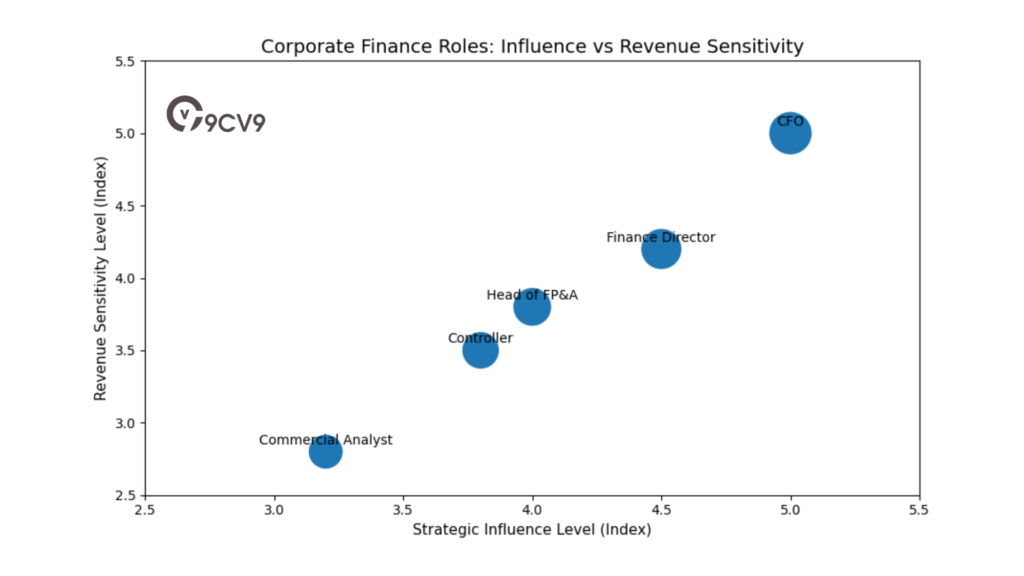
Corporate Finance Role Hierarchy and Salary Positioning
Beyond CFO roles, finance departments include controllers, finance directors, heads of FP&A, and senior commercial analysts. These roles support executive decision-making and regulatory compliance, particularly in publicly listed and multinational firms.
Corporate Finance Salary Position Matrix
| Role Title | Typical Salary Position | Revenue Sensitivity | Strategic Influence Level |
|---|---|---|---|
| Chief Financial Officer | Executive Tier | Very High | Enterprise-wide |
| Finance Director | Senior Executive | High | Strategic and operational |
| Financial Controller | Upper Management | Moderate | Operational governance |
| Head of FP&A | Senior Management | Moderate | Strategic planning |
| Senior Commercial Analyst | Mid to Upper Tier | Low to Moderate | Business unit support |
As company revenue increases, the scope of financial oversight expands. This includes treasury management, investor relations, risk mitigation, mergers and acquisitions, and regulatory reporting, all of which elevate executive compensation levels.
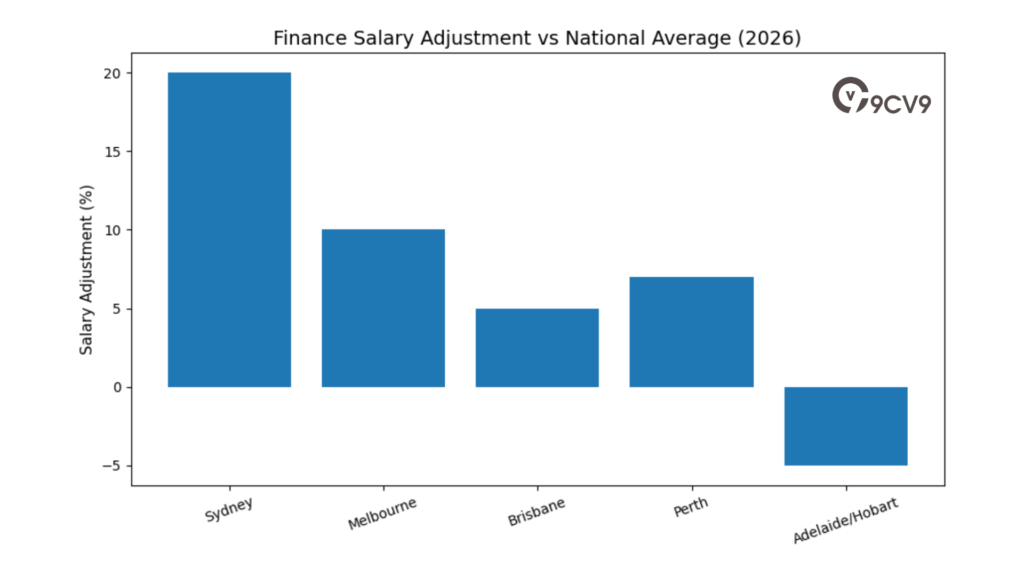
Sydney Premium in Finance Salaries
Location continues to play a critical role in finance compensation. Sydney remains Australia’s primary corporate and financial hub, hosting the majority of ASX-listed company headquarters, major banks, investment firms, and multinational subsidiaries.
In 2026, finance roles based in Sydney typically attract a 15 percent to 25 percent salary premium compared to similar roles in other Australian cities. This premium reflects several structural factors:
• Concentration of corporate headquarters
• Higher cost of living
• Greater exposure to capital markets
• Increased competition for senior talent
Location-Based Salary Adjustment Matrix
| City or Region | Salary Adjustment vs National Average | Market Characteristics |
|---|---|---|
| Sydney | +15% to +25% | Corporate headquarters concentration |
| Melbourne | +5% to +15% | Strong finance and professional services |
| Brisbane | 0% to +10% | Growing corporate and infrastructure market |
| Perth | Variable | Resources-driven corporate activity |
| Adelaide / Hobart | Below National Average | Smaller corporate ecosystems |
The Sydney premium is particularly visible in large-scale enterprises and multinational corporations where executive roles involve international reporting lines and investor-facing responsibilities.
Corporate Services Beyond Finance
Corporate services in 2026 also include legal counsel, human resources leadership, procurement heads, and strategy executives. While finance roles often lead compensation rankings within corporate structures, other executive functions also command significant packages depending on company scale and sector.
Cross-Functional Executive Salary Drivers
| Compensation Driver | Influence on Salary Level |
|---|---|
| Company Revenue Size | Very High |
| Public vs Private Ownership | High |
| Industry Sector | Moderate to High |
| Geographic Location | Moderate |
| International Operations Scope | High |
Executives in companies operating across multiple jurisdictions or listed on public markets often receive enhanced remuneration due to regulatory complexity and shareholder accountability.
Salary Outlook for Finance Professionals in 2026
The finance and corporate services sector in Australia for 2026 remains one of the most stable and well-compensated career pathways. Salary growth is not driven by volume hiring but by increasing governance demands, capital management requirements, and enterprise risk oversight.
While base salary is closely linked to revenue scale, total compensation is often shaped by performance metrics, profitability, and shareholder returns. Professionals aspiring to reach executive pay tiers typically require advanced qualifications such as CPA, CA, or MBA credentials, combined with leadership experience.
Conclusion: Corporate Finance as a High-Value Career Path
In the broader Australian salary market for 2026, corporate leadership roles continue to represent some of the highest earning opportunities outside of mining and specialised technology. CFO compensation scales significantly with company revenue, and location-based premiums further enhance earning potential in major financial centres such as Sydney.
For finance professionals seeking upward mobility, progression into strategic leadership, capital markets exposure, and large-scale enterprise management remains the key pathway to premium compensation within Australia’s corporate sector.
4. High-Earning Professional Roles and Medical Specialties
A complete guide to salaries in Australia for 2026 must highlight the professions that sit at the very top of the national income distribution. In 2026, medical specialists continue to dominate the highest static salary bands, reflecting extensive training requirements, clinical complexity, and limited workforce supply.
Many of these roles require more than 15 years of education and specialist training beyond an initial medical degree. The scarcity of qualified practitioners, combined with rising healthcare demand and an ageing population, supports exceptionally high remuneration.
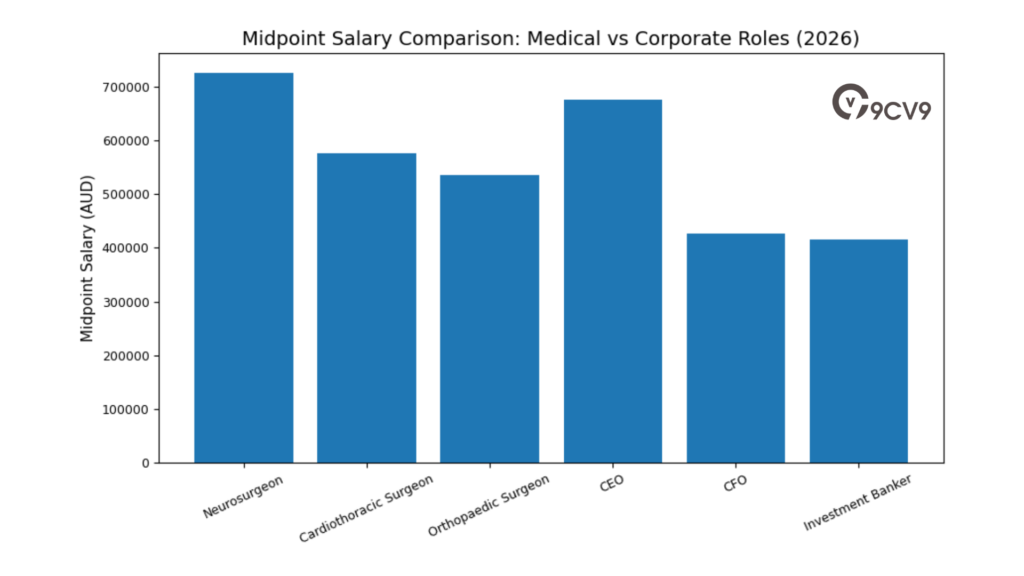
At the same time, corporate and executive leadership roles also appear in the top earnings bracket. However, executive compensation often includes performance shares, long-term incentives, and equity participation that can significantly increase total pay beyond base salary.
Top 15 Highest Paying Positions in Australia in 2026
The following table outlines the leading high-income roles in Australia for 2026, along with indicative salary ranges and qualification context.
Top High-Income Roles Salary Benchmark
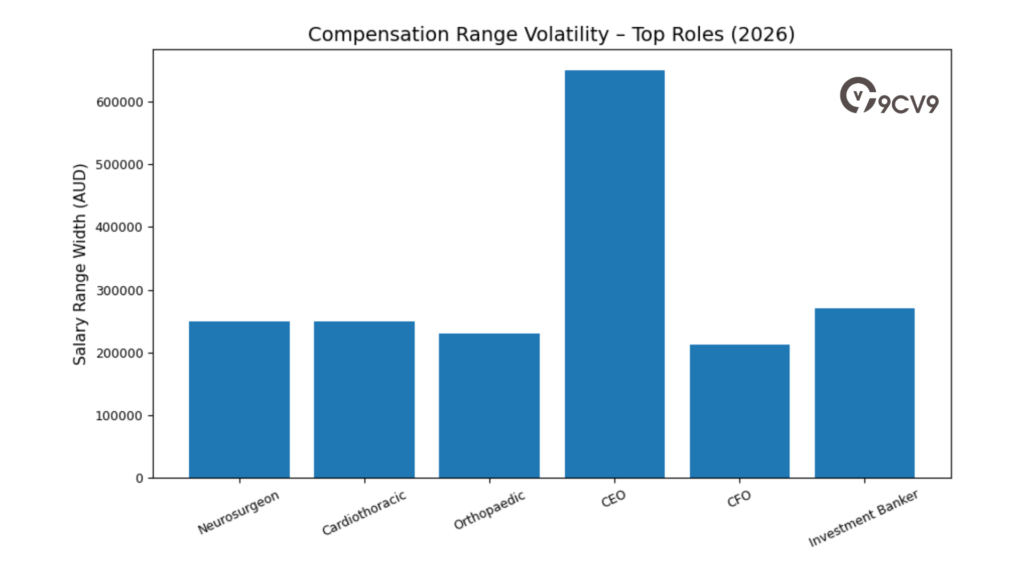
| Rank | Job Title | Average Annual Salary Range (AUD) | Qualification or Context Requirement |
|---|---|---|---|
| 1 | Neurosurgeon | 600,000 – 850,000+ | Medical degree plus 15+ years specialist surgical training |
| 2 | Chief Strategy Officer | 750,000+ | Corporate transformation leadership at enterprise scale |
| 3 | Cardiothoracic Surgeon | 450,000 – 700,000 | Advanced heart and lung surgical specialisation |
| 4 | Chief Executive Officer | 350,000 – 1,000,000+ | Enterprise-wide accountability and equity exposure |
| 5 | Ophthalmologist | 450,000 – 650,000 | Specialist training in eye surgery and vision care |
| 6 | Anaesthetist | 420,000 – 600,000 | Critical care and surgical anaesthesia expertise |
| 7 | Orthopaedic Surgeon | 420,000 – 650,000 | Bone and joint reconstruction specialisation |
| 8 | Chief Financial Officer | 320,000 – 533,000+ | Revenue-dependent corporate financial leadership |
| 9 | Investment Banker | 280,000 – 550,000+ | Finance and capital markets expertise |
| 10 | IT Director / Chief Information Officer | 280,000 – 480,000 | Digital transformation and cybersecurity leadership |
| 11 | Mining Site Manager | 280,000 – 480,000+ | Remote operations and large-scale resource management |
| 12 | Project Director (Construction) | 280,000 – 450,000 | Major infrastructure and capital works oversight |
| 13 | Enterprise Architect | 150,000 – 260,000 | Enterprise IT systems design and integration leadership |
| 14 | Chief Information Security Officer | 220,000 – 302,500 | Advanced cyber risk management and governance |
| 15 | Program Manager (IT) | 160,000 – 260,000 | Technology portfolio coordination and delivery |
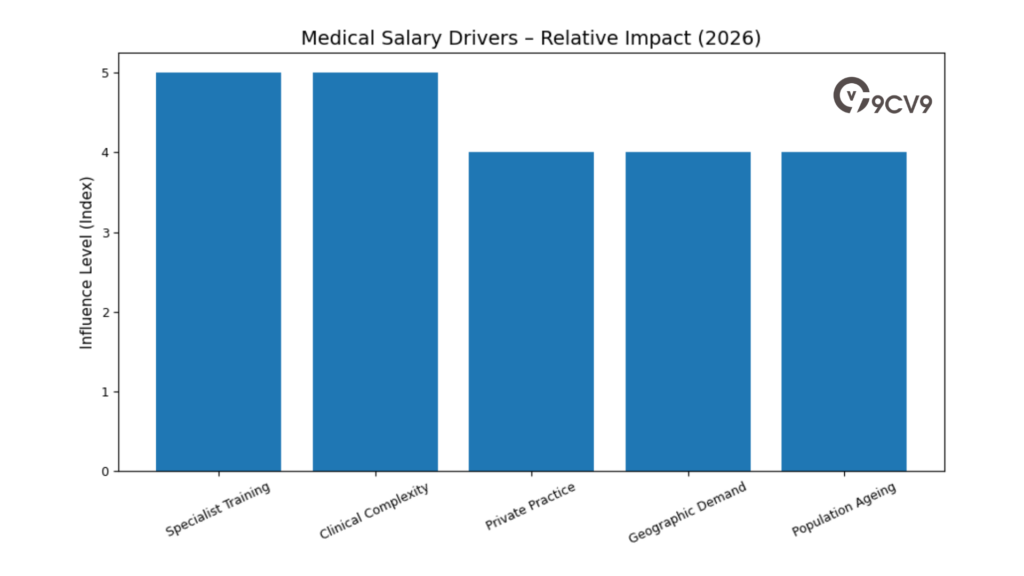
Medical Specialties at the Top of the Income Distribution
Medical specialists remain at the highest end of the salary scale in Australia for 2026. Neurosurgeons, cardiothoracic surgeons, and orthopaedic surgeons command some of the largest base salaries in the country. These roles involve:
• Extensive post-graduate training
• High technical precision
• Legal and professional accountability
• Significant patient risk management
• Scarcity of qualified practitioners
The combination of skill scarcity and critical service demand supports consistently high compensation levels. Private practice arrangements can further increase total earnings depending on patient volume and procedural complexity.
Medical Salary Drivers Matrix
| Salary Driver | Impact on Earnings Level |
|---|---|
| Length of Specialist Training | Very High |
| Clinical Complexity | Very High |
| Private Practice Participation | High |
| Geographic Demand | Moderate to High |
| Population Ageing | High |
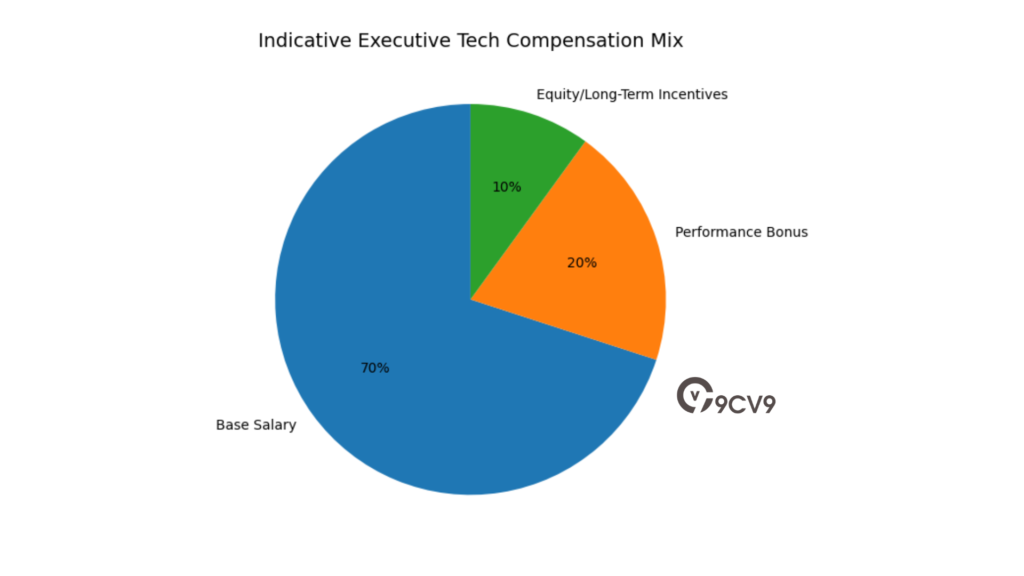
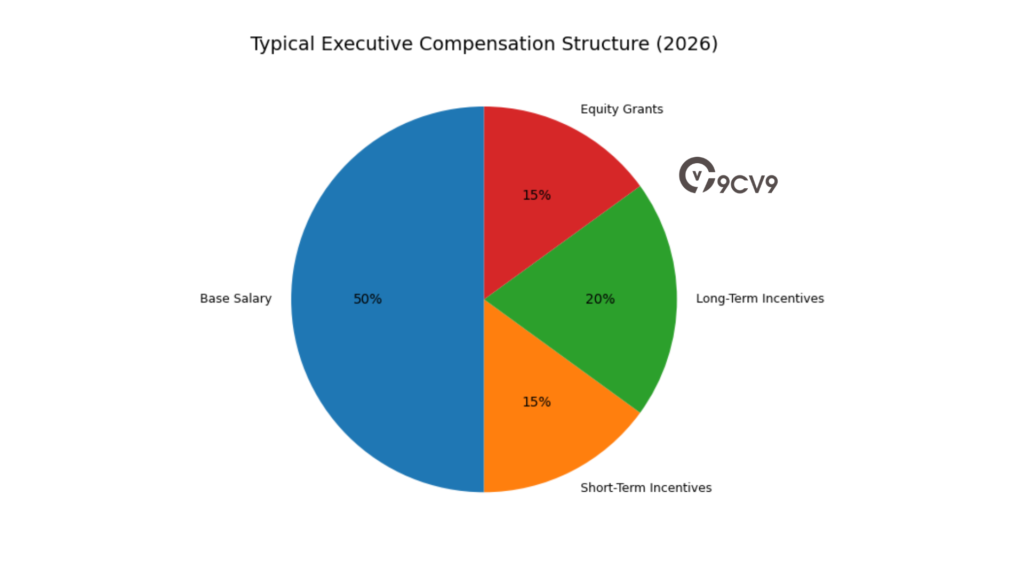
Corporate and Executive Compensation
While medical specialists dominate base salary rankings, corporate executives often surpass them in total remuneration when equity and performance incentives are included.
Chief Executive Officers and Chief Strategy Officers, particularly within large listed entities, may receive performance-based share allocations and long-term incentive plans that push annual total compensation well beyond one million dollars.
Executive Compensation Structure Overview
| Compensation Component | Typical Executive Inclusion | Earnings Impact |
|---|---|---|
| Base Salary | Yes | High |
| Short-Term Incentives | Yes | Moderate |
| Long-Term Incentives | Yes | Very High |
| Equity or Share Grants | Often | Very High |
| Performance Bonuses | Yes | Moderate |
This performance-linked structure means that while base salary may appear lower than certain medical roles, total annual compensation can exceed medical earnings in strong financial years.
Technology and Infrastructure Leadership
Technology and infrastructure executives also feature prominently among Australia’s highest earners in 2026. IT Directors, Chief Information Officers, Enterprise Architects, and Chief Information Security Officers are benefiting from digital transformation, cybersecurity risk, and artificial intelligence investment across industries.
Mining site managers and construction project directors similarly command high pay due to capital intensity, operational complexity, and remote workforce leadership.
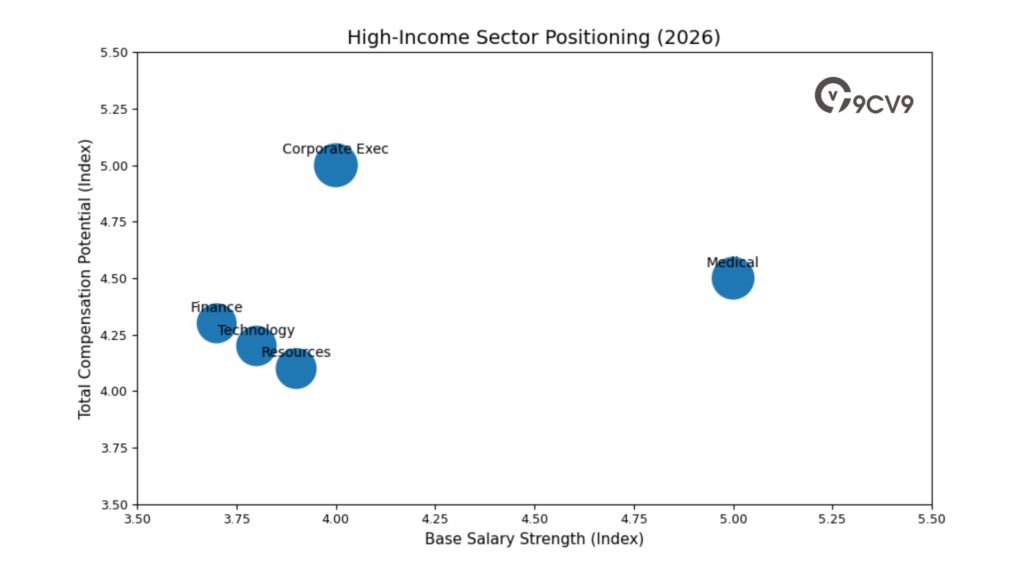
High-Earning Role Category Comparison
| Sector Category | Earnings Position | Compensation Structure Characteristics |
|---|---|---|
| Medical Specialists | Highest Base Pay | Primarily salary plus private billing |
| Corporate Executives | Highest Total Pay | Significant performance and equity components |
| Technology Leadership | Premium Tier | Salary plus strategic transformation bonuses |
| Resources Management | Premium Tier | Salary plus allowances and site incentives |
| Finance and Banking | High | Base plus deal-driven bonuses |
Qualification Barriers and Income Concentration
The common factor across nearly all top-earning roles is the presence of substantial qualification barriers. These include:
• Medical fellowships and specialist accreditation
• Executive leadership track records
• Advanced financial or legal certification
• Technical architecture or cybersecurity expertise
• Large-scale operational accountability
This concentration of high earnings among highly qualified professionals reinforces a broader structural trend in Australia’s 2026 salary landscape: income growth is strongest in roles requiring advanced education, technical expertise, and strategic responsibility.
Conclusion: Australia’s Top Salary Landscape in 2026
The highest paying jobs in Australia for 2026 are concentrated in medical specialisation, corporate executive leadership, high-level finance, technology transformation, and large-scale resource management.
Medical specialists dominate the top of the base salary spectrum due to long training pathways and clinical scarcity. Corporate leaders, particularly in publicly listed companies, may exceed those figures when performance shares and long-term incentives are included.
For professionals assessing long-term earning potential, advanced qualifications, leadership capability, and strategic responsibility remain the strongest drivers of entry into Australia’s highest income brackets.
5. Regional and Metropolitan Salary Comparisons
Geographic Influence on Salary Levels
A complete guide to salaries in Australia for 2026 must account for geography as a major determinant of earning potential. Location continues to shape income outcomes due to industry concentration, government presence, resource activity, and corporate headquarters distribution.
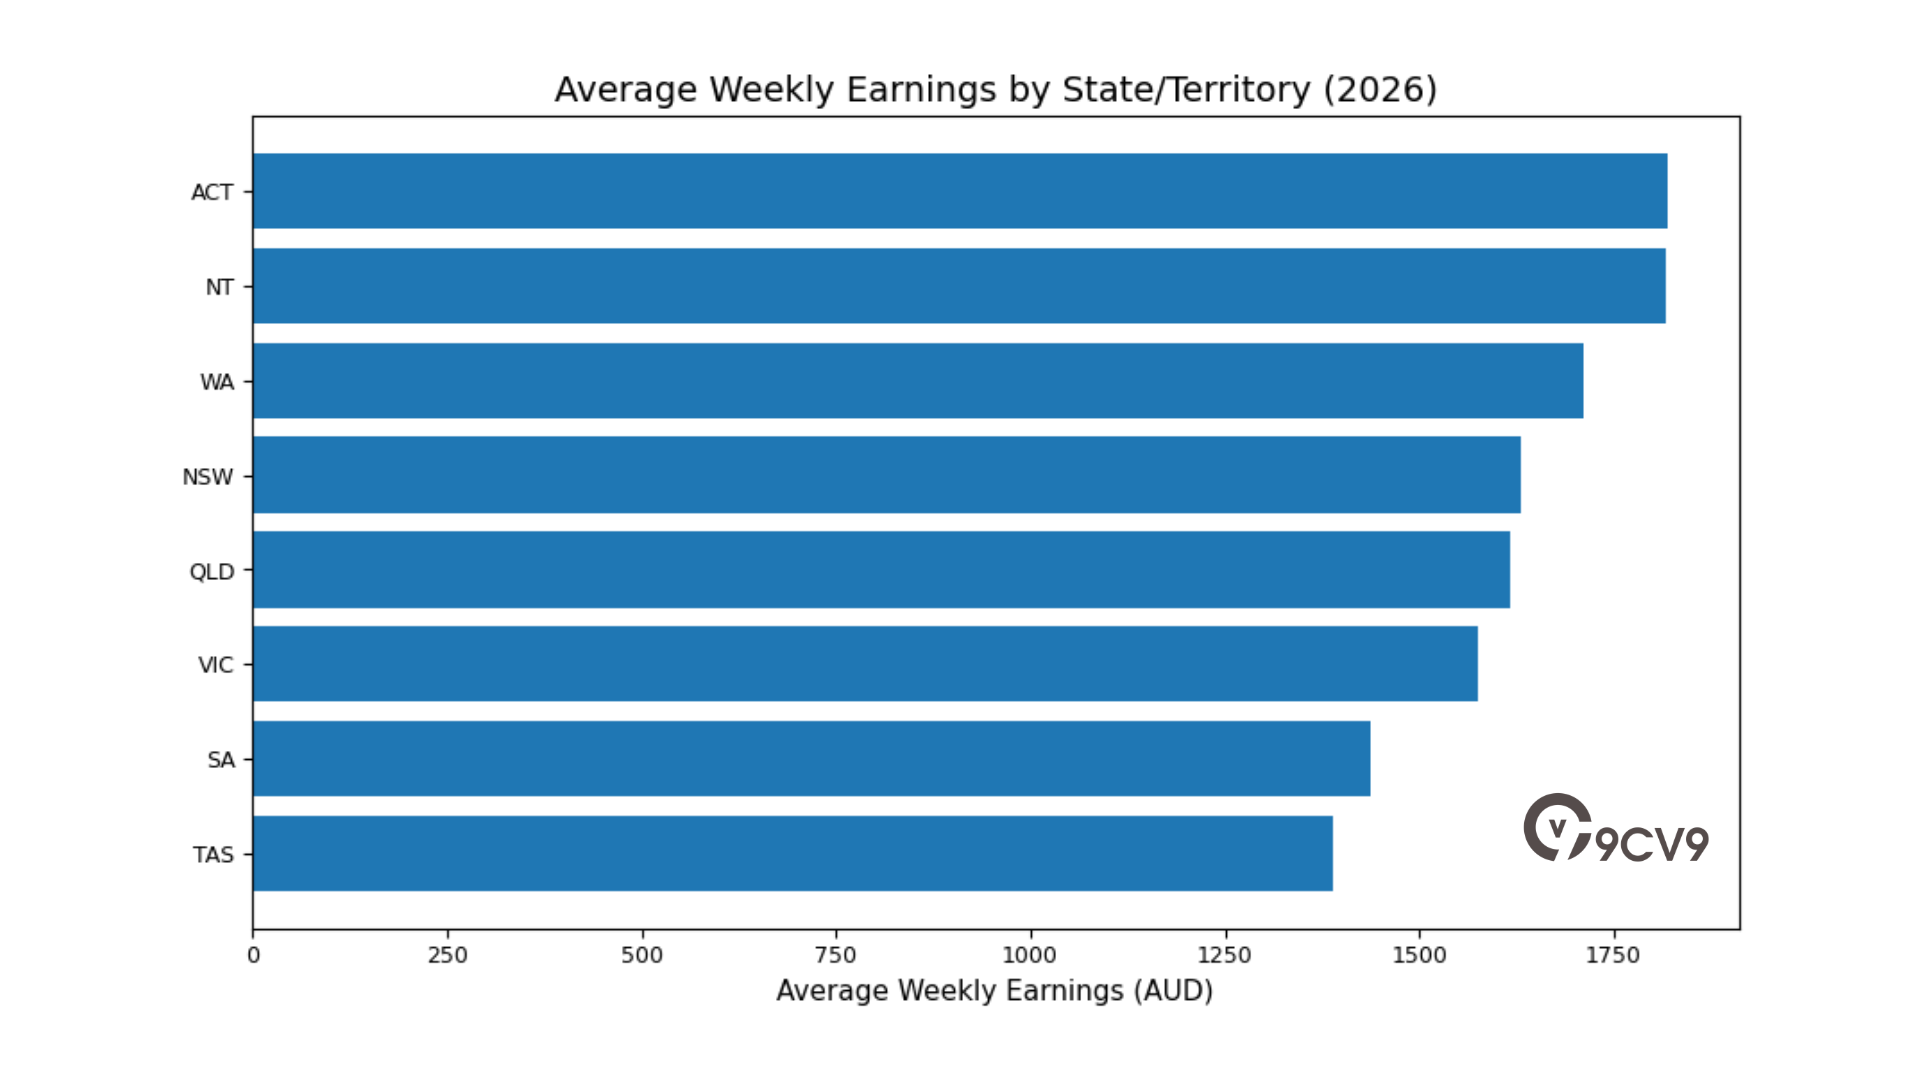
The 2026 data shows that the Australian Capital Territory leads the country in average weekly earnings, closely followed by the Northern Territory and Western Australia. Together, these jurisdictions form a high-income corridor driven by public administration, defence infrastructure, and large-scale resource extraction.
Average Weekly Total Cash Earnings by State and Territory
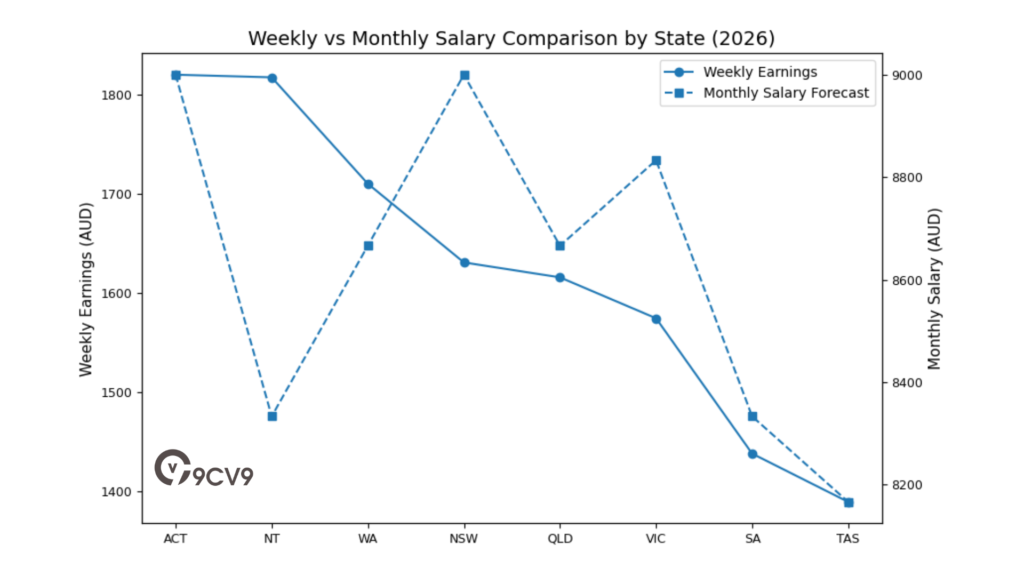
| State / Territory | Average Weekly Total Cash Earnings (AUD) | Average Monthly Salary Forecast (AUD) | Primary Regional Drivers |
|---|---|---|---|
| Australian Capital Territory | 1,820.50 | 9,000 | Public service, policy leadership |
| Northern Territory | 1,817.80 | 8,333 | Defence, gas, remote operations |
| Western Australia | 1,710.40 | 8,666 | Iron ore, gold, mining |
| New South Wales | 1,630.90 | 9,000 | Banking, corporate headquarters |
| Queensland | 1,615.80 | 8,666 | Resources, tourism |
| Victoria | 1,574.50 | 8,833 | Technology, education, healthcare |
| South Australia | 1,437.80 | 8,333 | Defence, manufacturing |
| Tasmania | 1,389.00 | 8,166 | Agribusiness, tourism |

High-Income Jurisdictions and Their Drivers
The Australian Capital Territory records the highest average weekly earnings. This reflects the concentration of federal public service roles, policy advisors, regulatory agencies, and senior administrative positions. Government employment in Canberra tends to provide stable, full-time roles with consistent pay bands, resulting in strong median earnings across the general workforce.
The Northern Territory’s high income levels are driven by defence operations, gas extraction, and remote industrial projects. These roles often include allowances for regional deployment and specialised skill premiums.
Western Australia remains strongly influenced by the mining sector. Iron ore and gold production, combined with fly-in fly-out employment arrangements, sustain higher-than-average earnings.
Metropolitan Salary Comparison: Sydney and Canberra
Sydney continues to report the highest nominal monthly salaries for professionals, averaging around 9,000 dollars per month in key corporate and finance roles. The concentration of banking institutions, multinational headquarters, and capital markets activity supports strong professional compensation.
However, Canberra records the highest median annual salary for the general workforce at approximately 83,200 dollars per year. This reflects the consistent pay structures within public administration, compared with Sydney’s mix of very high corporate salaries and lower-paying service roles.
Metropolitan Salary Structure Comparison
| City | Nominal Monthly Salary (Professional Roles) | Median Workforce Earnings Level | Structural Characteristics |
|---|---|---|---|
| Sydney | 9,000 AUD | Mixed distribution | Financial hub with high executive and service variance |
| Canberra | High median equivalent | 83,200 AUD annual median | Strong public service baseline |
| Perth | High in resource roles | Above national average | Mining and energy concentration |
| Melbourne | Competitive in tech and education | Near national average | Diversified service economy |
Cost of Living and Housing Pressure
While nominal salary figures are higher in major cities, the real value of income is increasingly affected by housing affordability and rental stress. By early 2026, renters in major metropolitan hubs are spending an average of 33.4 percent of their income on rent.
Over a five-year period, national rents have risen approximately 2.5 times faster than wage growth. This disparity has reduced disposable income in high-paying cities and has influenced relocation patterns.
Income and Housing Pressure Matrix
| Indicator | 2026 Situation | Economic Impact |
|---|---|---|
| Average Rent-to-Income Ratio | 33.4% | Reduced household savings capacity |
| Rent Growth vs Wage Growth | 2.5 times faster | Erosion of real income gains |
| Metropolitan Housing Demand | High | Sustained upward rental pressure |
| Regional Housing Costs | Lower relative baseline | Increased migration interest |
The Rise of Regional Employment Demand
As housing stress intensifies in major cities, regional centres are experiencing renewed interest from both workers and employers. Cities such as Geelong, Ballarat, and Bendigo are attracting moderate population growth due to more affordable housing and lower operating costs for businesses.
This emerging regional demand trend is contributing to a gradual redistribution of employment opportunities outside traditional metropolitan hubs. While salaries in regional areas may be slightly lower in nominal terms, reduced living costs can result in stronger real income retention.
Regional Growth Comparison
| Regional City | Demand Trend | Cost Structure Advantage | Employment Growth Outlook |
|---|---|---|---|
| Geelong | Increasing | Lower housing costs | Moderate |
| Ballarat | Steady growth | Affordable residential | Moderate |
| Bendigo | Rising interest | Lower commercial rents | Gradual expansion |
Salary Outlook by Location in 2026
The 2026 Australian salary landscape demonstrates that geographic location remains a decisive factor in earning potential. Territories with strong public service, defence, or resource concentration offer higher baseline earnings. Metropolitan financial hubs provide premium salaries for corporate professionals, while regional centres offer improved cost efficiency and lifestyle advantages.
However, when evaluating salary competitiveness, professionals must consider both nominal pay and real purchasing power. Housing costs, rental stress, and cost-of-living pressures are reshaping how Australians assess job offers and relocation opportunities.
Conclusion: Geography as a Core Salary Driver
Regional and metropolitan salary comparisons in Australia for 2026 reveal a complex interplay between industry concentration, government presence, resource activity, and housing affordability. High-income jurisdictions such as the Australian Capital Territory, Northern Territory, and Western Australia continue to outperform national averages.
Sydney leads in nominal corporate pay, while Canberra provides a strong median salary foundation. At the same time, rising housing costs are accelerating interest in regional centres, creating a more geographically distributed employment market.
For employers, policymakers, and professionals, understanding these regional dynamics is essential when benchmarking salaries and evaluating workforce strategy in Australia for 2026.
6. The Impact of Seniority and Experience
Experience as a Primary Salary Multiplier
A complete guide to salaries in Australia for 2026 must recognise that years of experience remain one of the strongest predictors of income growth. While industry and geography influence pay levels, seniority often determines how far an individual progresses within a salary band.
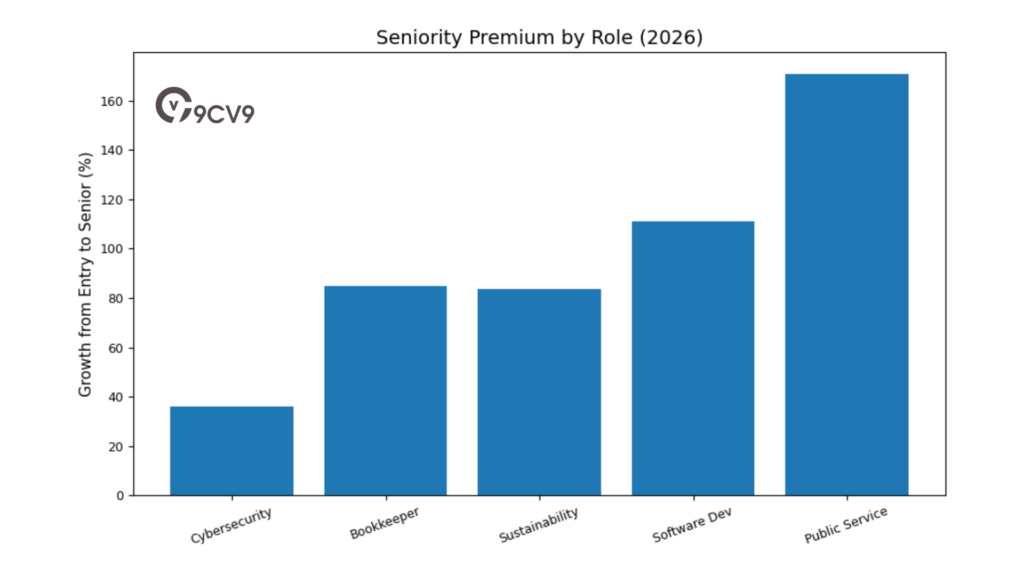
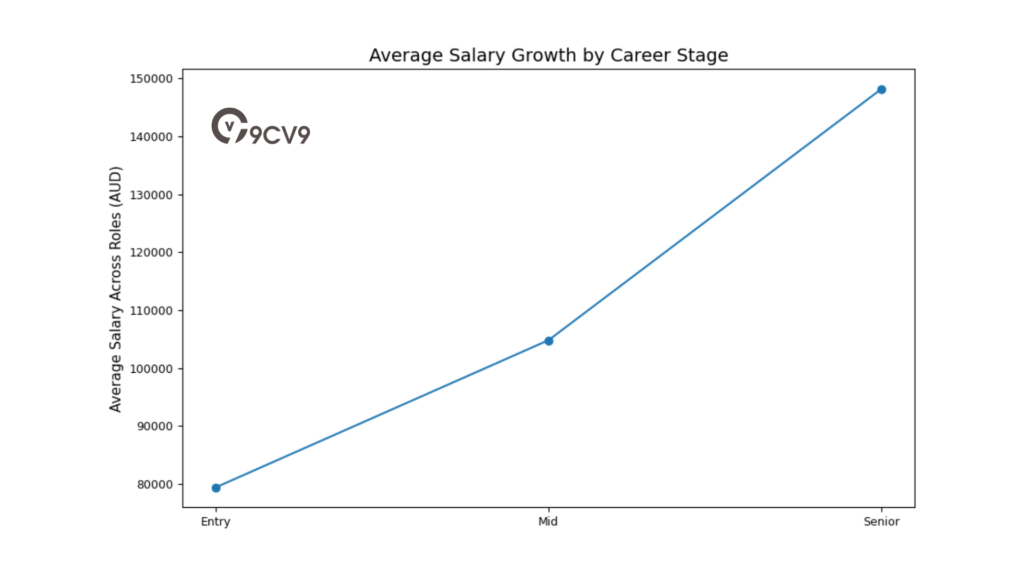
The relationship between experience and earnings is most pronounced in technical, managerial, and specialist roles. In 2026, professionals with eight or more years of experience regularly earn between 32 percent and 86 percent more than early-career counterparts in highly specialised roles such as sustainability management, cybersecurity, and enterprise technology leadership.
This salary progression reflects accumulated expertise, leadership responsibility, and the ability to deliver measurable organisational impact.
Salary Variation by Seniority Level in Finance and IT
The following table outlines salary benchmarks across selected roles in 2026, demonstrating how earnings increase with experience.
Salary Comparison by Career Stage
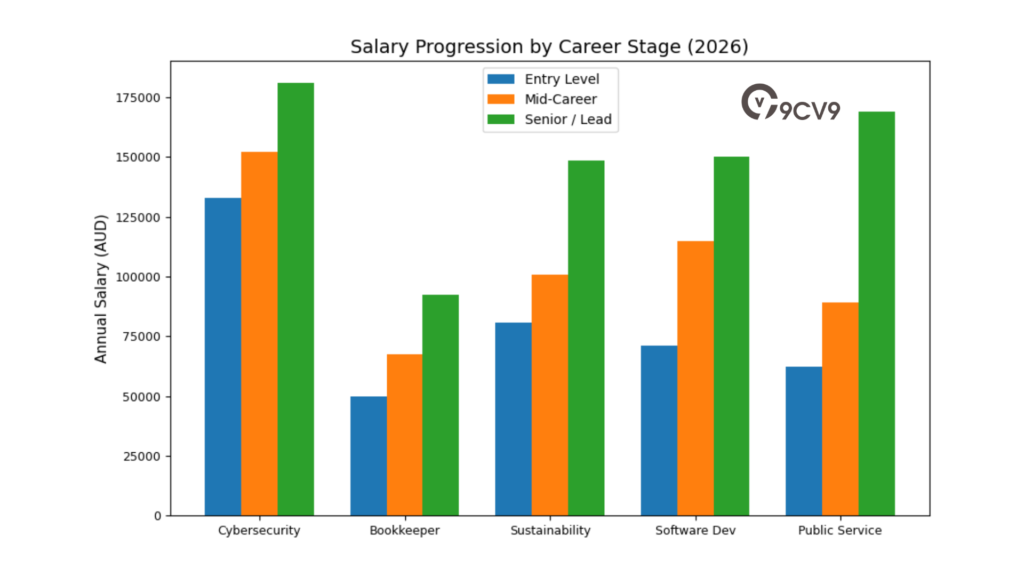
| Role Category | Entry Level (0–3 Years) | Mid-Career (5–10 Years) | Senior / Lead (10+ Years) |
|---|---|---|---|
| Cybersecurity Specialist | 133,000 AUD | 152,000 AUD | 181,000 AUD |
| Bookkeeper | 50,000 AUD | 60,000 – 75,000 AUD | 75,000 – 110,000 AUD |
| Sustainability Manager | 80,837 AUD | 100,578 AUD | 140,110 – 157,000 AUD |
| Software Programmer | 71,000 AUD | 114,828 AUD | 150,000+ AUD |
| Public Service (APS / EL) | 62,260 AUD (APS1) | 89,204 AUD (APS4) | 168,764 AUD (EL2) |
This data highlights several structural trends in the Australian salary market for 2026.
Technical Specialisation and Accelerated Growth
In cybersecurity and software development, mid-career professionals experience substantial salary jumps as they move from execution-focused roles into architecture, leadership, or advisory functions. Senior cybersecurity specialists, for example, command significantly higher salaries due to increasing cyber risk exposure across government and private sectors.
Similarly, sustainability managers are experiencing rapid income growth as organisations prioritise environmental reporting, carbon reduction strategies, and regulatory compliance. Senior professionals in this field may earn nearly double the entry-level salary, reflecting growing demand for ESG expertise.
Seniority-Based Salary Growth Matrix
| Career Phase | Typical Responsibility Level | Income Growth Pattern | Promotion Criteria |
|---|---|---|---|
| Entry Level | Task execution and support | Foundational salary band | Technical competence |
| Mid-Career | Independent delivery and oversight | Noticeable salary expansion | Project ownership and expertise |
| Senior / Lead | Strategic direction and mentoring | Highest salary premium | Leadership and business impact |
Public Sector Experience Progression
The public sector also demonstrates clear salary progression tied to structured classification systems. Employees within the Australian Public Service move from entry-level bands such as APS1 into executive levels such as EL2 over time. Each progression reflects expanded policy responsibility, budget management, and stakeholder engagement.
This structured system ensures predictable income growth aligned with tenure and leadership scope.
Educational Qualifications and Income Impact
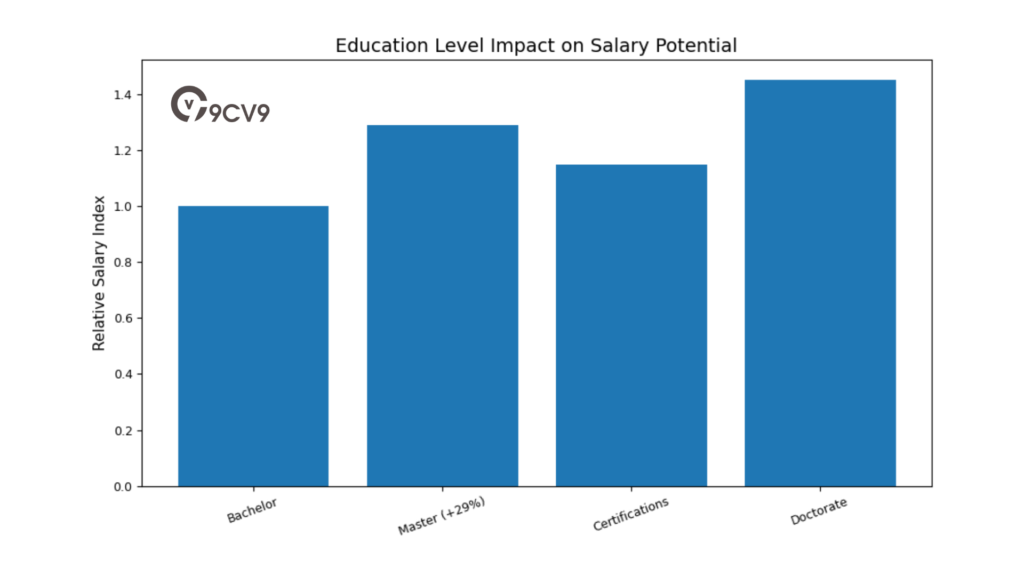
Formal education continues to play a significant role in salary advancement. In many professional services roles, holding a Master’s degree can increase salary potential by approximately 29 percent compared to a Bachelor’s degree alone.
Qualification Impact on Salary Potential
| Education Level | Relative Salary Position | Market Perception |
|---|---|---|
| Bachelor’s Degree | Baseline Professional | Standard qualification requirement |
| Master’s Degree | +29% Increment Potential | Advanced expertise and specialisation |
| Professional Certifications | Additional uplift | Role-specific competency validation |
| Doctorate or Specialist Fellowship | Premium Tier | Niche technical authority |
Advanced qualifications often support faster progression into senior roles, particularly in finance, engineering, sustainability, healthcare, and technology.
The Growing Value of Human Skills
Despite rapid digital transformation and artificial intelligence adoption, human-centric capabilities remain critical to salary growth in 2026. Research indicates that 84 percent of organisations report shortages in employees who can manage complex interpersonal dynamics, lead strategic initiatives, and make high-level decisions.
These capabilities include:
• Strategic thinking
• Negotiation and stakeholder management
• Ethical leadership
• Change management
• Cross-functional communication
Human Skills Demand Matrix
| Skill Category | Market Demand Level | Salary Influence Level |
|---|---|---|
| Strategic Decision-Making | Very High | Strong |
| Complex Stakeholder Management | High | Moderate to Strong |
| Emotional Intelligence | High | Moderate |
| Technical Automation Skills | High | Strong |
| Routine Task Execution | Stable | Limited |
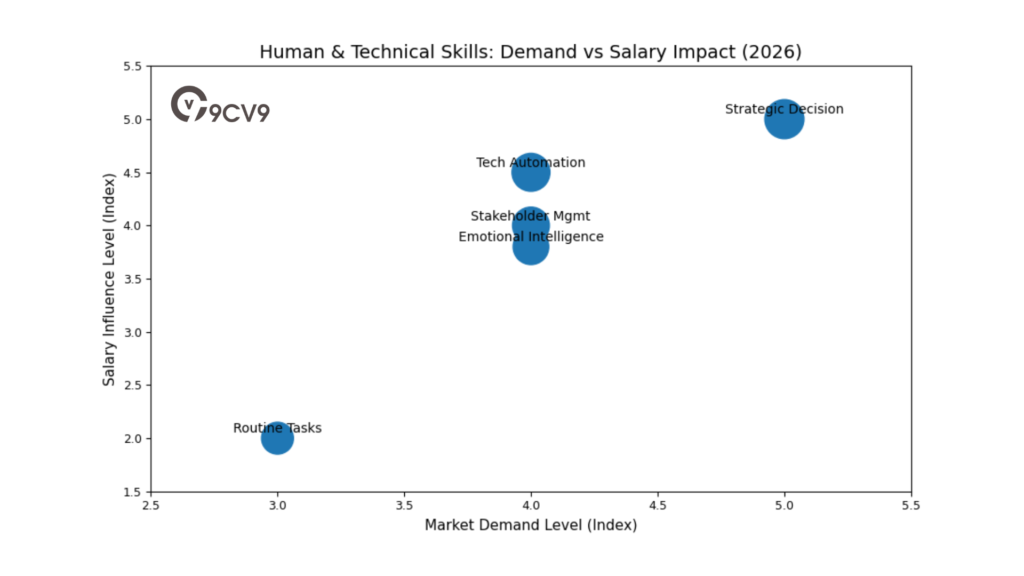
Professionals who combine technical expertise with advanced human skills often experience the highest salary acceleration. Senior roles increasingly require the ability to manage transformation, guide teams, and align technology with business strategy.
Two-Speed Career Earnings Pattern
In 2026, Australia’s salary landscape demonstrates a two-speed progression model:
• Professionals in high-demand technical fields experience steep salary growth as experience accumulates.
• Routine or administrative roles show slower salary progression unless combined with additional qualifications or leadership responsibilities.
This reinforces the importance of continuous upskilling and career planning for long-term earning potential.
Conclusion: Experience as a Core Income Driver in 2026
Seniority and experience remain central to salary growth in Australia for 2026. Technical expertise, leadership capability, and advanced education significantly increase earning potential across finance, IT, sustainability, and public administration.
The salary premium for experienced professionals can exceed 80 percent in specialised fields, demonstrating the long-term financial return on skill development and career progression. At the same time, human skills continue to differentiate top earners in an increasingly automated and AI-supported economy.
For professionals seeking sustained income growth, combining advanced qualifications, strategic leadership ability, and specialised technical expertise remains the most reliable pathway within Australia’s evolving salary landscape.
7. Graduate Salaries and Early Career Entry Points
Early Career Salary Trends in a Competitive Talent Market
A complete guide to salaries in Australia for 2026 must include a close review of graduate and early career compensation. The 2026–2027 graduate market reflects a strategic shift by employers toward long-term leadership development and early talent retention.
High-tier graduate programs, particularly in mining, consulting, engineering, and technology, have increased starting salaries in response to competition for high-performing university graduates. While broader wage growth across the economy has moderated, graduate compensation in priority sectors has remained strong.
Organisations are investing in structured development programs, relocation assistance, and performance incentives to secure future leaders in technical and commercial disciplines.
Graduate Salary Benchmarks by Degree and Industry Sector
The following table provides a structured overview of graduate salary ranges by sector and qualification type for 2026–2027.
Graduate Salary Benchmark Table
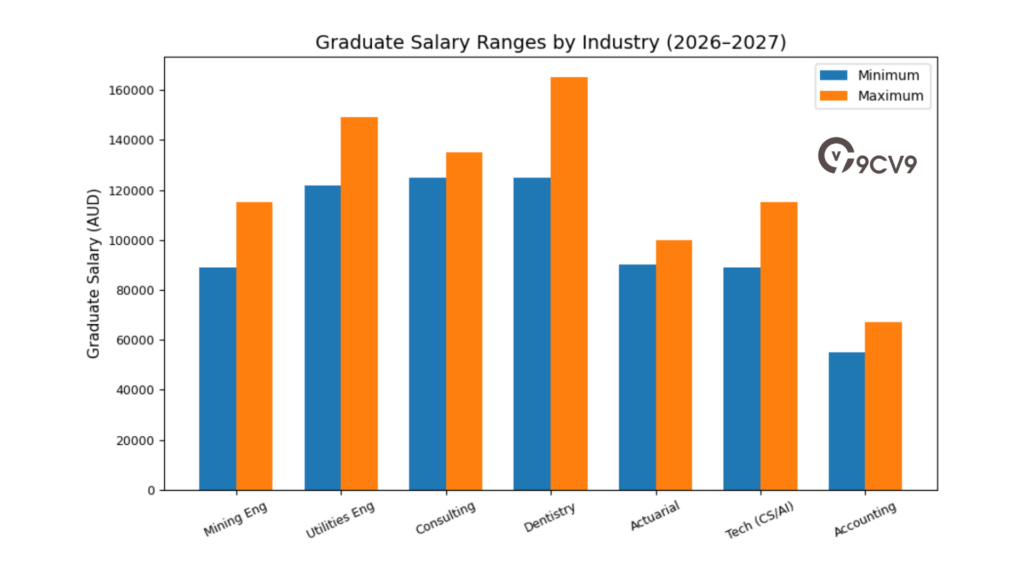
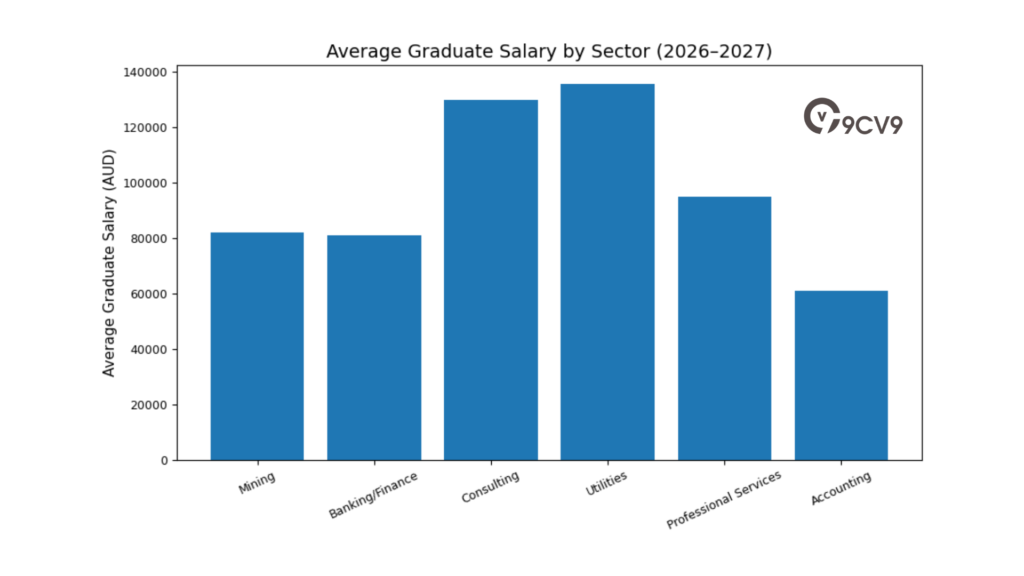
| Industry Sector | Degree Type | Average Graduate Salary (AUD) | Notable Employer Offer Range |
|---|---|---|---|
| Mining & Resources | Mining Engineering | 115,000 + Bonus | 89,000 – 115,000 |
| Engineering (Utilities) | Electrical / Power | 122,000 – 149,000 | 122,000 – 149,000 |
| Management Consulting | Business / Commerce | 125,000 – 135,000 | 125,000 – 135,000 |
| Health Sciences | Dentistry | 125,000 – 165,000 | National average range |
| Professional Services | Actuarial Science | 90,000 – 100,000 | 90,000 – 100,000 |
| Technology | Computer Science / AI | 89,000 – 115,000 | 89,000 – 115,000 |
| Accounting | Accounting / Audit | 55,000 – 67,000 | National average range |
Sector-Based Graduate Salary Comparison
Mining, oil, and gas remain among the highest-paying graduate destinations in Australia for 2026–2027, with average salaries around 82,135 dollars across broader industry entry roles. Banking and financial services follow closely, with graduate averages near 80,874 dollars.
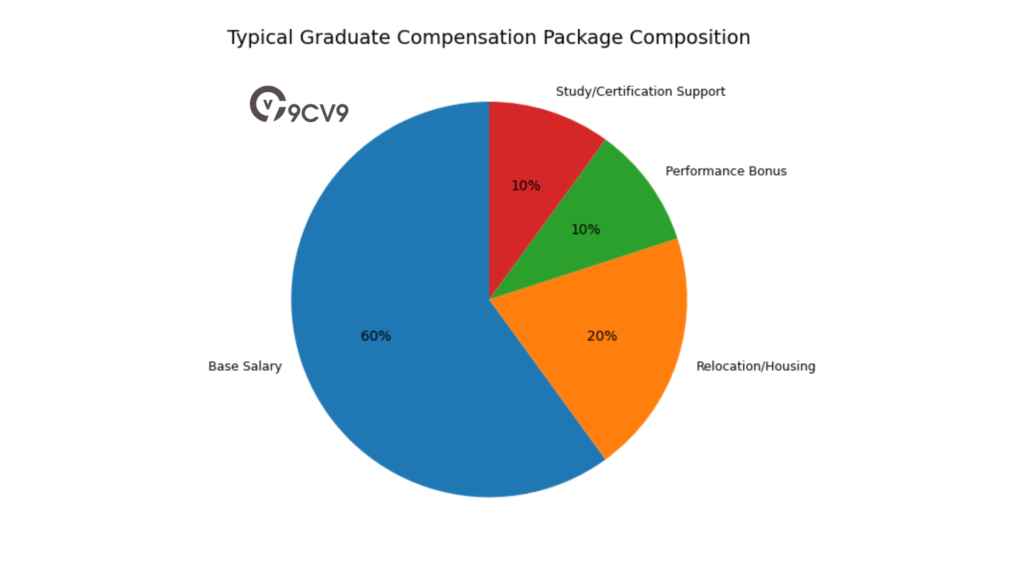
It is important to note that these figures typically exclude superannuation contributions. In many cases, packages also include relocation allowances, housing subsidies, or travel support when positions are based in regional or remote hubs.
Graduate Sector Earnings Matrix
| Sector Category | Average Graduate Salary (AUD) | Additional Benefits Included | Long-Term Earnings Potential |
|---|---|---|---|
| Mining & Resources | 82,135+ | Relocation, housing, bonuses | Very High |
| Banking & Finance | 80,874 | Performance incentives | High |
| Consulting | 125,000 – 135,000 | Structured promotion pathways | Very High |
| Utilities & Engineering | 122,000 – 149,000 | Infrastructure allowances | High |
| Professional Services | 90,000 – 100,000 | Study support and certification | High |
| Accounting & Audit | 55,000 – 67,000 | Certification sponsorship | Moderate |
Why Graduate Salaries Vary by Sector
Graduate pay levels are closely linked to:
• Capital intensity of the industry
• Technical skill scarcity
• Revenue generation capacity
• Geographic location
• Long-term workforce planning needs
Mining and utilities offer higher starting salaries because of technical complexity, regional deployment, and strong profit margins. Consulting firms provide high graduate packages due to intense workload expectations and accelerated leadership pipelines.
Technology roles, particularly in artificial intelligence and data science, continue to attract competitive starting pay due to digital transformation priorities across the economy.
Qualification Impact on Entry-Level Earnings
Certain degrees consistently produce higher starting salaries. Engineering, dentistry, actuarial science, and computer science graduates command above-average compensation due to professional accreditation requirements and skill scarcity.
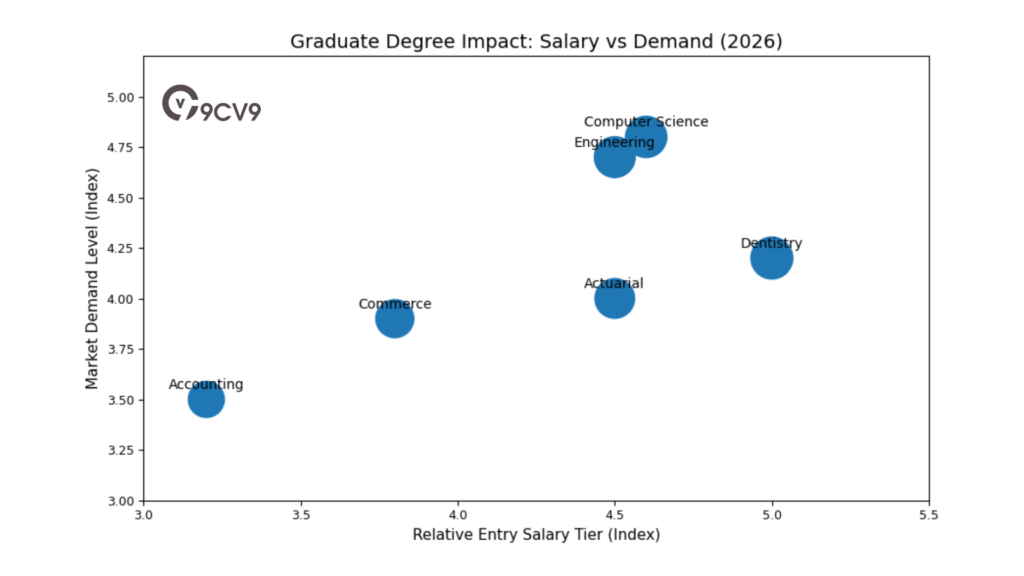
Graduate Degree Impact Matrix
| Degree Category | Entry-Level Salary Tier | Market Demand Level | Progression Speed |
|---|---|---|---|
| Engineering | High | Strong | Rapid |
| Dentistry | Very High | Consistent | Stable Growth |
| Actuarial Science | High | Limited Supply | Strong |
| Computer Science / AI | High | Very Strong | Rapid |
| Commerce / Business | Moderate to High | Competitive | Performance-Based |
| Accounting | Moderate | Stable | Certification-Driven |
Regional and Relocation Considerations
Many high-paying graduate roles are located outside major metropolitan centres. Mining and energy projects often operate in regional Western Australia, Queensland, or the Northern Territory. As a result, graduate packages frequently include:
• Relocation assistance
• Regional housing allowances
• Travel allowances for rotational work
• Performance bonuses
These additional benefits can significantly increase the total value of entry-level packages beyond the stated base salary.
Strategic Investment in Future Leadership
The 2026–2027 graduate market reflects an employer strategy focused on leadership succession and long-term workforce stability. Companies in resources, consulting, utilities, and technology are viewing graduate hiring as an investment in future senior management.
High starting salaries are not only designed to attract top talent but also to reduce early attrition and build structured career pathways.
Conclusion: Graduate Salary Outlook for 2026–2027
Graduate salaries in Australia for 2026 remain competitive, particularly in capital-intensive and high-skill industries. Mining, utilities, consulting, finance, and advanced technology fields continue to offer the strongest starting packages.
While accounting and general business roles begin at lower salary levels, structured progression pathways can lead to significant income growth over time. For graduates evaluating career pathways, industry choice, degree specialisation, and geographic flexibility remain key determinants of earning potential in the evolving Australian salary landscape.
8. The Evolving Benefit Landscape and Salary Packaging
a. Strategic Salary Packaging Opportunities (2026)
Shift from Salary Growth to Total Reward Strategy
A complete guide to salaries in Australia for 2026 must recognise that compensation is no longer defined by base pay alone. With national wage growth cooling toward approximately 3.0 percent, employers are increasingly relying on non-monetary benefits and tax-effective salary packaging to remain competitive in talent attraction and retention.
In 2026, total reward strategies are becoming more important than annual pay rises. Flexible working arrangements, performance-based incentives, and tax optimisation structures are now central components of employee value propositions.
Workplace Flexibility as a Core Retention Lever
Flexible work arrangements have emerged as the most valued benefit in the current labour market. Approximately 58 percent of employees rank flexibility above other perks, including bonuses and health benefits.
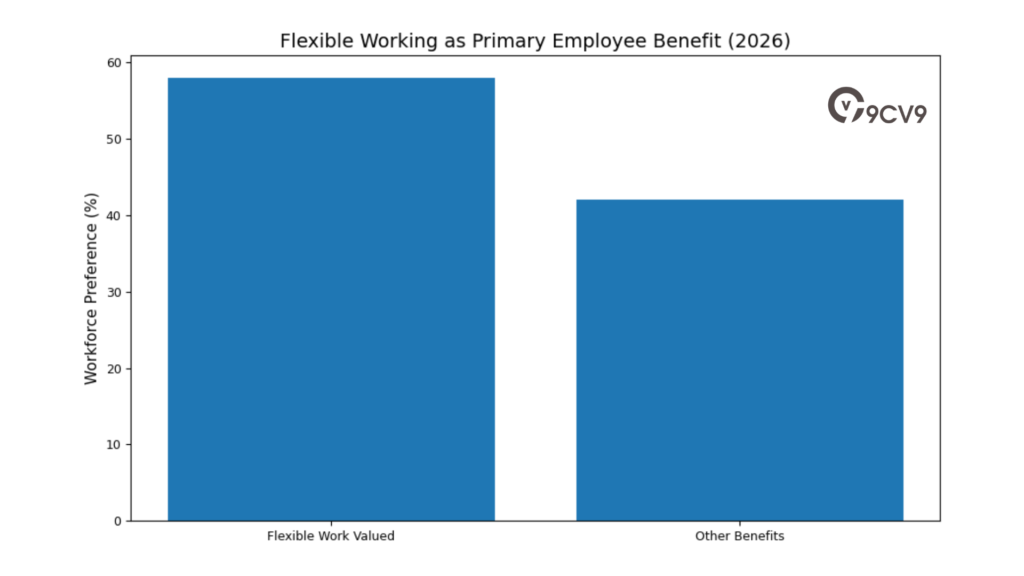
At the same time, workforce mobility remains high. Around 61 percent of employees indicate they are considering changing jobs within the next 12 months. Nearly half of these individuals cite lack of career progression or limited flexibility as the primary reason for dissatisfaction.
Employee Retention Drivers in 2026
| Retention Factor | Workforce Response Level | Strategic Importance for Employers |
|---|---|---|
| Flexible Working Arrangements | Very High (58%) | Critical |
| Career Progression Opportunities | High (45% cite absence) | High |
| Competitive Base Salary | Moderate | Essential baseline |
| Performance Incentives | Increasing relevance | Strategic |
| Non-Monetary Benefits | Growing importance | Differentiator |
Flexible work includes hybrid arrangements, remote work options, flexible hours, and compressed workweeks. These arrangements often provide perceived value equivalent to salary increases without permanently raising fixed payroll costs.
Strategic Salary Packaging Opportunities in 2026
Salary packaging has become a powerful tool for enhancing take-home pay without increasing employer salary budgets. Tax-efficient arrangements allow employees to allocate pre-tax income toward approved expenses, reducing taxable income and increasing net earnings.
Remote Area Benefits
Employees residing in designated remote regions approved by taxation authorities can package up to 50 percent of eligible rent or mortgage interest. This benefit is particularly relevant in resource-driven regional hubs.
For example, an individual earning 73,000 dollars annually may increase their take-home pay by approximately 5,174 dollars per year through rental packaging arrangements.
Remote Area Salary Packaging Overview
| Benefit Type | Eligibility Criteria | Financial Impact Example |
|---|---|---|
| Rent Packaging | Designated remote locations | Significant annual tax savings |
| Mortgage Interest Packaging | Eligible regional areas | Increased net disposable income |
| Combined Remote Allowances | Remote employment residency | Improved retention in regional roles |
These arrangements are especially important in mining, defence, and infrastructure sectors where regional workforce participation is high.
Novated Leasing and Electric Vehicles
Novated leasing remains a popular tax optimisation mechanism, particularly for mid- to high-income earners. In 2026, the growing adoption of electric vehicles has strengthened the attractiveness of novated lease arrangements.
Electric vehicles benefit from favourable leasing frameworks and certain tax concessions, making them cost-effective options for employees seeking to reduce taxable income while accessing new vehicle technology.
Novated Leasing Structure Benefits
| Component | Financial Benefit | 2026 Relevance |
|---|---|---|
| Pre-Tax Salary Deductions | Reduces taxable income | Strong |
| Electric Vehicle Incentives | Cost-efficient leasing structures | Increasing demand |
| Employer Cost Neutrality | No direct payroll increase | Attractive for organisations |
| Employee Cash Flow Management | Predictable monthly budgeting | High appeal |
Short-Term Incentives and Performance Bonuses
As base salary growth moderates, employers are increasingly using short-term incentives and performance bonuses to enhance employee compensation. These incentives allow organisations to reward productivity and results without permanently increasing fixed salary baselines.
Short-term incentives are particularly common in finance, corporate leadership, technology, and consulting sectors.
Short-Term Incentive Strategy Matrix
| Incentive Type | Employer Advantage | Employee Benefit |
|---|---|---|
| Annual Performance Bonus | Variable cost structure | Higher potential take-home pay |
| Project-Based Incentives | Aligns pay with outcomes | Recognition of contribution |
| Profit-Sharing Arrangements | Links rewards to company success | Shared financial upside |
| Sales Commissions | Direct performance linkage | Income scalability |
This approach enables organisations to maintain budget flexibility while still providing competitive compensation packages.
Not-for-Profit Sector Salary Packaging
Employees working in the not-for-profit sector benefit from specialised salary packaging arrangements. Eligible employees can package everyday expenses such as groceries, utilities, and other living costs up to a capped threshold.
This effectively increases take-home pay without raising the employer’s wage bill. The arrangement makes NFP roles more competitive despite lower base salary structures compared to corporate sectors.
NFP Salary Packaging Overview
| Benefit Category | Packaging Scope | Outcome for Employee |
|---|---|---|
| Everyday Living Expenses | Groceries, utilities, general costs | Increased disposable income |
| Capped Tax-Effective Threshold | Pre-determined annual limit | Maximised net pay efficiency |
| Employer Cost Impact | Neutral | Enhanced retention capability |
Total Reward Evolution in 2026
The Australian compensation landscape in 2026 is defined by a transition from salary-focused negotiation to holistic reward optimisation. Employees increasingly evaluate job offers based on flexibility, career development, tax benefits, and incentive opportunities.
Total Compensation Value Framework
| Reward Component | 2026 Strategic Weighting |
|---|---|
| Base Salary | Foundational |
| Flexible Work | Highly Prioritised |
| Tax-Effective Packaging | Increasingly Important |
| Performance Incentives | Strategic |
| Career Development | Retention-Critical |
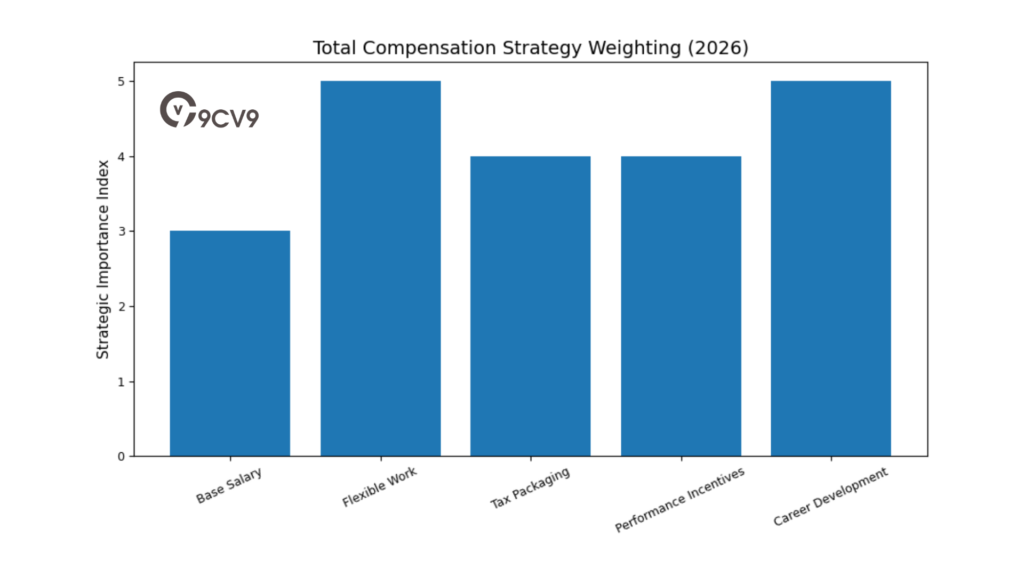
Conclusion: Beyond Base Salary in 2026
With wage growth stabilising around 3 percent, employers across Australia are rebalancing compensation strategies toward benefits, flexibility, and tax-efficient arrangements. Flexible work remains the most valued non-monetary benefit, while salary packaging and short-term incentives offer practical ways to increase take-home pay without inflating fixed payroll budgets.
For employees, understanding salary packaging options and incentive structures is essential to maximising real income. For employers, adopting a comprehensive total reward strategy is increasingly critical to attracting and retaining talent in a competitive but stabilising labour market.
9. Regulatory Governance and Minimum Wage Standards
Overview of the 2026 Wage Regulation Framework
A complete guide to salaries in Australia for 2026 must consider the regulatory framework that shapes minimum pay, superannuation obligations, and employment protections. Wage growth across the private and public sectors operates within legal parameters set by national workplace authorities.
In 2026, the wage environment is strongly influenced by adjustments made in mid-2025, including changes to the national minimum wage, superannuation contribution rates, and the high income threshold. These reforms affect both employee take-home pay and the total cost of employment for organisations.
National Minimum Wage Increase
Effective from 1 July 2025, the national minimum wage increased by 3.5 percent. This adjustment raised the hourly minimum wage to 24.95 dollars and the weekly minimum wage to 948.00 dollars.
The decision was influenced by a sustained decline in the real value of modern award wages since July 2021. Over that period, award wages experienced an estimated 4.5 percent reduction in real purchasing power due to inflation outpacing wage adjustments.
National Minimum Wage Overview
| Regulatory Measure | 2025–2026 Level | Economic Rationale |
|---|---|---|
| National Minimum Wage (Hourly) | 24.95 AUD | Restoration of real wage erosion |
| National Minimum Wage (Weekly) | 948.00 AUD | 38-hour workweek benchmark |
| Wage Increase Percentage | 3.5% | Inflation adjustment and award wage correction |
| Real Wage Decline Since 2021 | 4.5% | Trigger for corrective policy action |
This increase primarily impacts workers in retail, hospitality, care services, and other award-reliant industries. While the adjustment supports low-income earners, it also raises payroll obligations for employers in labour-intensive sectors.
Superannuation Guarantee Increase to 12 Percent
Another major regulatory change affecting salaries in Australia for 2026 is the increase in the Superannuation Guarantee contribution rate to 12 percent, effective from 1 July 2025.
Employers are now legally required to contribute 12 percent of an employee’s ordinary time earnings into a superannuation fund. This contribution may be structured as either:
• Paid on top of base salary
• Included within a total remuneration package
Regardless of structure, the increase raises the total employment cost for organisations.
Superannuation Impact Illustration
| Employee Annual Salary (AUD) | Superannuation Rate | Annual Employer Super Contribution (AUD) | Total Employment Cost (Excl. Other On-Costs) |
|---|---|---|---|
| 89,204 | 12% | 10,704 | 99,908 |
For an individual earning 89,204 dollars annually, the employer’s mandatory superannuation contribution is approximately 10,700 to 10,800 dollars per year. This amount is paid in addition to salary where contracts are structured as base plus super.
The rise in the Superannuation Guarantee strengthens long-term retirement savings for employees but also increases payroll budgeting requirements for employers.
Total Cost of Employment Framework
In 2026, organisations must consider total employment cost rather than salary alone. This includes superannuation, payroll tax, workers’ compensation insurance, and leave liabilities.
Total Employment Cost Components
| Cost Component | Employer Obligation Level | Budget Impact in 2026 |
|---|---|---|
| Base Salary | Mandatory | Primary cost driver |
| Superannuation (12%) | Mandatory | Increased |
| Payroll Tax | State-based | Variable |
| Workers’ Compensation | Mandatory insurance | Ongoing cost |
| Leave Accruals | Mandatory | Accumulated liability |
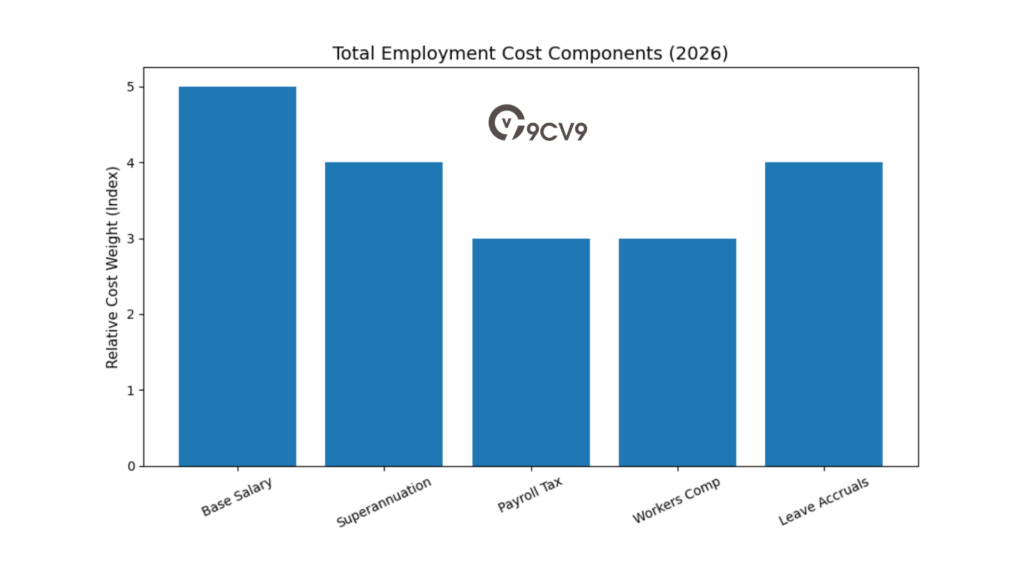
As superannuation contributions increase, total remuneration planning becomes more complex, particularly in public sector and large enterprise settings.
High Income Threshold Adjustment
The High Income Threshold rose to 183,100 dollars. This threshold plays an important role in employment law and determines eligibility for certain workplace protections.
Employees earning above this threshold may:
• Be excluded from unfair dismissal protections (unless covered by an award or agreement)
• Fall outside the scope of some enterprise agreement provisions
• Have different contractual negotiation dynamics
High Income Threshold Overview
| Regulatory Element | 2026 Level (AUD) | Practical Implication |
|---|---|---|
| High Income Threshold | 183,100 | Affects unfair dismissal coverage |
| Award Coverage Consideration | Income dependent | Senior executives often operate on individual contracts |
| Enterprise Agreement Scope | Threshold-linked | Influences bargaining eligibility |
For senior executives and high-income professionals, this threshold shapes contract structure and employment protection considerations.
Implications for Employers and Workforce Planning
The 2026 regulatory environment reinforces several structural realities:
• Minimum wage increases aim to protect low-income earners from inflation erosion.
• Superannuation increases strengthen retirement savings but raise payroll expenses.
• Higher income thresholds redefine employment protection coverage for senior staff.
For employers, these regulatory shifts require careful salary packaging design, workforce classification review, and total cost modelling.
For employees, understanding how base salary, superannuation, and legal thresholds interact is essential for evaluating job offers and long-term compensation value.
Conclusion: Regulatory Foundations of the 2026 Salary Landscape
The Australian salary environment in 2026 is shaped not only by market forces but also by regulatory governance. The 3.5 percent minimum wage increase, the rise in superannuation contributions to 12 percent, and the adjustment of the high income threshold collectively influence both employee earnings and employer costs.
In a period of moderated wage growth, regulatory settings play a stabilising role in maintaining wage floors, supporting retirement savings, and defining workplace protections. For organisations and professionals alike, understanding these regulatory foundations is critical when analysing total compensation outcomes in Australia for 2026.
10. Navigation of the 2026 Remuneration Frontier
A Workforce in Transition
A complete guide to salaries in Australia for 2026 presents a labour market that is stabilising after a period of rapid wage acceleration. The exceptional salary growth recorded during 2023 and 2024 has moderated, yet the market remains tight relative to long-term historical standards.
Economic authorities have provided a steady framework for wage expectations. Annual wage growth is projected to sit within a range of approximately 3.0 percent to 3.25 percent. This creates a predictable environment for salary planning, even as inflation pressures ease and hiring demand cools slightly.
Wage Growth Outlook Framework
| Indicator | 2026 Position | Implication for Salary Planning |
|---|---|---|
| Projected Wage Growth | 3.0% – 3.25% | Stable but moderated increases |
| Labour Market Condition | Tight but cooling | Selective hiring competition |
| Inflation Pressure | Easing | Gradual real wage recovery |
| Productivity Growth | Under scrutiny | Incentive-based compensation focus |
High-Income Concentration by Discipline
In 2026, high-income potential is increasingly concentrated in technical, medical, and executive leadership roles. STEM disciplines, including engineering, artificial intelligence, cybersecurity, and data science, continue to attract strong salary premiums.
Medical specialists remain at the top of the income spectrum due to extended training requirements and workforce scarcity. Corporate strategy and executive leadership roles also offer significant earning potential, particularly where individuals guide technological transformation, capital allocation, and organisational change.
High-Income Sector Concentration Matrix
| Sector Category | Income Potential Level | Core Value Driver |
|---|---|---|
| Medical Specialties | Very High | Scarcity and clinical complexity |
| Engineering and STEM | High | Technical expertise and innovation |
| Artificial Intelligence | Premium Tier | Digital transformation demand |
| Corporate Strategy | High to Very High | Enterprise growth and market expansion |
| Financial Leadership | High | Capital governance and risk oversight |
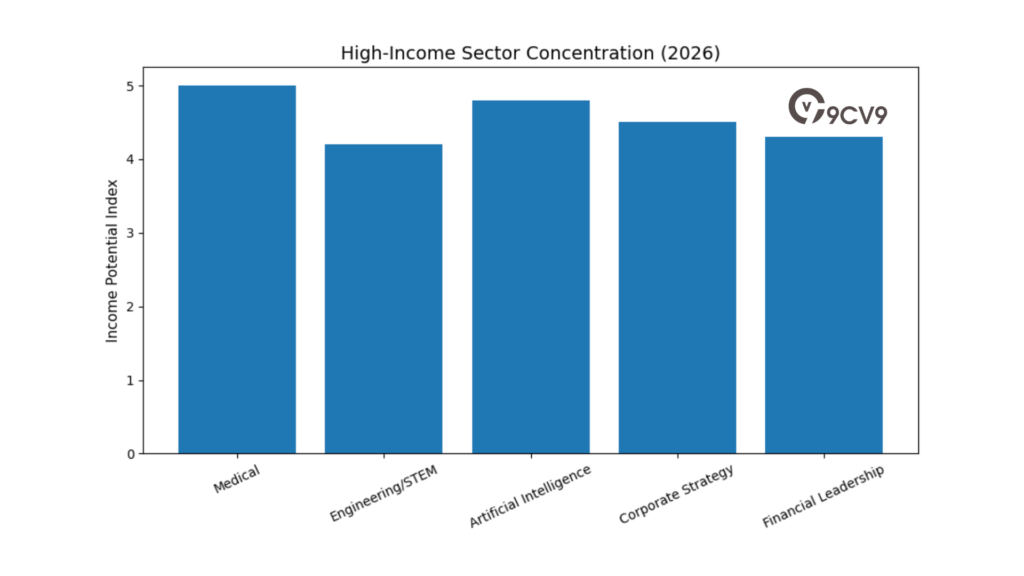
This distribution reinforces the importance of advanced qualifications, technical depth, and strategic leadership capacity in achieving top-tier compensation.
Employer Strategy: From Broad Increases to Targeted Alignment
As overall wage growth stabilises, employers are moving away from broad salary increases across entire workforces. Instead, organisations are prioritising clarity in workforce planning and aligning compensation with critical skill gaps.
This approach focuses on rewarding roles that directly contribute to efficiency, innovation, and revenue generation. Short-term incentives, performance bonuses, and flexible benefit structures are increasingly used to enhance total remuneration without permanently increasing fixed salary budgets.
Compensation Strategy Shift in 2026
| Strategy Element | 2023–2024 Approach | 2026 Approach |
|---|---|---|
| Broad Salary Increases | Common | Limited |
| Targeted Skill Premiums | Emerging | Standard practice |
| Performance Incentives | Supplementary | Core component |
| Flexible Work Benefits | Competitive differentiator | Essential retention tool |
| Salary Packaging | Secondary benefit | Strategic financial tool |
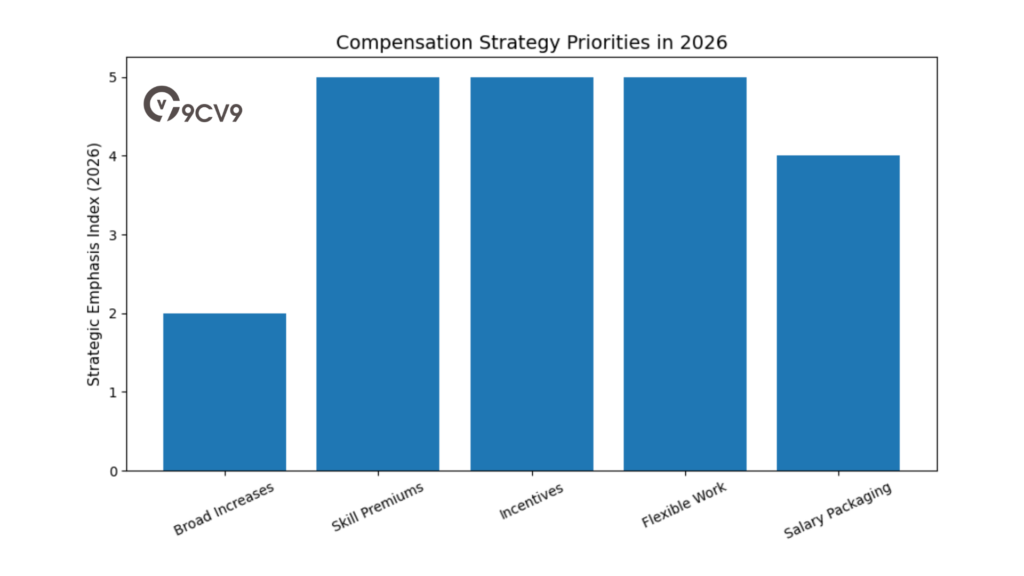
This shift reflects a more disciplined approach to remuneration, balancing cost control with retention needs.
Geographic Earnings and Cost of Living Reassessment
Geography remains a powerful influence on salary outcomes. The Australian Capital Territory and Western Australia continue to record the highest average weekly earnings due to public administration strength and resource sector dominance.
However, rising housing costs in major capital cities are reshaping perceptions of real income. High nominal salaries in metropolitan centres are increasingly offset by rental and mortgage pressures. This dynamic is prompting both employees and employers to reconsider regional alternatives.
Geographic Earnings Comparison
| Location Category | Nominal Salary Position | Cost Pressure Level | Real Income Outlook |
|---|---|---|---|
| ACT | Highest | Moderate | Strong median stability |
| Western Australia | High | Variable | Mining-driven advantage |
| Sydney | High professional pay | Very High housing | Reduced disposable margin |
| Regional Centres | Moderate | Lower housing cost | Improved affordability |
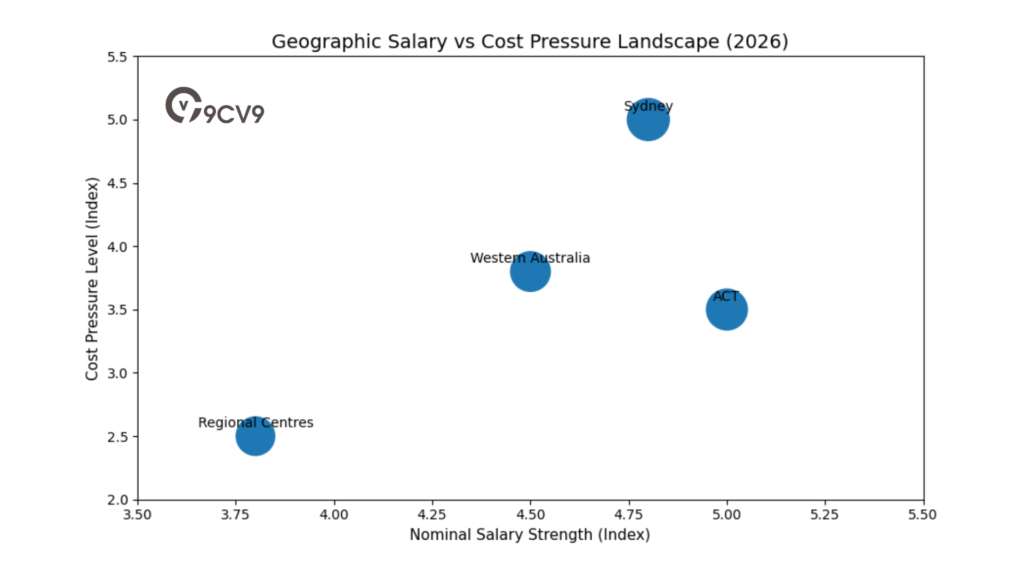
Regional hubs are gaining attention as viable employment centres, particularly when combined with remote work flexibility and salary packaging benefits.
Integration of Technical and Human-Centric Leadership
As Australia progresses through the latter half of the decade, the most reliable pathway to high compensation lies in combining advanced technical capability with strong human-centred leadership.
Automation and artificial intelligence are reshaping industries, yet organisations continue to face shortages of professionals who can manage complex stakeholder relationships, guide strategic transformation, and make high-level decisions under uncertainty.
Future-Proof Skill Integration Model
| Skill Dimension | Market Demand Level | Influence on Earnings Growth |
|---|---|---|
| Advanced Technical Skills | Very High | Strong salary premium |
| Strategic Decision-Making | High | Accelerates senior progression |
| Cross-Functional Leadership | High | Supports executive pathways |
| Emotional Intelligence | Increasing | Enhances long-term value |
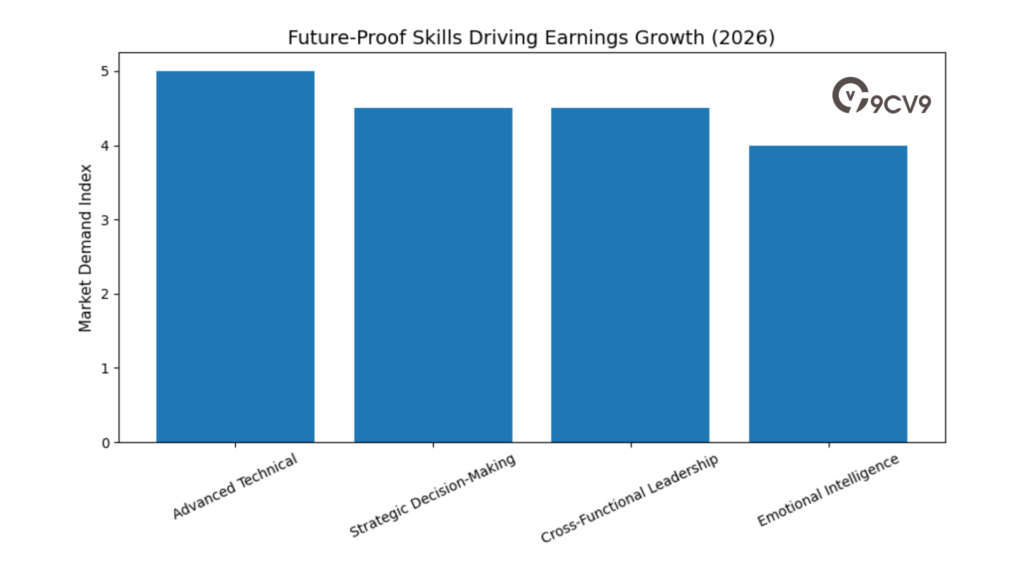
Professionals who integrate STEM expertise with communication, adaptability, and governance capabilities are positioned to access the upper tiers of compensation.
Conclusion: Navigating the 2026 Remuneration Frontier
The Australian salary landscape in 2026 reflects stability after a period of rapid adjustment. Wage growth has settled into a sustainable range, and the labour market remains competitive but no longer overheated.
High-income opportunities are concentrated in specialised technical fields, medical expertise, and senior corporate leadership. Employers are emphasising targeted incentives, flexible benefits, and skills alignment over broad salary inflation. Meanwhile, housing affordability pressures are reshaping geographic employment decisions.
In this evolving environment, sustained earning growth depends on adaptability, advanced qualifications, and the integration of technical excellence with strategic leadership capability. Those who align their skills with emerging economic priorities are most likely to thrive within Australia’s 2026 remuneration landscape.
Conclusion
A complete guide to salaries in Australia for 2026 reveals a labour market that is stabilising after a period of rapid wage expansion, yet still evolving in important structural ways. The exceptional post-pandemic wage acceleration seen in 2023 and 2024 has moderated, but compensation levels remain historically elevated in many sectors. Wage growth has settled into a sustainable range of approximately 3.0 percent to 3.25 percent, providing predictability for employers while offering gradual real income recovery for employees.
The Australian salary landscape in 2026 is defined not by across-the-board pay increases, but by precision. Industry, location, experience, qualifications, and strategic skill alignment now determine earning potential far more than broad economic momentum. Understanding these interconnected drivers is essential for professionals seeking income growth and for organisations designing competitive remuneration strategies.
Industry Remains the Strongest Determinant of Salary Levels
Sector selection continues to be one of the most powerful predictors of income. Mining and resources maintain their position at the top of the earnings scale, supported by capital intensity, export demand, and structured allowance systems. Medical specialists dominate the highest base salary tiers due to extended training requirements and practitioner scarcity. Technology leadership, artificial intelligence, cybersecurity architecture, and executive corporate roles also command premium compensation in 2026.
In contrast, labour-intensive service sectors such as retail and hospitality operate within tighter margin structures, resulting in lower average weekly earnings despite strong employment demand. The divergence between high-capital industries and high-volume service industries illustrates the two-speed nature of Australia’s salary market.
Experience and Education Drive Income Acceleration
Seniority remains a decisive income multiplier. Professionals with eight or more years of experience in technical or strategic roles frequently earn 30 percent to 80 percent more than early-career counterparts. Structured progression pathways in finance, information technology, sustainability management, public service, and engineering reinforce the financial value of accumulated expertise.
Educational attainment also plays a significant role in salary progression. Advanced degrees, professional certifications, and specialist accreditation continue to generate measurable income premiums. In many professional services roles, a Master’s qualification can increase salary potential by close to 30 percent compared to a Bachelor’s degree alone. In medicine and certain STEM disciplines, postgraduate training is the primary gateway to top-tier compensation.
Geographic Location Shapes Real and Nominal Earnings
Regional and metropolitan salary comparisons demonstrate that location strongly influences earning potential. The Australian Capital Territory and Western Australia continue to record some of the highest average weekly earnings due to public administration strength and resource sector dominance. Sydney leads in nominal corporate and financial sector salaries, reflecting its status as Australia’s primary financial hub.
However, rising housing costs in major capital cities are reshaping perceptions of real disposable income. Rent-to-income ratios have climbed significantly, with housing costs rising faster than wages over recent years. As a result, regional centres are becoming increasingly attractive for professionals seeking stronger real purchasing power combined with remote or hybrid work flexibility.
The Rise of Total Reward Strategies Over Base Salary Growth
In a wage environment stabilising around 3 percent annual growth, employers are shifting focus from broad salary increases to holistic total reward strategies. Flexible working arrangements, salary packaging options, performance bonuses, and tax-efficient benefits have become central components of competitive employment offers.
Salary packaging opportunities, including remote area benefits, novated leasing for electric vehicles, and not-for-profit sector tax concessions, are playing a larger role in improving take-home pay without permanently increasing fixed salary budgets. Short-term incentives allow employers to reward productivity and business performance while maintaining cost flexibility.
For employees, understanding total remuneration packages is now just as important as negotiating base salary. For employers, strategic benefits design is critical in an environment where workforce mobility remains high and career progression expectations continue to rise.
Regulatory Settings Provide Stability and Structure
Minimum wage adjustments, superannuation increases, and changes to income thresholds have further shaped the 2026 salary environment. The increase in the national minimum wage and the rise of the Superannuation Guarantee to 12 percent have strengthened income floors and retirement savings, while also raising total employment costs.
These regulatory settings create a stable foundation for wage expectations while ensuring long-term financial security mechanisms remain embedded in Australia’s employment framework.
The Growing Importance of Skills Alignment and Human Capability
As Australia moves deeper into digital transformation, high-income growth is increasingly concentrated in roles that combine advanced technical capability with strong human-centric leadership. Artificial intelligence, automation, sustainability, and cybersecurity are reshaping industries, yet employers continue to report shortages of professionals who can integrate technical expertise with strategic decision-making and stakeholder management.
The most resilient path to top-tier compensation in 2026 lies in the integration of specialised skills with leadership capability. Professionals who combine STEM expertise with communication, adaptability, and governance awareness are best positioned for long-term income growth.
What the 2026 Salary Landscape Means for Professionals and Employers
For professionals, success in the Australian salary market depends on:
• Selecting high-demand industries
• Investing in advanced qualifications and certifications
• Gaining experience in business-critical roles
• Developing leadership and strategic capabilities
• Evaluating real income after housing and living costs
For employers, sustainable remuneration strategy requires:
• Targeted skill-based compensation
• Transparent career progression pathways
• Flexible working frameworks
• Competitive but disciplined salary budgeting
• Alignment between productivity outcomes and incentive structures
Final Perspective on Salaries in Australia for 2026
Salaries in Australia for 2026 reflect maturity rather than volatility. The era of rapid, broad wage escalation has given way to measured, skills-driven growth. While average increases are stabilising, high-income potential remains strong for those positioned in advanced technical, medical, and strategic corporate roles.
The defining theme of 2026 is alignment. Alignment between skills and industry demand. Alignment between compensation and productivity. Alignment between total rewards and employee expectations. And alignment between nominal salary and real purchasing power.
For anyone navigating career decisions, workforce planning, or executive remuneration strategy, understanding the full structure of Australia’s 2026 salary landscape is essential. A data-driven, sector-aware, and strategically informed approach to compensation will remain the key to maximising opportunity in the years ahead.
If you find this article useful, why not share it with your hiring manager and C-level suite friends and also leave a nice comment below?
We, at the 9cv9 Research Team, strive to bring the latest and most meaningful data, guides, and statistics to your doorstep.
To get access to top-quality guides, click over to 9cv9 Blog.
To hire top talents using our modern AI-powered recruitment agency, find out more at 9cv9 Modern AI-Powered Recruitment Agency.
People Also Ask
What is the average salary in Australia for 2026?
The average full-time weekly earnings in Australia for 2026 sit above 2,000 AUD, though median earnings are lower. Industry, location, and experience significantly affect actual take-home pay.
What is the national minimum wage in Australia in 2026?
The national minimum wage is 24.95 AUD per hour or 948 AUD per week, following a 3.5 percent increase effective from July 2025.
Which industry pays the highest salaries in Australia in 2026?
Mining remains the highest-paying sector, followed by medical specialties, executive leadership, finance, and technology roles focused on AI and cybersecurity.
What are the highest paying jobs in Australia for 2026?
Neurosurgeons, cardiothoracic surgeons, CEOs, Chief Strategy Officers, and senior technology executives rank among the top earners.
How much do graduates earn in Australia in 2026?
Graduate salaries vary by industry. Mining, consulting, engineering, and technology offer strong starting pay, while accounting and general business roles begin lower but grow over time.
Is wage growth slowing in Australia in 2026?
Yes, wage growth has moderated to around 3.0 percent to 3.25 percent annually, compared to higher post-pandemic increases.
How does location affect salaries in Australia?
The ACT, Northern Territory, and Western Australia record the highest average earnings, while major cities like Sydney offer high nominal pay but higher living costs.
What is the gender pay gap in Australia in 2026?
The gender pay gap remains above 10 percent nationally, though it varies significantly by industry and state.
Do IT professionals earn more in 2026?
Yes, especially those with expertise in artificial intelligence, cybersecurity, cloud architecture, and digital transformation leadership.
How much do CFOs earn in Australia in 2026?
CFO salaries depend on company size. Base pay ranges from 160,000 AUD in smaller firms to over 500,000 AUD in large enterprises.
What is the Superannuation Guarantee rate in 2026?
The Superannuation Guarantee is 12 percent, paid by employers on top of or within total salary packages.
How does experience impact salary growth in 2026?
Professionals with over eight years of experience can earn 30 percent to 80 percent more than entry-level employees in technical and leadership roles.
Are regional salaries competitive in Australia?
Regional roles often offer slightly lower base pay but may provide allowances and lower housing costs, improving real disposable income.
What are average salaries in mining in 2026?
Mining workers earn among the highest weekly totals, often exceeding 3,000 AUD, especially with allowances and bonuses.
How much do medical specialists earn in Australia?
Medical specialists such as neurosurgeons and anaesthetists can earn between 400,000 AUD and over 800,000 AUD annually.
What is the median salary in Australia in 2026?
Median weekly earnings are around 1,400 AUD, offering a more realistic picture of typical income compared to higher mean averages.
Are flexible work benefits important in 2026?
Yes, flexible work is one of the most valued benefits, with many employees prioritising work-life balance over salary increases.
What is salary packaging in Australia?
Salary packaging allows employees to allocate pre-tax income to approved expenses, increasing take-home pay without raising base salary.
Do Sydney salaries include a premium?
Finance and corporate roles in Sydney often attract a 15 percent to 25 percent premium due to corporate headquarters concentration.
How much do cybersecurity professionals earn in 2026?
Senior cybersecurity specialists can earn well above 150,000 AUD, with executive roles exceeding 250,000 AUD.
What degrees lead to the highest salaries in Australia?
Engineering, medicine, dentistry, actuarial science, and AI-related degrees consistently produce higher starting and long-term salaries.
Are public sector salaries competitive in 2026?
Public sector salaries are structured with clear progression pathways and strong superannuation, particularly in Canberra.
How does housing affect real salary value in 2026?
Rising rents in major cities reduce disposable income, making regional relocation and salary packaging more attractive.
What is the High Income Threshold in 2026?
The High Income Threshold is 183,100 AUD, affecting unfair dismissal protections and enterprise agreement coverage.
Do bonuses make a difference in total compensation?
Yes, short-term incentives and performance bonuses significantly increase total earnings without permanently raising base pay.
Is the Australian salary market competitive in 2026?
The market remains tight but cooling, with strong demand for specialised and leadership roles.
Which cities offer the highest salaries in Australia?
Canberra records high median earnings, while Sydney leads in professional monthly salary levels.
Are accounting salaries strong in 2026?
Entry-level accounting salaries are moderate, but earnings increase substantially with experience and professional certification.
How important are human skills in 2026 salary growth?
Strategic thinking, leadership, and communication skills are highly valued and enhance earning potential alongside technical expertise.
What is the outlook for Australian salaries beyond 2026?
Salaries are expected to grow steadily with moderate increases, driven by skills demand, productivity gains, and technological transformation.
Sources
Australian Bureau of Statistics
- Australian Industry Group
- HCAMag
- Australian Chamber of Commerce and Industry
- Australian Institute of Company Directors
- Morgan McKinley
- Workplace Gender Equality Agency
- Arielle Executive
- Jobs and Skills Australia
- Prosple
- IBISWorld
- Edvise Hub
- ScaleSuite
- TerraTern
- Emanate Technology
- Robert Half
- Mirage News
- Business Victoria
- PayScale
- SalaryExpert
- Talent.com
- Parliament of Australia
- Hays
- SEEK Grad
- SalPac Australia
- SmartSalary
- BOX Advisory Services
- Mercer
- Hillhouse Legal Partners
- Fair Work Ombudsman
- Normans
- Michael Page Australia

")


