
 Software in 2026")


")


")


")
Key Takeaways
- The cost to hire AI engineers in 2026 varies dramatically by region, with Tier-1 hubs like the US and UK commanding premium salaries, while Asia and emerging markets offer 60–80% cost efficiency.
- Total hiring cost goes beyond base salary, including bonuses, equity, recruitment fees, GPU infrastructure, and MLOps overhead—often adding 30–50% to first-year spend.
- Specialization in AI safety, alignment, and MLOps drives 25–45% salary premiums, making strategic global compensation planning critical for long-term retention and competitiveness.
Artificial intelligence is no longer an experimental frontier—it is the core infrastructure of modern enterprise. In 2026, organizations across finance, healthcare, manufacturing, retail, logistics, and government are racing to embed AI into mission-critical operations. As adoption accelerates, one strategic question dominates boardroom discussions: what is the real cost to hire AI engineers in 2026?

The answer is more complex than a salary figure. Hiring AI engineers today requires understanding global compensation benchmarks, specialization premiums, infrastructure costs, recruitment dynamics, regulatory overhead, and purchasing power parity across regions. The AI labor market has undergone a structural recalibration. Demand for engineers capable of building, deploying, and governing production-grade AI systems has far outpaced supply, pushing compensation levels to historic highs in major innovation hubs while simultaneously opening new opportunities in emerging markets.
In Tier-1 cities such as San Francisco and London, senior AI engineers often command total compensation packages that rival executive roles. Meanwhile, high-growth technology ecosystems in Bangalore, Ho Chi Minh City, Eastern Europe, and Latin America are reshaping the global hiring equation by offering significant cost efficiency without sacrificing technical depth. This global dispersion of talent has created both opportunity and complexity for employers seeking to optimize budgets while maintaining elite capability.
The cost to hire AI engineers in 2026 varies dramatically depending on region, role specialization, and business model. A mid-level machine learning engineer in Southeast Asia may cost a fraction of a comparable hire in Silicon Valley. However, when factoring in equity packages, signing bonuses, recruitment fees, cloud infrastructure budgets, compliance costs, and retention incentives, the total first-year investment can increase by 30–50 percent above base salary alone. For senior roles in AI safety, alignment, agentic system orchestration, and MLOps governance, salary premiums of 25–45 percent above standard software engineering benchmarks are increasingly common.
Beyond direct compensation, organizations must account for infrastructure as a core component of hiring cost. Modern AI development requires access to high-performance GPU environments, scalable cloud platforms, and robust data engineering pipelines. Infrastructure expenses—ranging from thousands to tens of thousands of dollars per engineer annually—are now embedded in the total cost of ownership of AI talent. In 2026, compute access has effectively become part of the compensation package.
Geography remains one of the most influential cost variables. Differences in taxation, social contributions, healthcare obligations, and employment compliance laws significantly impact employer expenditure. A $200,000 salary in the United States may translate into a substantially higher employer burden once payroll taxes and benefits are included. Conversely, hiring in parts of Asia or Latin America can deliver 60–80 percent cost savings on development-heavy initiatives, particularly when organizations adopt structured global compensation strategies.
However, cost efficiency cannot be pursued blindly. The AI hiring market is segmented by capability. Generalist software engineers are no longer interchangeable with AI specialists capable of building autonomous systems, implementing safety guardrails, or managing distributed training environments. As enterprises shift from experimental pilots to large-scale AI deployment, production reliability and governance expertise have become indispensable. This shift has permanently elevated the value—and cost—of specialized AI engineering talent.
The global AI talent shortage continues to widen as adoption expands across industries. Venture-backed startups, multinational corporations, and government-backed sovereign AI initiatives are competing for the same limited pool of experienced professionals. This competition drives salary inflation, accelerates hiring cycles, and increases retention risk. Organizations that underestimate these dynamics risk prolonged vacancies, stalled innovation, and escalating recruitment expenses.
At the same time, remote-first work models have unlocked new hiring strategies. Companies are no longer restricted to local markets. By leveraging nearshore and offshore talent ecosystems, businesses can design zonal compensation frameworks that balance premium leadership hubs with cost-efficient execution centers. This approach requires a sophisticated understanding of real take-home pay parity, cost-of-living differences, and global labor law compliance.
This comprehensive guide provides a complete breakdown of the cost to hire AI engineers in 2026 by region. It examines salary benchmarks across North America, Europe, Asia-Pacific, and Latin America; explores specialization-driven pay premiums; analyzes total employer cost beyond base compensation; and outlines strategic frameworks for optimizing AI hiring budgets in a competitive global market.
Understanding the cost structure of AI talent is not merely an HR function—it is a capital allocation decision that shapes long-term competitiveness. As artificial intelligence becomes the primary engine of digital transformation, the ability to attract, fund, and retain elite AI engineers will determine which organizations lead the next phase of technological advancement.
In 2026, hiring AI engineers is no longer optional for ambitious enterprises. It is the foundational investment that defines growth, innovation velocity, and strategic resilience in an AI-driven economy.
Before we venture further into this article, we would like to share who we are and what we do.
About 9cv9
9cv9 is a business tech startup based in Singapore and Asia, with a strong presence all over the world.
With over nine years of startup and business experience, and being highly involved in connecting with thousands of companies and startups, the 9cv9 team has listed some important learning points in this overview of the Cost to Hire AI Engineers in 2026 (Complete Breakdown by Region).
If your company needs recruitment and headhunting services to hire top-quality employees, you can use 9cv9 headhunting and recruitment services to hire top talents and candidates. Find out more here, or send over an email to [email protected].
Or just post 1 free job posting here at 9cv9 Hiring Portal in under 10 minutes.
Cost to Hire AI Engineers in 2026 (Complete Breakdown by Region)
- The North American Frontier: Global Ceiling and the Four-Zone Model
- The European Divide: High-Cost Hubs vs. Eastern Arbitrage
- Asia-Pacific and the Southeast Asian Growth Engine
- Latin America: The Nearshore Strategic Choice
- Specialization Premiums and Niche Skillset Economics
- The Burden of Employment: Taxes, Benefits, and Overhead
- Recruitment Dynamics and the War for Elite Talent
- Macroeconomic Drivers: Demand, Supply, and the 2026 Reality
- Build vs. Buy: The Specialized AI Agency Model
- The Global Cost of Living and Take-Home Pay Parity
- Future Outlook
1. The North American Frontier: Global Ceiling and the Four-Zone Model
a. US Regional Salary Benchmarks by Hub Tier
The global hiring landscape for AI engineers in 2026 reflects structural changes in how enterprises deploy artificial intelligence across industries. Generative AI systems, multimodal foundation models, autonomous systems, defense AI, and sovereign cloud infrastructure have accelerated demand for specialized engineering talent. As a result, compensation levels have become increasingly stratified by geography, industry concentration, and competitive density.
The United States continues to define the global compensation ceiling, but hiring strategies are no longer uniform. Organizations now apply regionally indexed pay frameworks, distributed workforce models, and cost-efficiency corridors to balance budget realities with innovation requirements.
Below is a comprehensive regional breakdown of AI engineering compensation trends in 2026, structured for clarity and strategic planning.
United States: The Global Compensation Benchmark
The United States remains the highest-paying AI talent market in the world. However, the domestic market is segmented into four competitive zones based on ecosystem maturity, venture capital activity, cost of living, and proximity to elite research labs.
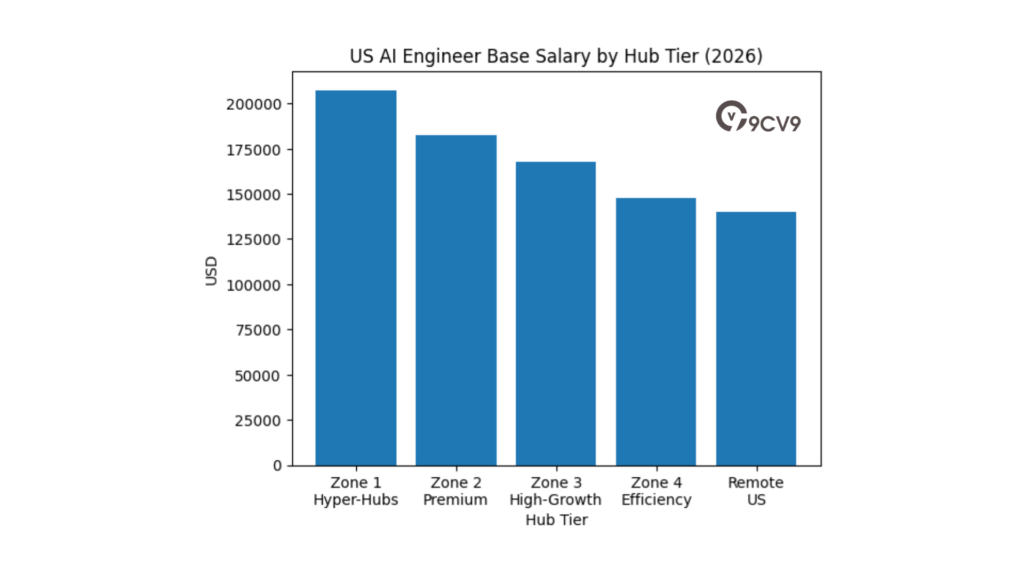
US Regional Salary Benchmarks (Senior AI Engineer, 6–10 Years Experience, 2026)
| Hub Tier | Representative Cities | Median Base Salary (USD) | Median Total Compensation (USD) |
|---|---|---|---|
| Zone 1 – Hyper-Hubs | San Francisco, NYC, Seattle | 205,000 – 210,000 | 285,000 – 320,000 |
| Zone 2 – Premium Tech | Los Angeles, Washington D.C. | 175,000 – 190,000 | 245,000 – 265,000 |
| Zone 3 – High-Growth | Austin, Boston, Chicago, Denver | 160,000 – 175,000 | 210,000 – 230,000 |
| Zone 4 – Efficiency | Raleigh-Durham, Phoenix, Dallas | 140,000 – 155,000 | 180,000 – 200,000 |
| Remote – National | Geographically Distributed (US-based) | ~140,000 | ~206,600 |
Zone 1 – Hyper-Hubs
San Francisco, New York City, and Seattle continue to anchor the highest compensation bands globally. Competition is driven by hyperscalers, AI research labs, autonomous vehicle firms, and venture-backed generative AI startups. Total compensation often includes large equity grants and retention bonuses.
Zone 2 – Premium Tech Markets
Los Angeles and Washington D.C. are seeing accelerated salary growth due to defense AI, aerospace automation, cybersecurity, and federal sovereign AI programs. Compensation in these markets tracks roughly 8–10 percent below Bay Area benchmarks.
Zone 3 – High-Growth Innovation Centers
Austin, Boston, Chicago, and Denver combine research universities, fintech ecosystems, robotics clusters, and enterprise AI demand. These markets offer moderate cost savings while maintaining strong technical depth.
Zone 4 – Efficiency Markets
Raleigh-Durham, Phoenix, and Dallas represent optimized hiring corridors where firms can secure experienced engineers at a 15–20 percent discount relative to Hyper-Hubs, provided remote flexibility and competitive project scope are offered.
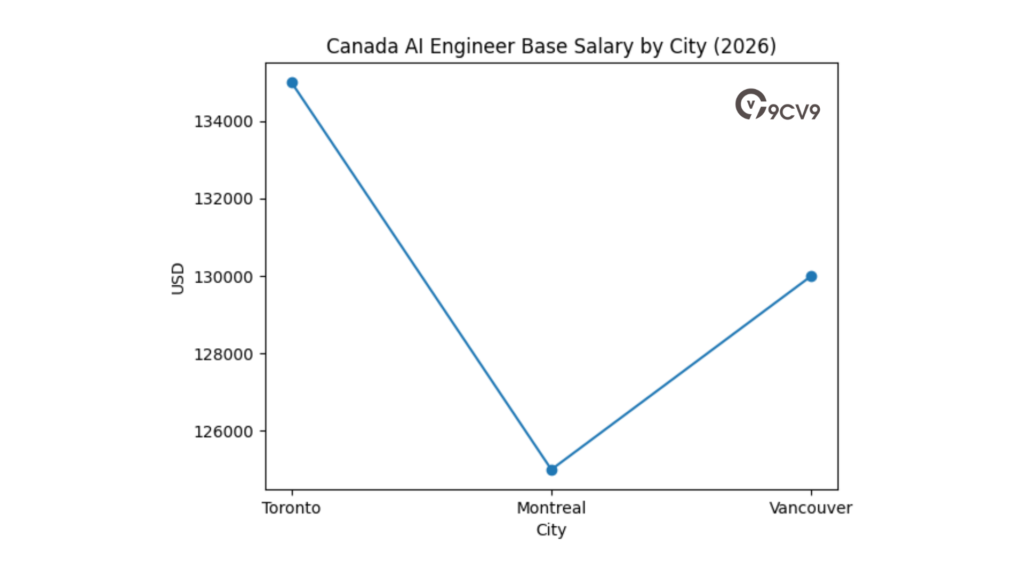
Canada: Strategic Nearshore AI Talent
Canada remains a strong AI talent hub, supported by research ecosystems and immigration-friendly policies. While compensation levels are below US benchmarks, cross-border competition has increased.
Canada AI Salary Benchmarks (Senior AI Engineer, 2026)
| City | Median Base Salary (USD Equivalent) | Median Total Compensation (USD Equivalent) |
|---|---|---|
| Toronto | 125,000 – 145,000 | 150,000 – 180,000 |
| Montreal | 115,000 – 135,000 | 140,000 – 165,000 |
| Vancouver | 120,000 – 140,000 | 145,000 – 170,000 |
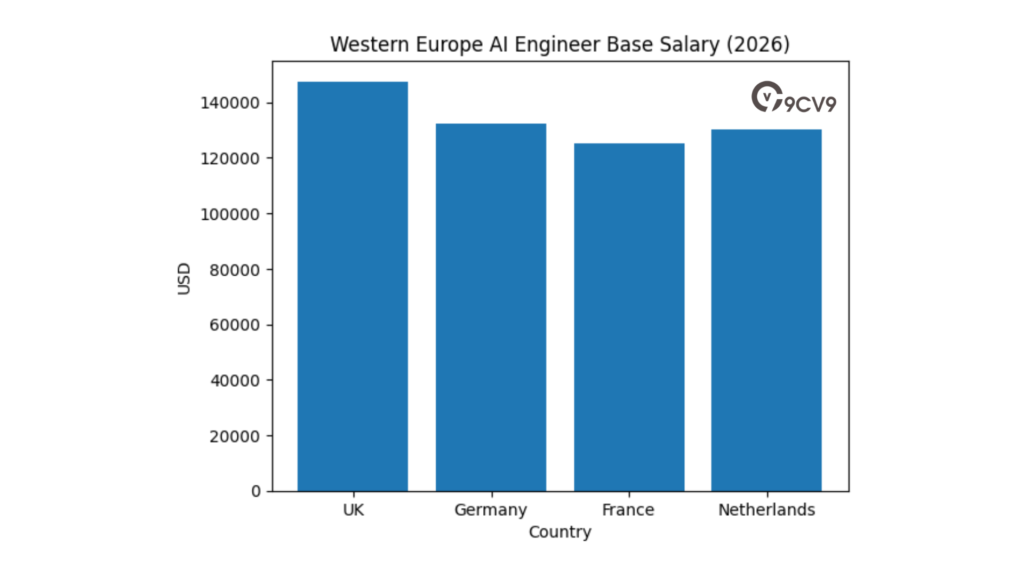
Western Europe: Mature but Cost-Disciplined Markets
Western Europe offers strong AI engineering depth, particularly in finance, automotive AI, and industrial automation. Compensation remains below US levels but continues to rise due to enterprise AI adoption.
Western Europe Salary Benchmarks (Senior AI Engineer, 2026)
| Country | Major Cities | Median Base Salary (USD Equivalent) | Median Total Compensation (USD Equivalent) |
|---|---|---|---|
| United Kingdom | London | 135,000 – 160,000 | 165,000 – 195,000 |
| Germany | Berlin, Munich | 120,000 – 145,000 | 150,000 – 175,000 |
| France | Paris | 115,000 – 135,000 | 140,000 – 165,000 |
| Netherlands | Amsterdam | 120,000 – 140,000 | 145,000 – 170,000 |
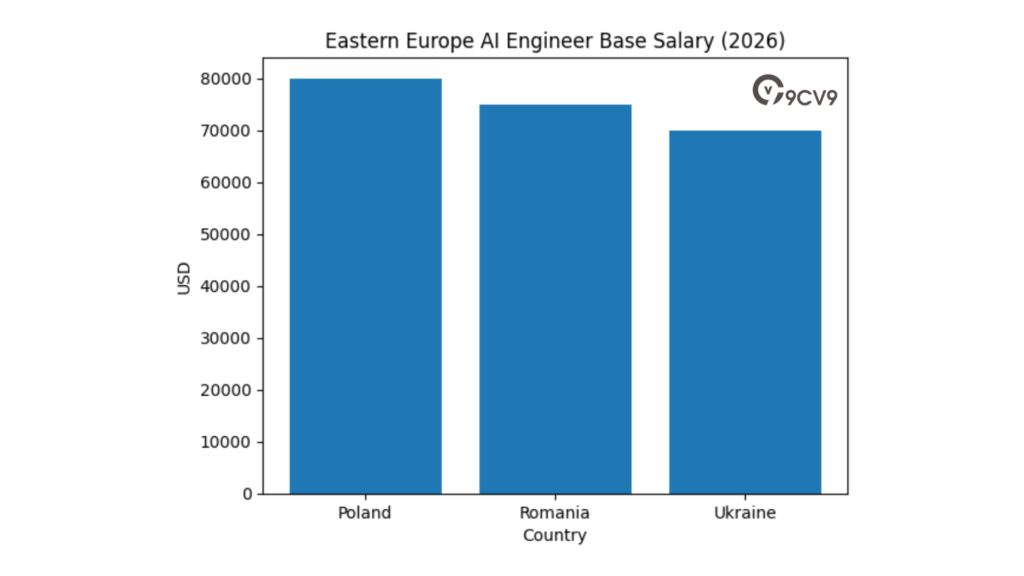
Eastern Europe: Cost-Optimized Technical Excellence
Eastern Europe remains a cost-efficient AI engineering market with strong mathematical and algorithmic expertise. Many global companies maintain distributed AI teams across the region.
Eastern Europe Salary Benchmarks (Senior AI Engineer, 2026)
| Country | Key Cities | Median Base Salary (USD Equivalent) | Relative Cost vs US Hyper-Hub |
|---|---|---|---|
| Poland | Warsaw, Krakow | 70,000 – 90,000 | 55–65% lower |
| Romania | Bucharest | 65,000 – 85,000 | 60–70% lower |
| Ukraine | Kyiv | 60,000 – 80,000 | 65–70% lower |
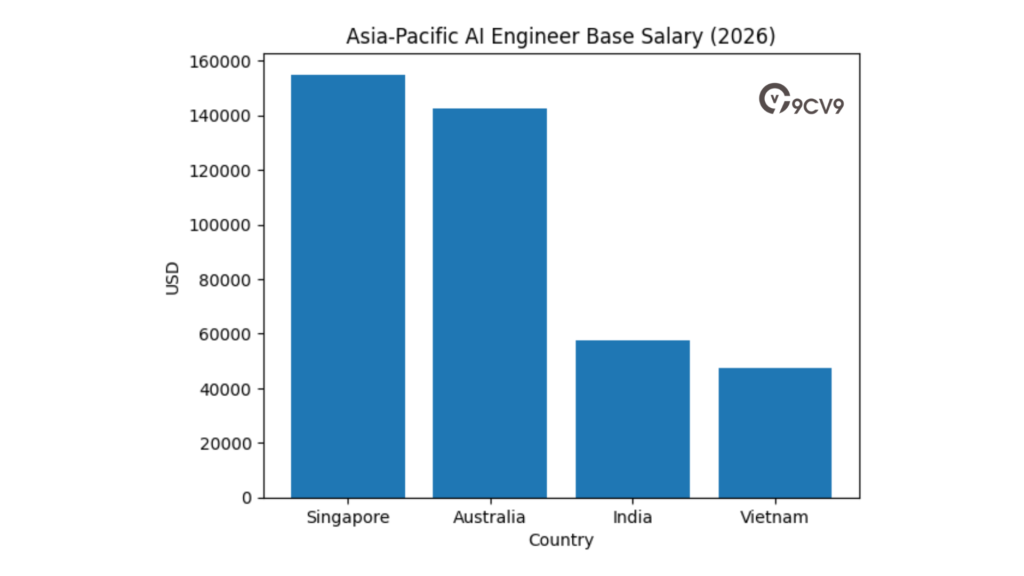
Asia-Pacific: Expanding AI Workforce at Scale
Asia-Pacific combines high-cost advanced markets with large-scale, cost-efficient talent pools.
Asia-Pacific Salary Benchmarks (Senior AI Engineer, 2026)
| Country | Major Cities | Median Base Salary (USD Equivalent) | Market Position |
|---|---|---|---|
| Singapore | Singapore | 140,000 – 170,000 | APAC Premium Hub |
| Australia | Sydney, Melbourne | 130,000 – 155,000 | Mature Market |
| India | Bangalore, Hyderabad | 45,000 – 70,000 | Scale Talent Hub |
| Vietnam | Ho Chi Minh City, Hanoi | 35,000 – 60,000 | Emerging AI Hub |
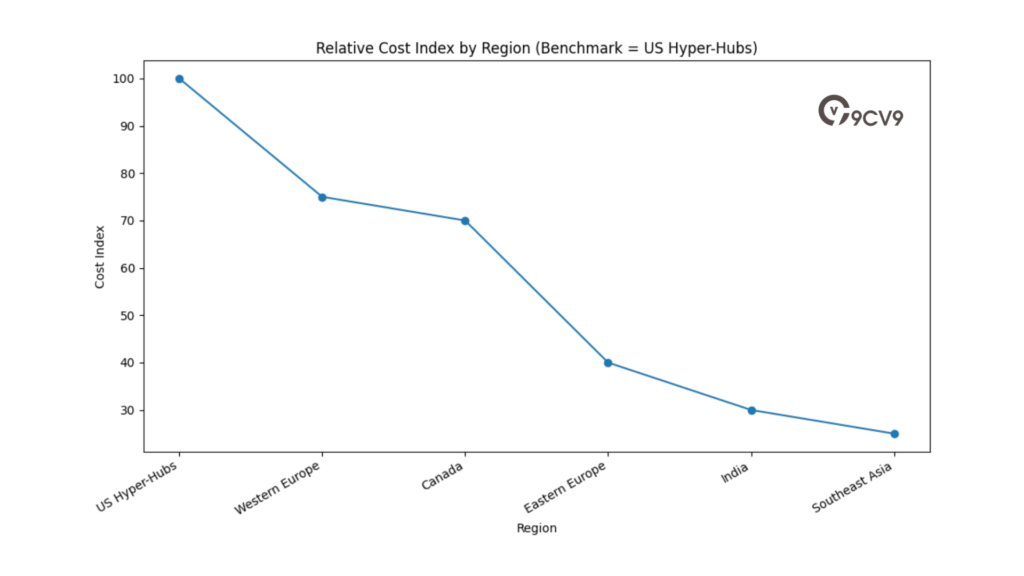
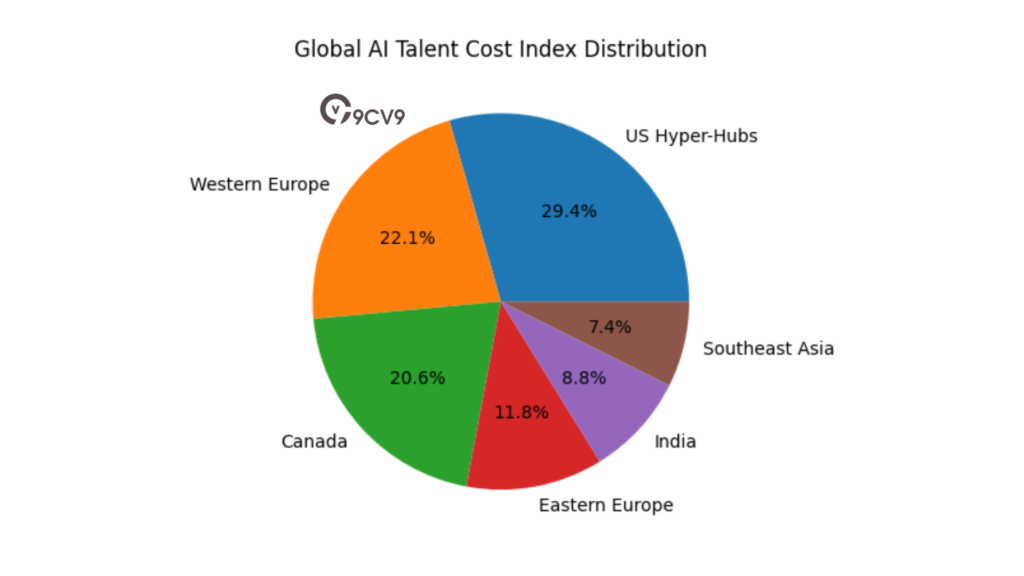
Global Cost Efficiency Matrix
The following matrix illustrates relative cost positioning and ecosystem maturity.
| Region | Cost Level (Global Index) | Talent Depth | Ecosystem Maturity | Strategic Hiring Use Case |
|---|---|---|---|---|
| US Hyper-Hubs | 100 (Benchmark) | Very High | Frontier Research | Cutting-edge AI R&D |
| Western Europe | 70–80 | High | Enterprise AI | Regulated industries |
| Canada | 65–75 | High | Research-driven | Nearshore collaboration |
| Eastern Europe | 35–45 | Moderate | Outsourcing hubs | Cost-optimized builds |
| India | 25–35 | High (Scale) | Services + Startups | Large engineering teams |
| Southeast Asia | 20–30 | Growing | Emerging markets | Hybrid distributed teams |
Strategic Observations for 2026
The global cost to hire AI engineers in 2026 is no longer determined solely by base salary. Total compensation now includes equity, research budgets, compute allowances, flexible remote structures, and relocation incentives. Organizations that successfully balance geographic arbitrage with ecosystem quality are achieving stronger cost-performance ratios.
As AI adoption continues to expand into healthcare, finance, logistics, manufacturing, defense, and climate technology, hiring competition is expected to remain elevated through 2027 and beyond. Companies must therefore evaluate not only regional salary benchmarks but also long-term workforce sustainability, regulatory exposure, and infrastructure alignment when planning global AI hiring strategies.
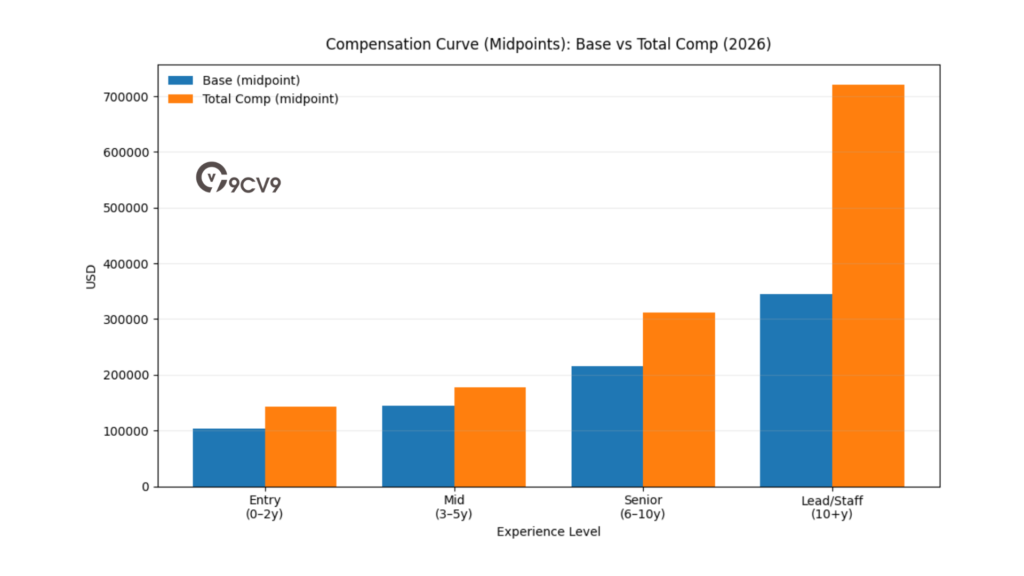
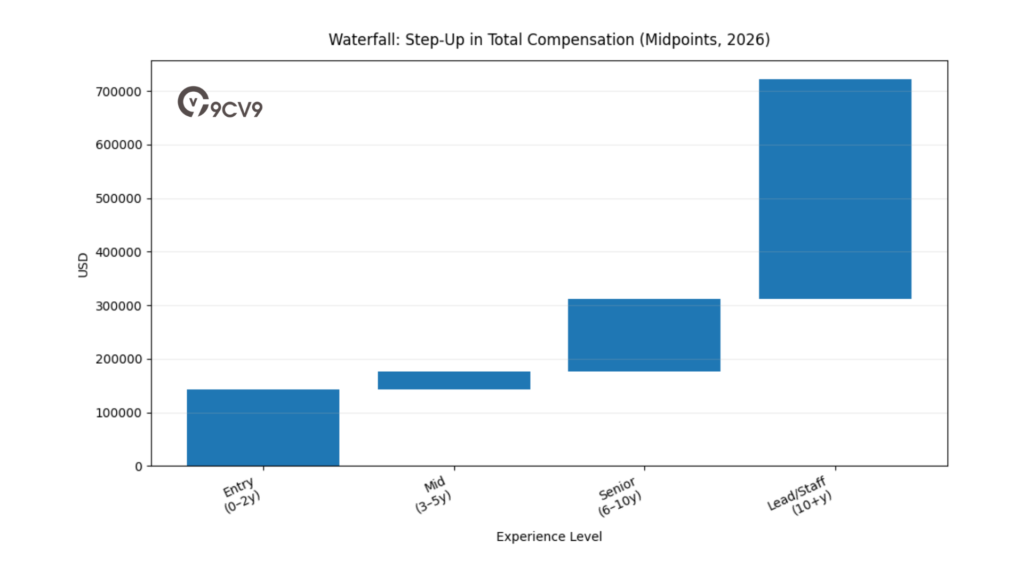
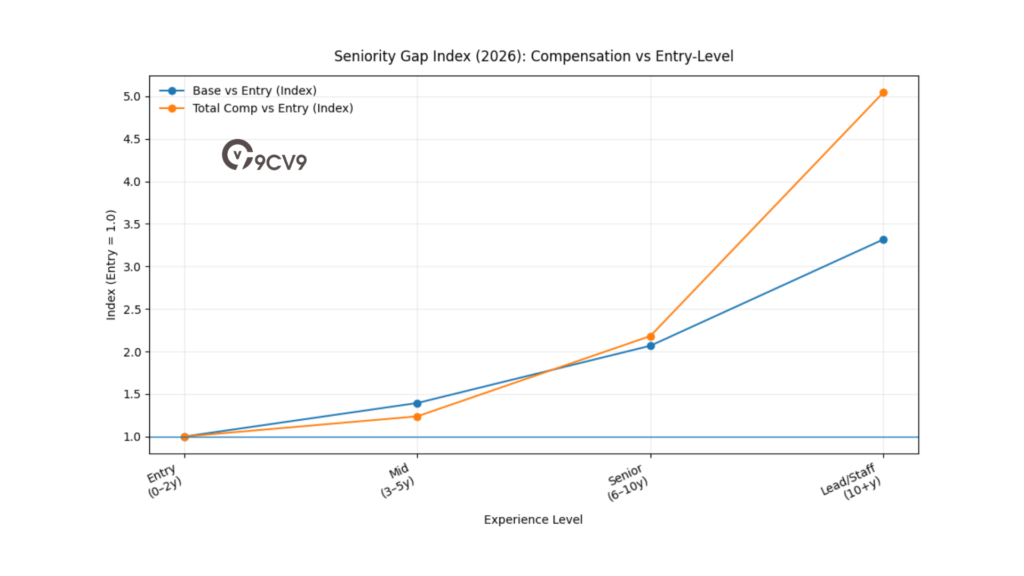
b. Experience-Based Progression and the Seniority Gap
The compensation structure for AI engineers in 2026 reveals a dramatic reshaping of traditional career ladders in software development. The entry barrier has moved upward, driven by rapid advancements in large language models, multimodal systems, autonomous agents, and enterprise AI deployment at scale. As organizations compete for specialized talent in machine learning engineering, model optimization, AI safety, and distributed training systems, salary bands have widened significantly across experience tiers.
Unlike traditional software roles, AI engineering compensation now reflects research depth, infrastructure expertise, model deployment experience, and domain-specific problem-solving capabilities. The result is a widening seniority gap that redefines how enterprises budget for AI workforce expansion.
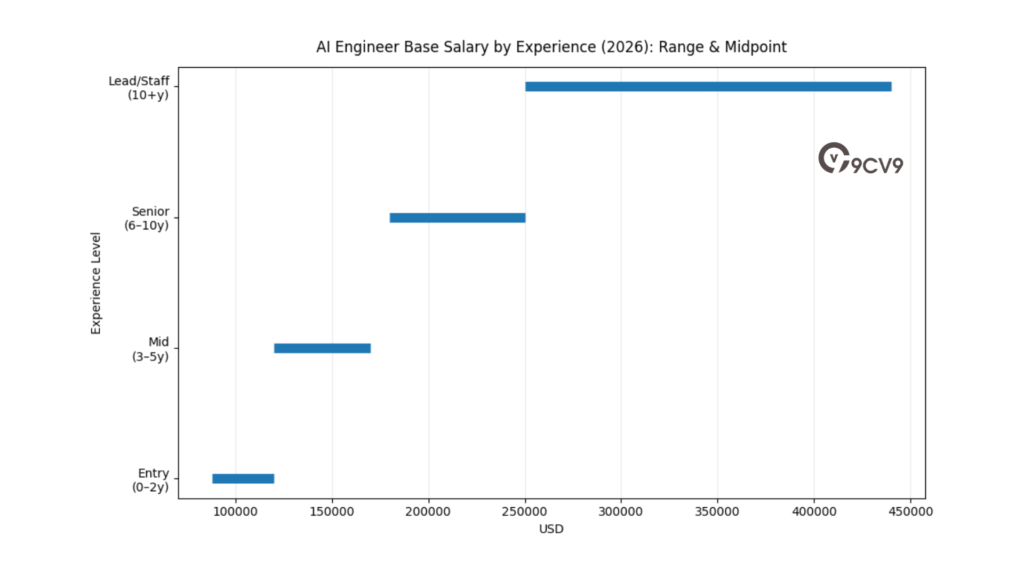
Experience-Based Salary Benchmarks for AI Engineers in 2026
The following table outlines global compensation averages for AI engineers across seniority levels. Figures represent aggregated benchmarks across North America and other high-demand markets.
| Experience Level | Base Salary Range (USD) | Total Compensation Range (USD) |
|---|---|---|
| Entry-Level (0–2 Years) | 88,000 – 120,000 | 113,000 – 173,000 |
| Mid-Level (3–5 Years) | 120,000 – 170,000 | 143,000 – 211,000 |
| Senior (6–10 Years) | 180,000 – 250,000 | 274,000 – 350,000 |
| Lead / Staff (10+ Years) | 250,000 – 440,000 | 500,000 – 943,000 |
Entry-Level AI Engineers: A Higher Starting Threshold
In 2026, entry-level AI engineers frequently enter the workforce with advanced degrees in machine learning, computational linguistics, robotics, or applied mathematics. Many possess hands-on experience with transformer architectures, distributed training pipelines, and MLOps frameworks prior to full-time employment.
Their base salaries now exceed the mid-career compensation of many traditional software developers. This shift reflects:
• The capital intensity of AI model training
• The strategic value of generative AI and automation
• The scarcity of candidates with production-scale AI deployment experience
• Increased academic-to-industry mobility
Organizations must now treat early-career AI engineers as strategic contributors rather than support-level hires.
Mid-Level AI Engineers: The Implementation Backbone
Professionals in the three-to-five-year range typically specialize in:
• Model fine-tuning and optimization
• Production ML system design
• AI infrastructure scaling
• Data pipeline engineering
• Enterprise model integration
Compensation in this band reflects both delivery capability and the ability to independently ship AI systems. Enterprises rely heavily on this cohort for model deployment velocity, yet competition remains intense due to rapid industry-wide adoption of AI capabilities.
Senior AI Engineers: The Strategic Execution Tier
The six-to-ten-year bracket represents the operational leadership layer within AI teams. These engineers are responsible for:
• Architecting end-to-end AI systems
• Overseeing distributed training environments
• Implementing AI safety and governance frameworks
• Leading model evaluation and benchmarking
• Designing scalable inference pipelines
Senior engineers command a substantial premium because they reduce failure risk, accelerate productization cycles, and mitigate compliance exposure. Many organizations now consider a base salary below 200,000 USD insufficient to attract top-tier senior AI talent in high-demand markets.
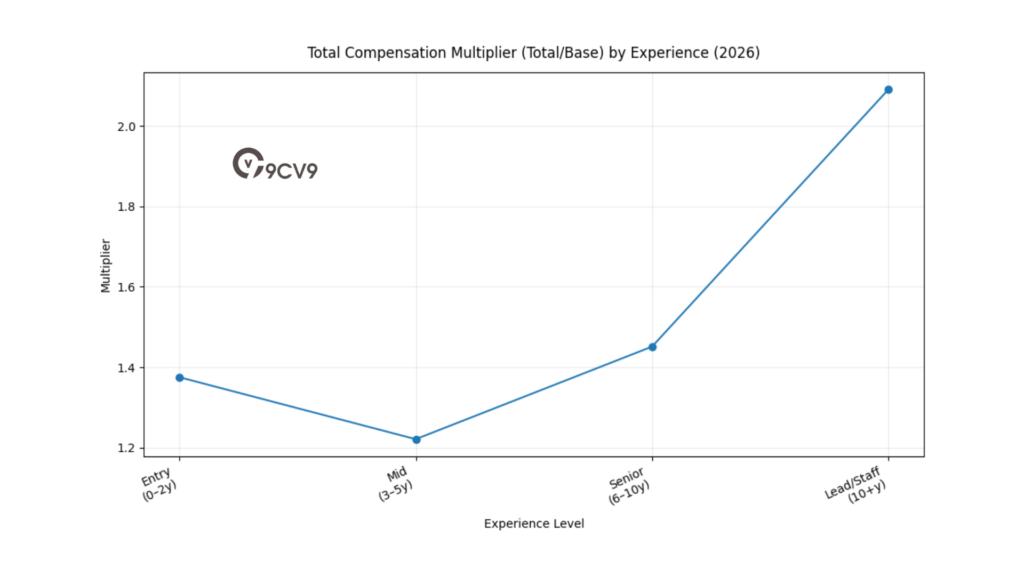
Lead and Staff AI Engineers: The Architect Premium
The most pronounced compensation expansion occurs at the Lead, Staff, and Principal levels. These professionals function as technical architects of the so-called “agentic surge,” overseeing complex AI ecosystems involving multi-agent systems, retrieval-augmented generation architectures, and enterprise-grade deployment frameworks.
Total compensation packages at this tier often include:
• Large equity grants
• Long-term incentive plans
• Research budgets
• Compute resource allocations
• Multi-year retention bonuses
The premium for staff and principal AI engineers over comparable non-AI technical roles averages approximately 78 percent. This reflects their influence over revenue-driving AI platforms and strategic automation initiatives.
The Seniority Gap: Structural Drivers
The widening compensation gap between junior and senior AI engineers stems from several structural factors:
Specialization Depth
Senior engineers possess advanced knowledge in reinforcement learning, distributed systems, model compression, inference optimization, and AI governance.
Revenue Leverage
Lead AI engineers often oversee systems that directly impact millions in revenue through automation, personalization, fraud detection, or optimization engines.
Risk Mitigation
AI system failures carry regulatory, ethical, and financial risks. Senior-level oversight reduces these exposures.
Talent Scarcity
The supply of engineers capable of building and maintaining large-scale AI systems remains limited relative to demand.
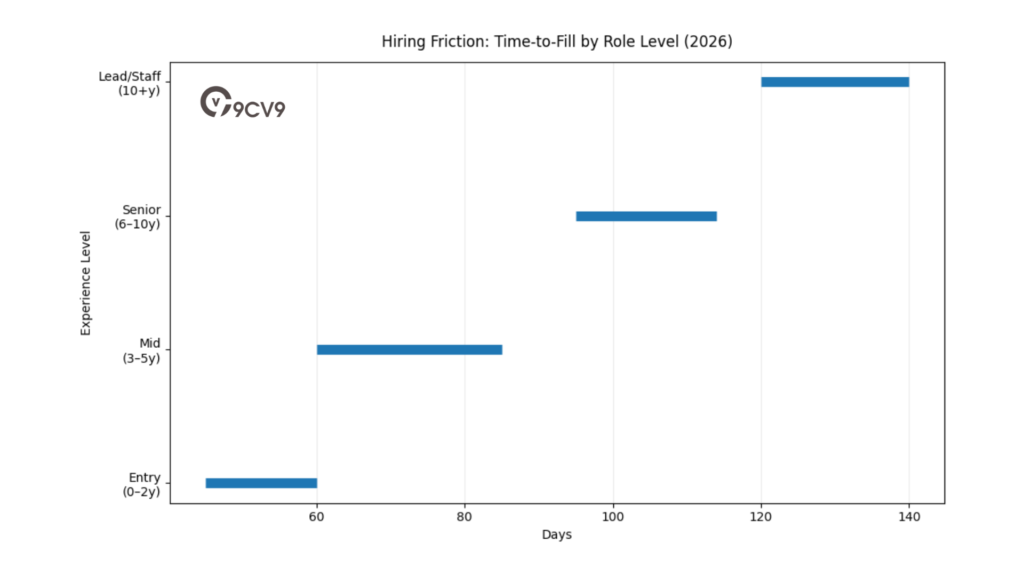
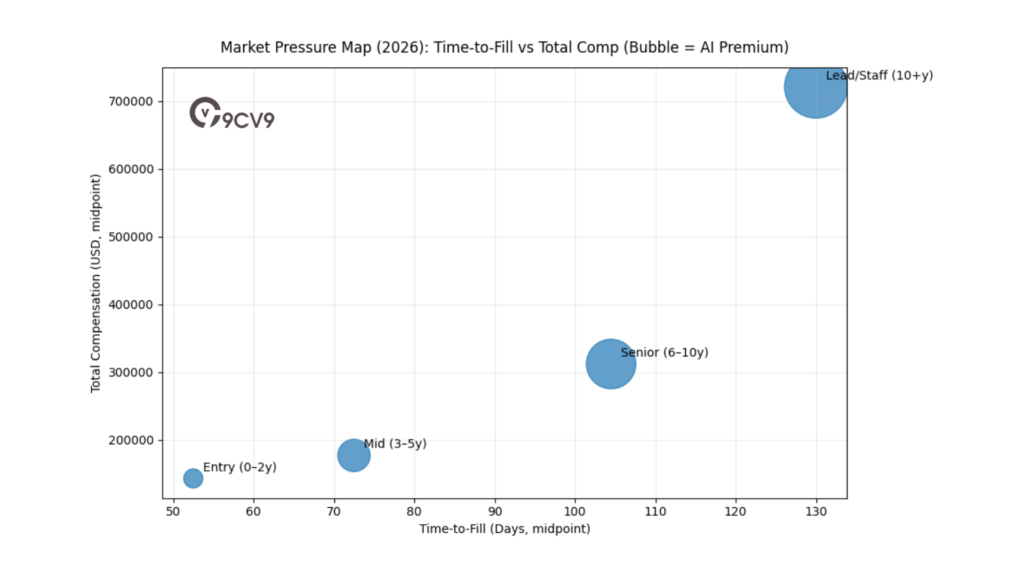
Time-to-Fill and the Cost of Waiting
Organizations that fail to meet competitive salary thresholds experience significant hiring delays. In 2026, the average time-to-fill for senior AI engineering roles has reached approximately 114 days in competitive markets.
The following table illustrates the operational cost implications of extended hiring cycles.
| Role Level | Average Time-to-Fill (Days) | Estimated Productivity Impact | Hiring Risk Level |
|---|---|---|---|
| Entry-Level | 45 – 60 | Moderate | Low |
| Mid-Level | 60 – 85 | High | Moderate |
| Senior | 95 – 114 | Very High | High |
| Lead / Staff | 120+ | Critical | Very High |
Extended vacancy periods result in:
• Delayed AI product launches
• Slower experimentation cycles
• Increased technical debt
• Elevated contractor dependency
• Competitive disadvantage
Organizations increasingly calculate the “cost of waiting” as exceeding the marginal salary increase required to secure top-tier talent.
Compensation Premium Matrix: AI vs Non-AI Technical Roles
| Seniority Level | Average Premium vs Traditional Software Roles |
|---|---|
| Entry-Level | 20 – 30% |
| Mid-Level | 35 – 50% |
| Senior | 60 – 70% |
| Lead / Staff | 75 – 90% |
The premium widens at higher seniority levels due to architectural responsibility, research integration, and AI governance expertise.
Strategic Implications for 2026 Hiring Budgets
The experience-based compensation curve for AI engineers in 2026 is steeper than any previous software specialization cycle. Organizations must budget not only for competitive base pay but also for retention incentives and growth pathways that prevent attrition to well-funded AI startups or hyperscale technology firms.
Successful hiring strategies increasingly include:
• Clear technical career progression frameworks
• Access to high-impact AI projects
• Compute resource support
• Conference and research participation funding
• Long-term equity alignment
As AI systems become embedded across core business operations, the value differential between junior implementers and senior architectural leaders will likely continue expanding. Companies that recognize and proactively budget for this seniority gap are better positioned to maintain AI innovation velocity and operational resilience through 2026 and beyond.
c. The Impact of Tech Giants on Local Market Rates
In 2026, global AI compensation benchmarks are heavily influenced by a small group of dominant technology corporations whose capital scale, infrastructure ownership, and AI research intensity shape local and international salary expectations. These organizations effectively function as wage-setters across major AI ecosystems. Their compensation frameworks ripple outward, influencing startup offers, venture-backed hiring budgets, and even public sector recruitment strategies.
As frontier AI systems become central to product differentiation and long-term enterprise value, established technology leaders have intensified their competition for generative AI engineers, infrastructure specialists, and hardware-accelerated computing experts. This has resulted in upward pressure on local market rates across North America, Western Europe, and Asia-Pacific innovation hubs.
Big Tech as Compensation Anchors
Leading companies such as Meta, Google, and Nvidia continue to define the upper boundary of AI engineering compensation in 2026. Their offers frequently exceed regional medians by substantial margins, particularly when equity and performance incentives are factored into total compensation.
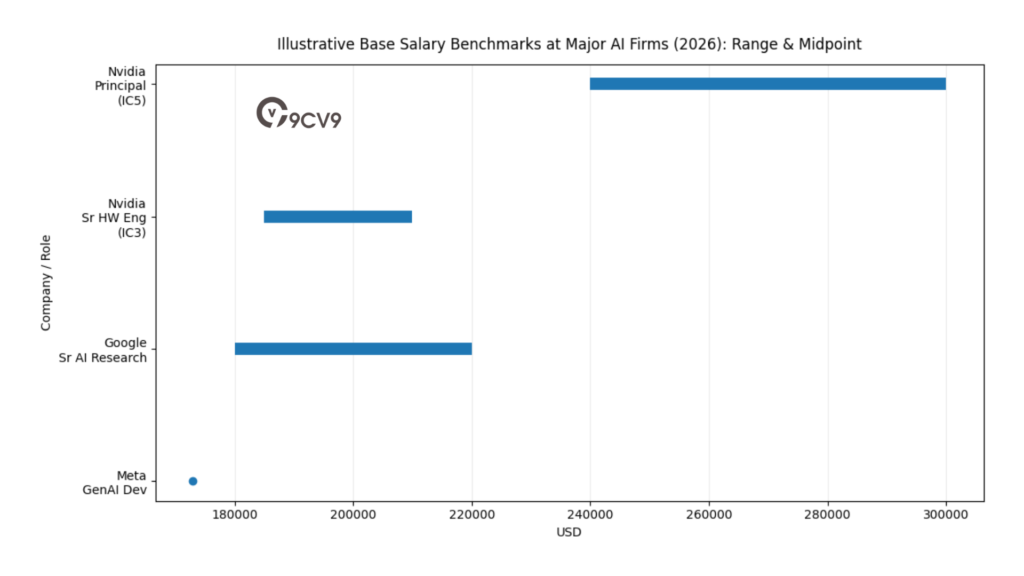
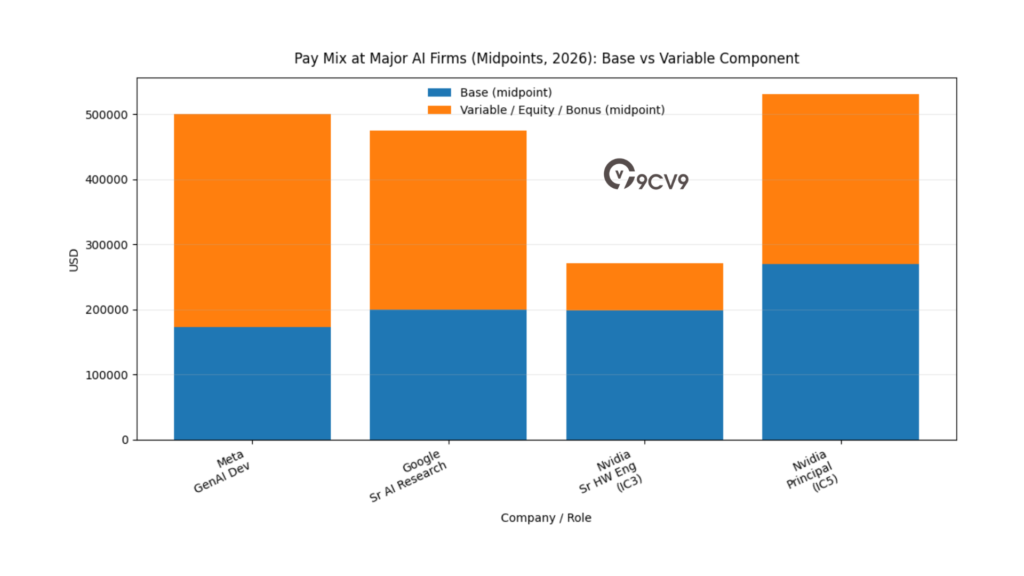
Illustrative Total Compensation Benchmarks at Major AI-Driven Firms (2026)
| Company | Role Type | Median Base Salary (USD) | Median Total Compensation (USD) | Key Compensation Drivers |
|---|---|---|---|---|
| Meta | Generative AI Developer | Up to 173,000 | 500,000+ | Equity grants, performance bonuses, retention awards |
| Senior AI Research Engineer | 180,000 – 220,000 | 350,000 – 600,000 | Stock units, research incentives, long-term vesting | |
| Nvidia | Senior Hardware Engineer (IC3) | 185,000 – 210,000 | ~271,000 | Stock appreciation, hardware R&D bonuses |
| Nvidia | Principal Engineer (IC5) | 240,000 – 300,000 | ~530,000 | Long-term equity, architecture leadership premiums |
These compensation structures typically include:
• Restricted stock units with multi-year vesting schedules
• Performance-based bonuses tied to AI product milestones
• Signing bonuses exceeding six figures in competitive cases
• Retention grants to prevent poaching
• Research autonomy incentives
Because equity appreciation can significantly inflate total compensation, mid-career AI engineers at these firms may earn more than executive leaders in non-AI sectors.
Local Market Ripple Effects
The presence of large AI-driven firms in a region materially alters salary expectations across the entire ecosystem. The following matrix illustrates how Big Tech hiring impacts local labor markets.
Big Tech Compensation Impact Matrix (2026)
| Market Condition | Salary Inflation Level | Hiring Pressure on Mid-Sized Firms | Talent Mobility Risk |
|---|---|---|---|
| Big Tech R&D Hub Present | Very High | Severe | High |
| Satellite Engineering Office | High | Elevated | Moderate to High |
| Remote Hiring from Region | Moderate | Moderate | Moderate |
| No Big Tech Physical Presence | Low to Moderate | Manageable | Low |
In major AI hubs such as San Francisco and Seattle, Big Tech offers raise local compensation baselines by 20–40 percent compared to regions without hyperscale presence. This dynamic has forced smaller firms to rethink compensation beyond traditional salary-plus-equity packages.
The Emergence of “Compute Equity”
In response to aggressive Big Tech compensation packages, mid-sized AI firms and venture-backed startups have introduced alternative value propositions. One of the most notable trends in 2026 is the rise of “Compute Equity.”
Compute Equity refers to guaranteed access to high-performance GPU clusters, often powered by Nvidia’s H100 or B200 hardware, as part of the compensation package. Instead of competing solely on cash or stock grants, companies provide engineers with:
• Dedicated GPU allocation quotas
• Priority access to large-scale training clusters
• Research compute budgets
• Experimentation freedom with minimal bureaucratic overhead
For AI engineers focused on building large models or conducting experimental research, compute access can be as valuable as financial incentives. In many cases, access to robust GPU infrastructure directly influences career trajectory, publication opportunities, and innovation velocity.
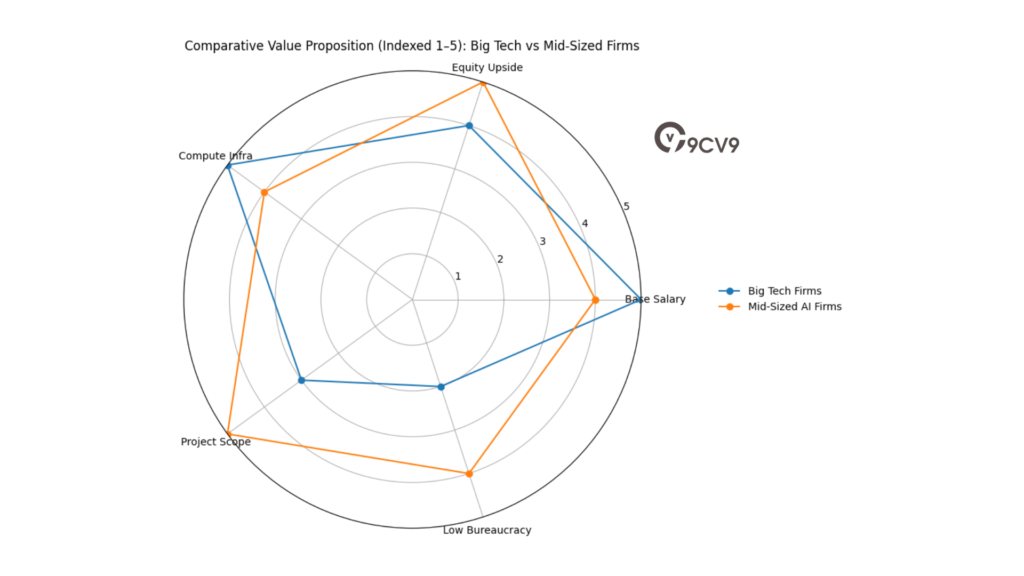
Comparative Value Proposition: Big Tech vs Growth-Stage Firms
| Compensation Component | Big Tech Firms | Mid-Sized AI Firms | Strategic Appeal to Engineers |
|---|---|---|---|
| Base Salary | Very High | High | Financial Stability |
| Equity Upside | High | Very High (Risk-Adjusted) | Long-Term Wealth Creation |
| Compute Infrastructure | Extensive | Targeted / Allocated | Research Autonomy |
| Project Scope | Structured | Flexible / Experimental | Innovation Speed |
| Bureaucracy Level | Moderate to High | Low to Moderate | Creative Freedom |
While Big Tech firms dominate in financial scale, smaller organizations increasingly differentiate through:
• Faster shipping cycles
• Direct impact visibility
• Greater ownership over AI system architecture
• Entrepreneurial environment
The Senior Talent Escalation Effect
The competitive escalation is particularly intense for senior and principal-level AI engineers. These professionals often receive multiple concurrent offers, with total compensation packages approaching or exceeding half a million dollars annually in high-demand markets.
The resulting labor dynamics include:
• Rapid salary benchmarking adjustments
• Escalating counter-offer cycles
• Shortened retention windows
• Increased reliance on international hiring
Enterprises that fail to match either financial or infrastructure-based incentives experience extended hiring cycles and increased attrition risk.
Strategic Implications for 2026 AI Hiring
The influence of Meta, Google, Nvidia, and other hyperscale AI leaders extends beyond individual compensation packages. Their hiring activity sets psychological benchmarks for what elite AI talent considers “market rate.” As a result:
• Startups must budget 25–40 percent above historical software engineering averages
• Mid-sized firms increasingly use hybrid compensation strategies
• Global organizations leverage geographic arbitrage to offset Big Tech inflation
• Retention programs now include long-term research incentives
In 2026, the AI labor market operates within a competitive environment shaped by infrastructure ownership, equity liquidity, and compute dominance. Organizations that understand the structural impact of Big Tech wage-setting behavior are better positioned to craft differentiated compensation strategies capable of attracting and retaining top AI engineering talent in an increasingly constrained global market.
2. The European Divide: High-Cost Hubs vs. Eastern Arbitrage
a. Western and Central European Compensation Structures
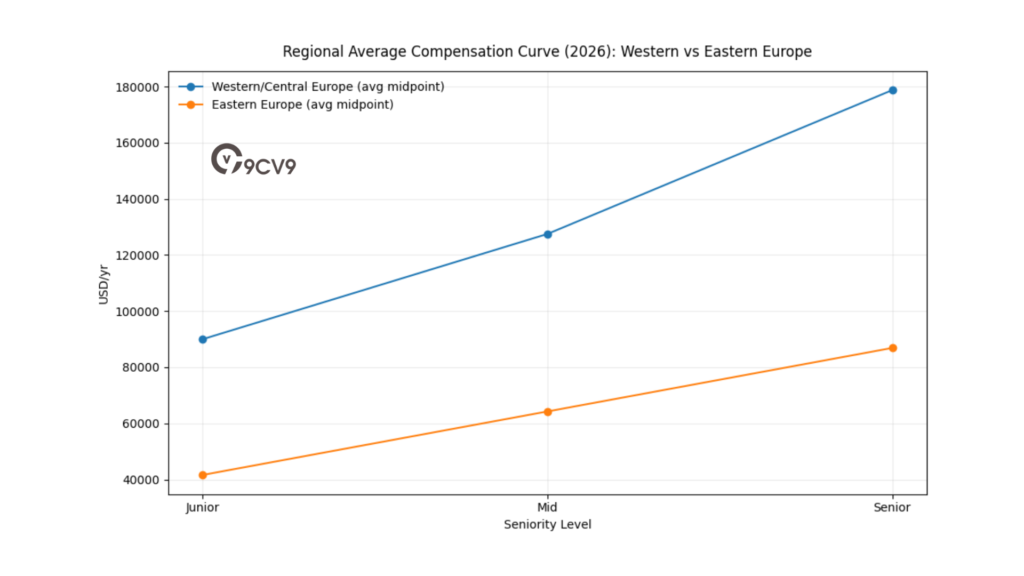
In 2026, Europe presents a distinctly bifurcated AI talent landscape. On one side are mature, high-cost Western European innovation centers characterized by strong labor protections, structured compensation frameworks, and advanced enterprise AI adoption. On the other side are rapidly maturing Eastern European markets that have become the backbone of remote-first AI workforce arbitrage strategies.
This divide has created a dual-track hiring model across the continent. Enterprises seeking regulatory stability, proximity to financial institutions, or integration with established research ecosystems gravitate toward Western Europe. Meanwhile, organizations focused on cost efficiency, distributed teams, and scalable AI engineering capacity increasingly leverage Eastern European talent pools.
Western and Central Europe: Structured but Expensive AI Hiring Markets
Western Europe in 2026 offers predictability, strong infrastructure, and access to advanced enterprise customers. However, compensation levels are significantly higher than global medians, particularly in Switzerland, the United Kingdom, Germany, and the Netherlands.
Switzerland stands as the most expensive AI hiring market in Europe. Compensation levels in Zurich and Geneva often rival second-tier US technology hubs. Employers in Switzerland typically provide strong social benefits, mandatory pension contributions, and competitive relocation packages, further increasing total employment cost.
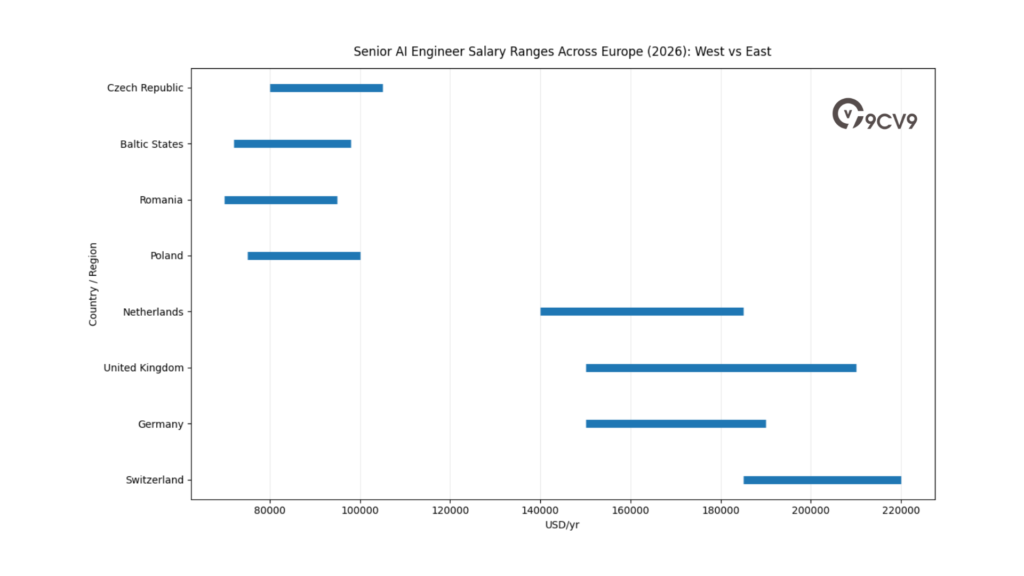
Western and Central European AI Salary Benchmarks (2026)
| Country / Region | Junior Salary (USD/yr) | Mid-Level Salary (USD/yr) | Senior Salary (USD/yr) |
|---|---|---|---|
| Switzerland (CHF) | 108,000 – 125,000 | 140,000 – 160,000 | 185,000 – 220,000 |
| Germany (EUR) | 70,000 – 92,000 | 105,000 – 130,000 | 150,000 – 190,000 |
| United Kingdom (GBP) | 75,000 – 95,000 | 110,000 – 145,000 | 150,000 – 210,000 |
| Netherlands (EUR) | 68,000 – 87,000 | 95,000 – 135,000 | 140,000 – 185,000 |
Switzerland: Europe’s Premium AI Compensation Market
Switzerland leads the continent in AI compensation due to:
• Strong financial services demand for AI risk modeling
• Pharmaceutical and biotech AI research
• Advanced robotics and automation industries
• High purchasing power and cost of living
In Zurich and Geneva, senior AI engineers frequently earn compensation comparable to US Tier 2 markets, making Switzerland the most expensive AI hiring environment in Europe.
Germany: Industrial AI and Engineering Premium
Germany’s AI compensation is shaped by its industrial backbone. While the average annual gross salary for general software developers is approximately €73,000 (around $78,800), AI-specific roles in Munich and Berlin command a 20–30 percent premium above this baseline.
This premium is driven by:
• Automotive AI and autonomous systems development
• Manufacturing optimization through machine learning
• Enterprise AI adoption among large industrial conglomerates
• Strong data privacy and regulatory frameworks
The result is a competitive but structured compensation environment, often supplemented by strong benefits and job security provisions.
United Kingdom: London’s Talent Concentration Effect
London remains the dominant AI hub in Europe, housing approximately 31 percent of the continent’s qualified AI talent. The city’s ecosystem is supported by fintech, healthtech, venture capital density, and research universities.
Despite elevated housing and living costs, mid-to-senior AI engineers in London can still achieve annual savings in the range of €35,000 to €40,000 after taxes and living expenses. This sustained savings capacity contributes to continued talent retention, even amid cost-of-living pressures.
The Netherlands: Innovation Efficiency with Structured Compensation
Amsterdam has positioned itself as a balanced AI market, offering:
• Strong English-language business environment
• Progressive tech policies
• Growing startup ecosystem
• Proximity to EU enterprise customers
Compensation levels remain below Switzerland and London but continue rising as enterprise AI adoption accelerates.
Eastern Europe: The Rise of Remote-First Arbitrage
In contrast to Western Europe’s structured high-cost environment, Eastern Europe has matured into a primary source of distributed AI engineering capacity. Countries such as Poland, Romania, and the Baltic states have invested heavily in STEM education, producing strong algorithmic and mathematical talent.
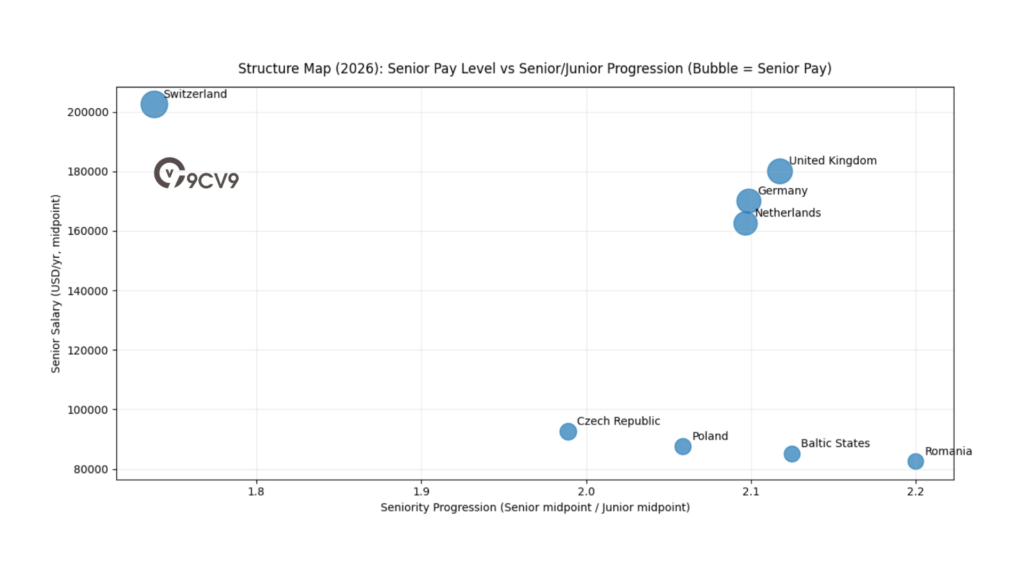
Eastern Europe AI Salary Benchmarks (2026)
| Country | Junior Salary (USD/yr) | Mid-Level Salary (USD/yr) | Senior Salary (USD/yr) |
|---|---|---|---|
| Poland | 35,000 – 50,000 | 55,000 – 75,000 | 75,000 – 100,000 |
| Romania | 30,000 – 45,000 | 50,000 – 70,000 | 70,000 – 95,000 |
| Baltic States | 32,000 – 48,000 | 52,000 – 72,000 | 72,000 – 98,000 |
| Czech Republic | 38,000 – 55,000 | 60,000 – 80,000 | 80,000 – 105,000 |
These markets offer salary levels 40–60 percent below Western European hubs while maintaining high technical competency in:
• Computer vision
• Natural language processing
• Applied machine learning
• Data engineering and MLOps
The Remote-First Arbitrage Model
Global companies increasingly adopt a hybrid European hiring model:
European AI Hiring Strategy Matrix (2026)
| Hiring Objective | Western Europe Use Case | Eastern Europe Use Case |
|---|---|---|
| Regulatory-sensitive AI projects | High suitability | Moderate suitability |
| Enterprise client proximity | High | Low to Moderate |
| Cost optimization | Low | Very High |
| Large distributed engineering team | Moderate | High |
| Advanced research collaboration | High | Moderate |
Organizations often maintain a small senior leadership or research presence in London, Berlin, or Zurich while building larger engineering teams in Warsaw, Bucharest, or Prague. This blended approach balances cost control with strategic positioning.
Savings Differential and Strategic Budget Allocation
A company hiring ten senior AI engineers in Switzerland could incur salary expenses exceeding 2 million USD annually. The same team assembled in Eastern Europe may cost between 800,000 and 1.1 million USD, representing substantial budget efficiency.
However, cost savings must be weighed against:
• Time zone coordination
• Regulatory alignment
• Data residency requirements
• Client proximity expectations
Strategic Implications for 2026 AI Hiring in Europe
The European AI hiring market in 2026 is no longer a unified ecosystem. Instead, it operates as a dual structure:
• Western Europe provides stability, regulatory compliance, and enterprise integration
• Eastern Europe delivers scalable, cost-efficient technical depth
Companies that successfully integrate both models are achieving optimal cost-performance ratios. As AI adoption expands across banking, manufacturing, climate technology, and healthcare in Europe, this bifurcated hiring strategy is expected to remain the dominant model through 2027 and beyond.
b. Eastern European Efficiency and the B2B Contractor Model
Eastern Europe continues to represent the most cost-efficient region globally for sourcing high-quality AI engineering talent in 2026. Countries such as Poland, Romania, and Serbia have matured beyond traditional outsourcing models and now serve as strategic AI development hubs for global enterprises. The region combines strong STEM education systems, deep mathematical foundations, and competitive cost structures, making it central to remote-first AI workforce strategies.
While Western Europe and North America set compensation ceilings, Eastern Europe delivers scalable engineering depth at significantly lower total employment costs. In many cases, salary levels remain approximately 60–70 percent lower than comparable roles in the United States, even as technical quality remains competitive.
Eastern Europe AI Salary Benchmarks (2026)
| Eastern European Region | Entry-Level (USD/yr) | Mid-Level (USD/yr) | Senior / Lead (USD/yr) |
|---|---|---|---|
| Poland / Romania / Serbia | 24,000 – 33,600 | 36,000 – 50,400 | 54,000 – 90,000 |
| Regional Median (Total Comp) | 35,000 – 45,000 | 50,000 – 70,000 | 80,000 – 110,000 |
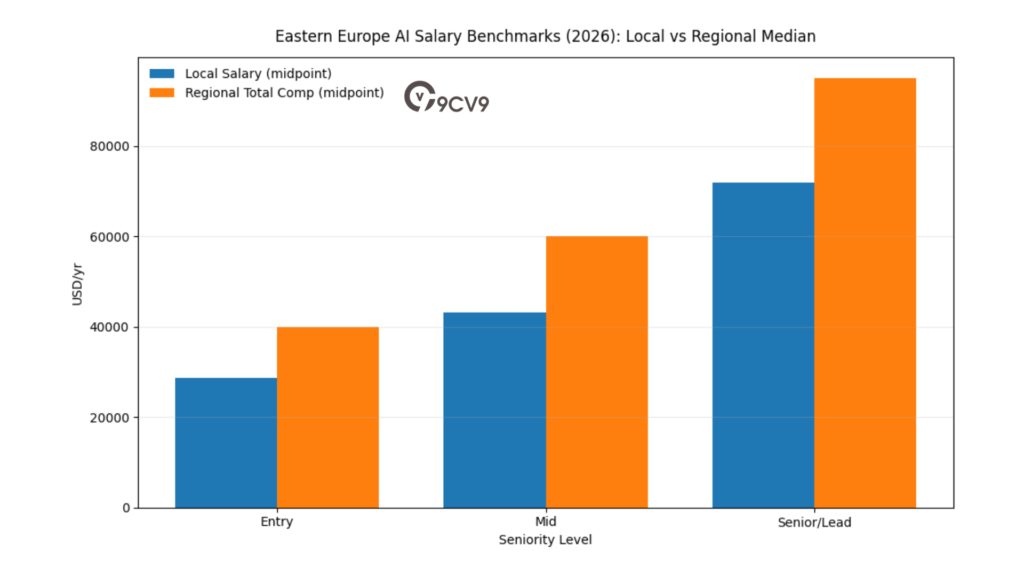
These benchmarks reflect locally employed engineers under domestic salary structures. However, the most significant transformation in 2026 is not local employment, but cross-border B2B contracting.
The Remote-First Arbitrage Model
Senior AI engineers in Poland, Romania, and Serbia increasingly operate as independent B2B contractors serving US, UK, Swiss, or German firms. Under this model, engineers invoice foreign employers while residing locally, allowing companies to reduce payroll tax burdens and bypass certain regulatory overheads.
A senior AI engineer residing in Eastern Europe may earn between 100,000 and 140,000 USD annually through cross-border contracts. For employers in the United States or Switzerland, this represents a substantial discount relative to domestic senior compensation, which can exceed 200,000 USD in base salary alone.
From the engineer’s perspective, the purchasing power differential is transformative.
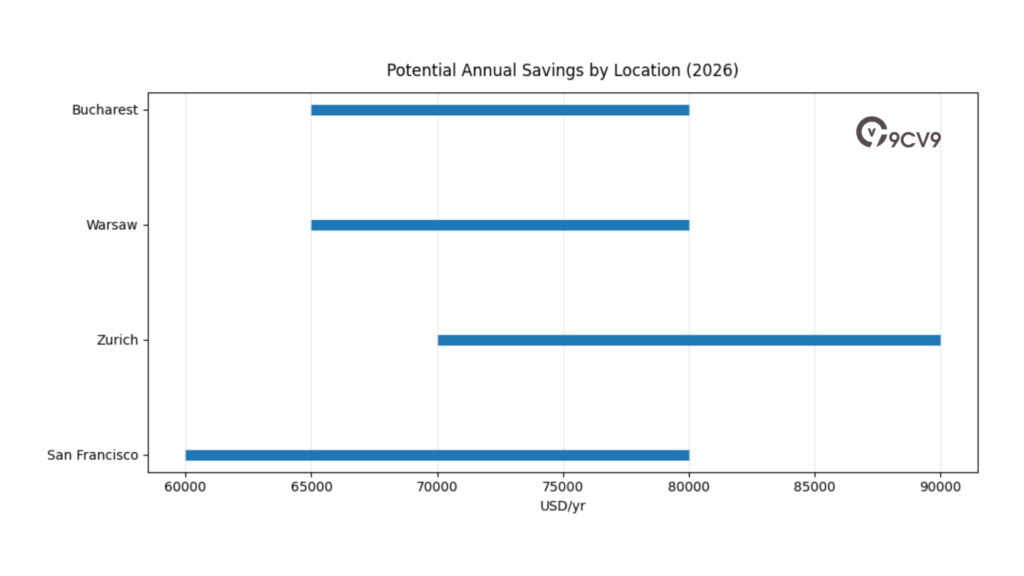
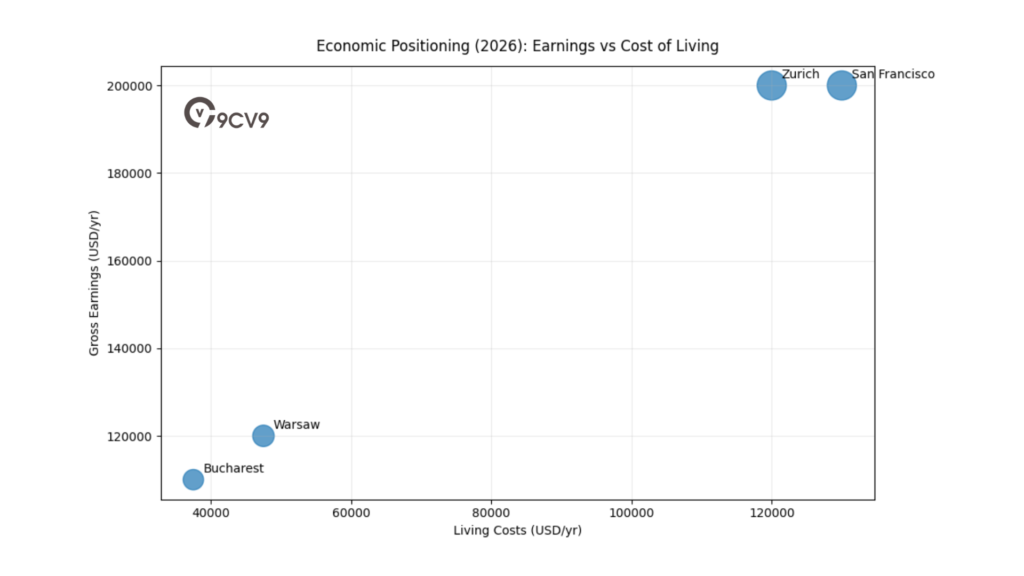
Cost-of-Living and Purchasing Power Comparison (Illustrative Example)
| Location of Residence | Gross Annual Earnings (USD) | Estimated Living Costs (USD) | Potential Annual Savings (USD) |
|---|---|---|---|
| San Francisco | 200,000 | 120,000 – 140,000 | 60,000 – 80,000 |
| Zurich | 200,000 | 110,000 – 130,000 | 70,000 – 90,000 |
| Warsaw | 120,000 | 40,000 – 55,000 | 65,000 – 80,000 |
| Bucharest | 110,000 | 30,000 – 45,000 | 65,000 – 80,000 |
Although the nominal salary is lower than in US hyper-hubs, net savings and quality-of-life outcomes can be equal or superior. This economic dynamic has made remote-first arbitrage a structural feature of the 2026 AI labor market.
The B2B Contractor Advantage
One of the defining characteristics of Eastern European AI hiring is the widespread use of B2B contractor agreements. In Poland, for example, many engineers operate as sole proprietors under simplified taxation frameworks. Lump-sum taxation options and flat-rate income schemes can materially increase net take-home pay compared to traditional employment models.
Key structural benefits of the B2B model include:
• Lower effective tax rates compared to salaried employment
• Reduced employer payroll obligations
• Flexibility in contract duration and scope
• Simplified cross-border invoicing
• Greater negotiation leverage for experienced engineers
This structure enables highly skilled AI engineers to retain a larger share of gross earnings while offering global employers cost savings relative to domestic hiring.
Eastern Europe vs United States: Cost Efficiency Matrix
| Factor | United States (Hyper-Hub) | Eastern Europe (B2B Model) |
|---|---|---|
| Senior Base Salary | 180,000 – 250,000 | 100,000 – 140,000 (remote) |
| Employer Payroll Taxes | High | Minimal (contract model) |
| Cost of Living | Very High | Moderate to Low |
| Net Savings Potential | Moderate | High |
| Talent Retention Risk | High (competitive market) | Moderate |
For global enterprises, Eastern Europe offers:
• Access to senior AI engineers at 30–50 percent lower total cost
• Strong mathematical and algorithmic expertise
• Time zone overlap with Western Europe
• Cultural alignment with EU and US business norms
Risks and Considerations
Despite its efficiency advantages, the Eastern European model requires structured management. Organizations must account for:
• Cross-border compliance requirements
• Data security and intellectual property protection
• Long-term contractor retention planning
• Geopolitical stability considerations
Additionally, as more US and Swiss firms adopt remote-first hiring strategies, salary expectations within Eastern Europe are gradually rising, particularly for top-tier AI specialists.
Strategic Outlook for 2026 and Beyond
Eastern Europe has transitioned from an outsourcing destination to a strategic AI engineering partner region. The combination of strong technical education, favorable tax structures, and remote-first flexibility has institutionalized the B2B contractor model as a mainstream hiring approach.
For organizations seeking to balance cost control with technical excellence, Eastern Europe remains one of the most attractive AI hiring regions globally. The remote-first arbitrage dynamic is expected to persist, although narrowing wage differentials may gradually compress the extreme cost advantages observed earlier in the decade.
In the evolving global AI labor economy of 2026, Eastern Europe stands as a prime example of how distributed talent markets can challenge traditional salary ceilings while delivering sustainable economic benefits to both employers and engineers.
3. Asia-Pacific and the Southeast Asian Growth Engine
a. Singapore: The Asian Compensation Ceiling
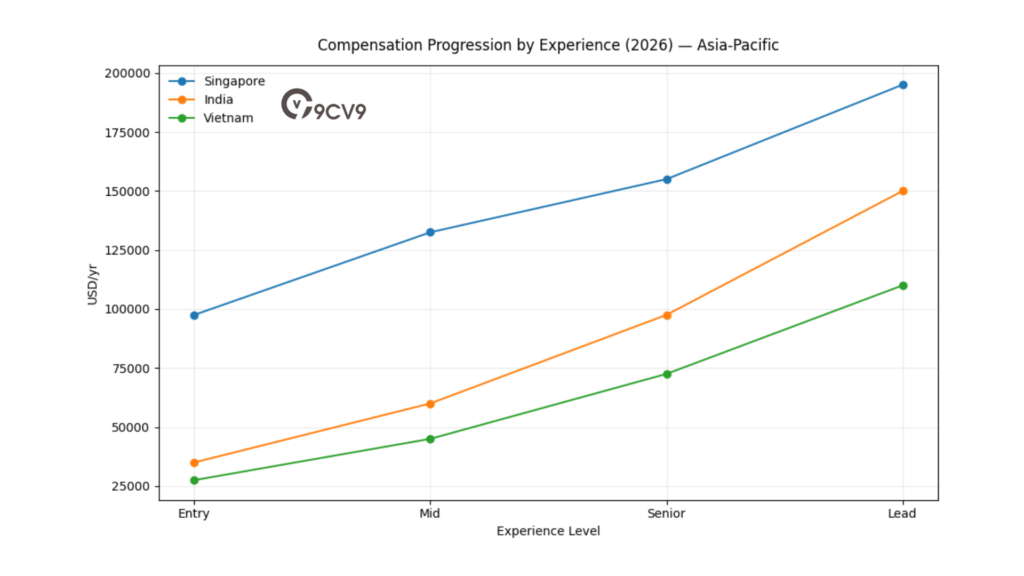
The Asia-Pacific AI hiring landscape in 2026 is defined by a dual dynamic: Singapore functions as the region’s compensation ceiling and strategic command center, while India and Vietnam operate as scalable talent engines driving cost-efficient AI development.
Rapid enterprise AI adoption across fintech, digital banking, e-commerce, logistics, telecommunications, and government modernization initiatives has accelerated demand across the region. However, salary benchmarks vary widely depending on economic maturity, infrastructure investment, and domestic talent supply.
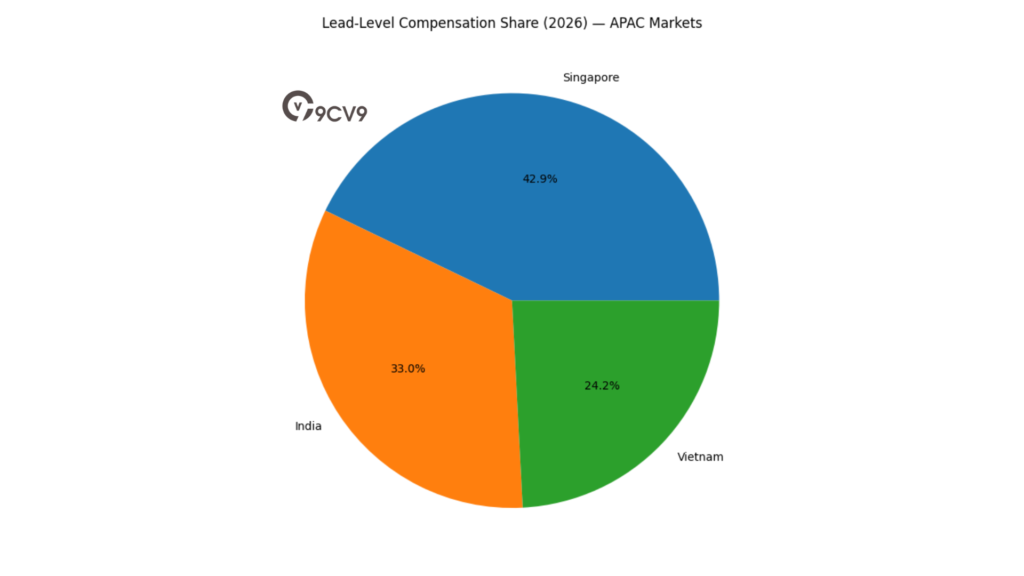
Singapore: The Asian Compensation Ceiling
Singapore leads Asia in AI engineering compensation and serves as the region’s premium innovation hub. Its strategic focus on financial technology, sovereign AI infrastructure, regulatory technology, and public-sector automation has created a tightly constrained talent market where demand persistently exceeds supply.
The city-state’s limited domestic labor pool, strong foreign investment inflows, and concentration of regional headquarters for global technology firms have elevated salary levels well above other Asian markets.
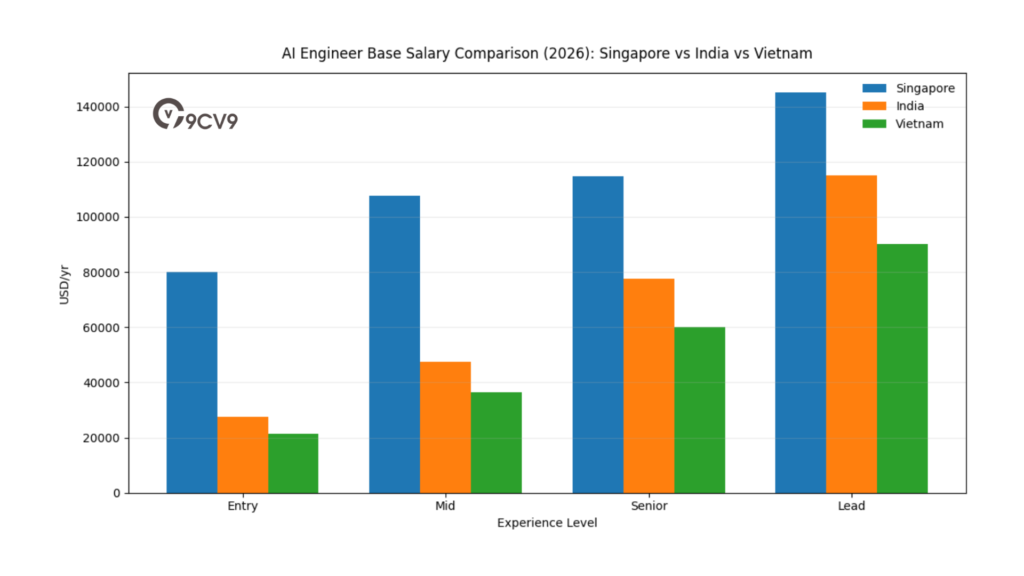
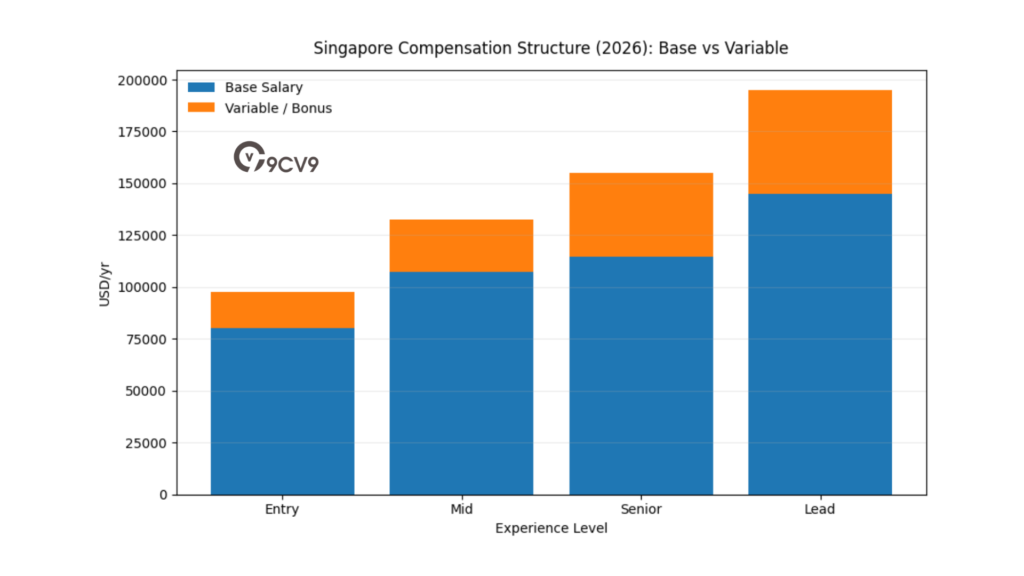
Singapore AI Salary Benchmarks (2026)
| Experience Level | Average Base Salary (USD) | Average Total Compensation (USD) |
|---|---|---|
| Entry-Level | 70,000 – 90,000 | 85,000 – 110,000 |
| Mid-Level | 95,000 – 120,000 | 120,000 – 145,000 |
| Senior | 114,852 (average) | Up to 155,000+ |
| Lead / Principal | 130,000 – 160,000 | 170,000 – 220,000 |
Several structural factors contribute to Singapore’s elevated compensation levels:
• Strong fintech and digital banking ecosystem
• Government-led AI modernization initiatives
• High cost of living and housing
• Regional headquarters concentration
• Aggressive competition for experienced AI architects
Unlike larger labor markets, Singapore cannot easily scale domestic AI talent supply. As a result, companies rely on expatriate hiring and cross-border relocation packages, which further increase total employment costs.
India: The Scale Engine of Asia-Pacific AI
India has emerged as the region’s largest AI talent reservoir. With strong engineering education pipelines and expanding startup ecosystems in Bangalore, Hyderabad, and Pune, the country has transitioned from IT services outsourcing to advanced AI system development.
India AI Salary Benchmarks (2026)
| Experience Level | Average Base Salary (USD) | Average Total Compensation (USD) |
|---|---|---|
| Entry-Level | 20,000 – 35,000 | 25,000 – 45,000 |
| Mid-Level | 35,000 – 60,000 | 45,000 – 75,000 |
| Senior | 60,000 – 95,000 | 75,000 – 120,000 |
| Lead / Architect | 90,000 – 140,000 | 120,000 – 180,000 |
India’s advantages include:
• Large annual STEM graduate output
• Mature IT services infrastructure
• Rapid AI startup growth
• Expanding cloud adoption
• Strong English-language proficiency
While salaries remain significantly lower than Singapore or Western markets, top-tier AI engineers in India are increasingly receiving global remote offers, particularly from US and UK firms.
Vietnam: Southeast Asia’s Emerging AI Growth Hub
Vietnam is rapidly positioning itself as a high-growth AI talent hub within Southeast Asia. Ho Chi Minh City and Hanoi have seen increasing AI-focused startup formation, enterprise digitalization projects, and foreign direct investment.
Vietnam AI Salary Benchmarks (2026)
| Experience Level | Average Base Salary (USD) | Average Total Compensation (USD) |
|---|---|---|
| Entry-Level | 15,000 – 28,000 | 20,000 – 35,000 |
| Mid-Level | 28,000 – 45,000 | 35,000 – 55,000 |
| Senior | 45,000 – 75,000 | 55,000 – 90,000 |
| Lead / Specialist | 70,000 – 110,000 | 90,000 – 130,000 |
Vietnam’s competitive positioning is driven by:
• Rapid digital economy growth
• Government support for AI and semiconductor initiatives
• Lower cost of living relative to Singapore
• Increasing participation in global remote workforce models
While the absolute compensation levels remain lower than India for top-tier roles, Vietnam’s AI ecosystem is expanding quickly, particularly in computer vision, applied NLP, and embedded AI systems.
Asia-Pacific Cost and Capability Matrix (2026)
| Market | Compensation Level | Talent Scale | Ecosystem Maturity | Strategic Hiring Use Case |
|---|---|---|---|---|
| Singapore | Very High | Limited | Advanced | Regional HQ, fintech AI, regulated industries |
| India | Moderate | Very Large | Rapidly Expanding | Large distributed AI teams, enterprise AI deployment |
| Vietnam | Low to Moderate | Growing | Emerging | Cost-optimized AI development, regional scaling |
| Australia | High | Moderate | Mature | Enterprise and research-driven AI projects |
Regional Strategic Dynamics
Singapore sets the compensation ceiling in Asia-Pacific much like US hyper-hubs define global benchmarks. However, India and Vietnam provide the scalable workforce necessary for sustained AI deployment.
Companies increasingly apply a layered regional strategy:
• Maintain senior AI leadership or regulatory-sensitive functions in Singapore
• Build large engineering teams in India
• Establish growth-stage AI labs or satellite teams in Vietnam
This blended approach enables organizations to balance regulatory stability, innovation velocity, and cost efficiency.
Outlook for 2026 and Beyond
Asia-Pacific’s AI labor market will continue expanding as digital transformation accelerates across banking, telecommunications, logistics, manufacturing, and government services.
Singapore is expected to remain the premium compensation leader due to structural labor constraints and strong financial sector demand. Meanwhile, India and Vietnam will likely see steady wage growth as global remote hiring increases competition for top-tier engineers.
In 2026, Asia-Pacific represents not a single market, but an interconnected AI growth engine—anchored by Singapore’s high-cost leadership and powered by the scalable talent ecosystems of India and Southeast Asia.
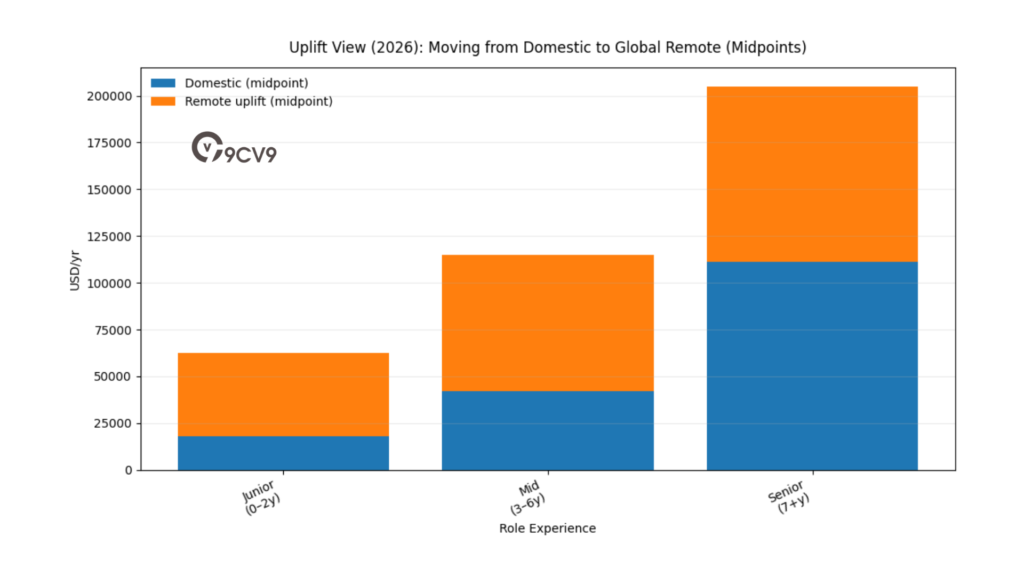
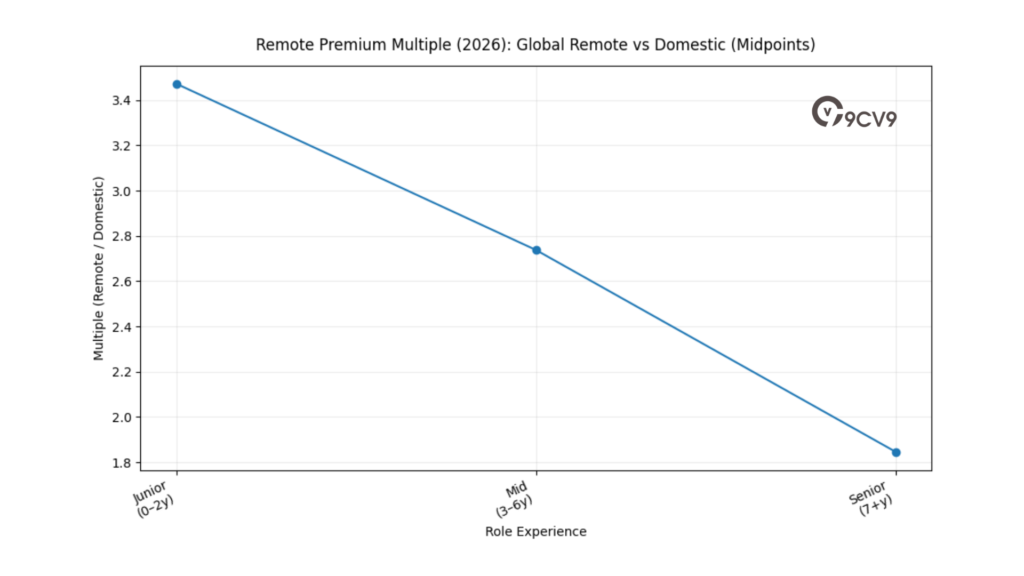
b. India: Domestic Rates vs. Global-Remote Parity
In 2026, India’s AI labor market operates on two clearly differentiated compensation tracks. On one track are domestically employed AI engineers working for Indian enterprises, multinational subsidiaries, and fast-scaling startups. On the second track are senior AI professionals engaged in global remote contracts, earning compensation aligned with international 70th–80th percentile benchmarks.
This dual structure has reshaped income distribution within India’s AI ecosystem. While domestic salary bands remain cost-efficient by global standards, cross-border remote employment has significantly elevated earning potential for top-tier engineers.
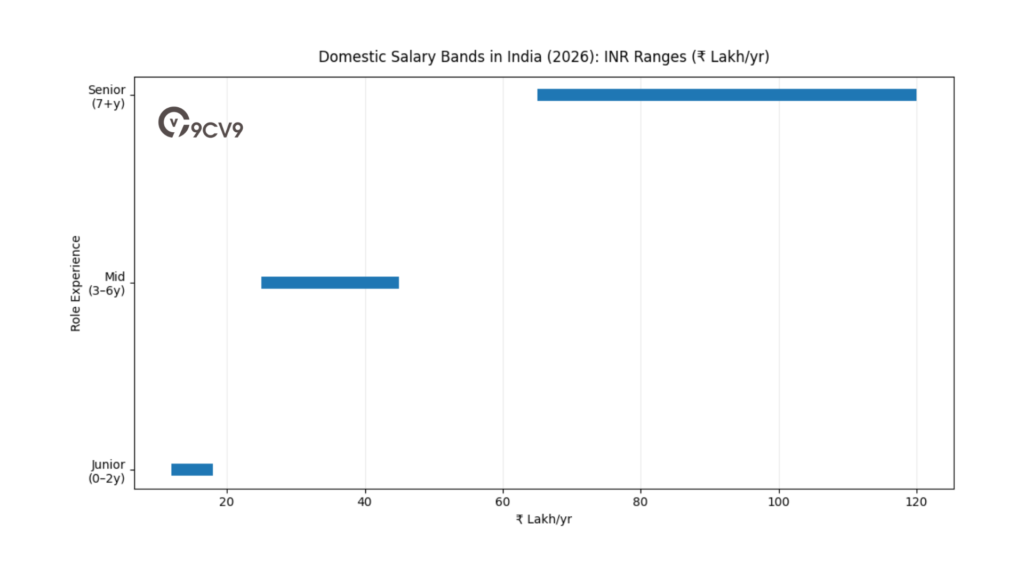
Domestic vs Global-Remote AI Salary Benchmarks in India (2026)
| Role Experience | Domestic Salary (INR) | Domestic (USD Equivalent) | Global Remote (USD) |
|---|---|---|---|
| Junior (0–2 Years) | ₹12L – ₹18L | 14,400 – 21,600 | 50,000 – 75,000 |
| Mid-Level (3–6 Years) | ₹25L – ₹45L | 30,000 – 54,000 | 90,000 – 140,000 |
| Senior (7+ Years) | ₹65L – ₹1.2Cr+ | 78,000 – 144,000 | 160,000 – 250,000+ |
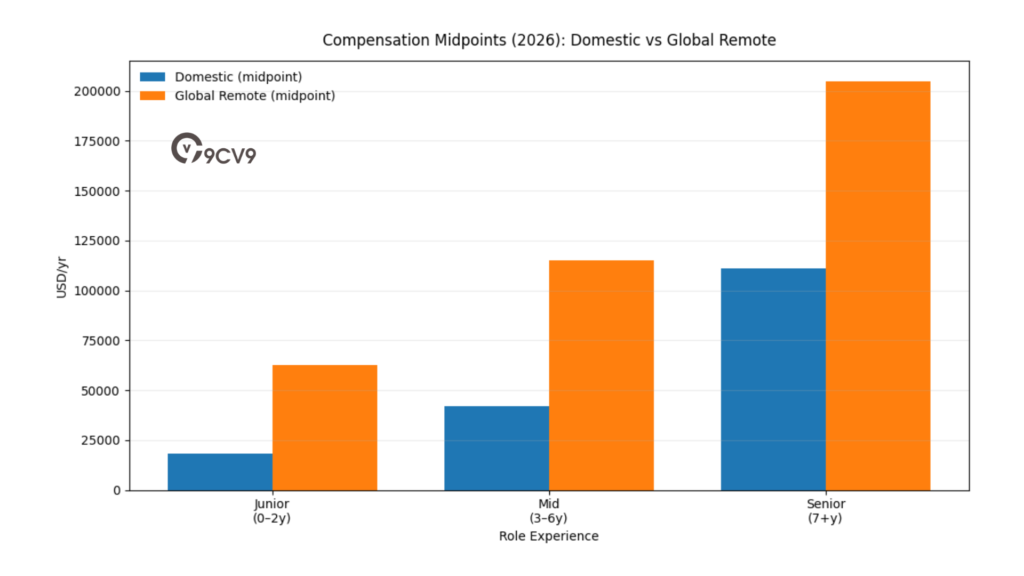
The widening gap between domestic and global-remote compensation reflects India’s growing integration into distributed AI workforce models.
Domestic Market Dynamics
Within India, cities such as Bengaluru, Hyderabad, and Pune remain central AI hiring hubs. Domestic compensation levels are influenced by:
• Cost-sensitive enterprise procurement
• Competitive startup funding cycles
• Local purchasing power benchmarks
• Rupee-denominated salary structures
While senior domestic AI engineers earning ₹1 crore or more annually represent the upper tier of the local market, such compensation remains below US or UK equivalents.
Global-Remote Parity for Senior Talent
The second track is characterized by experienced AI engineers working remotely for US, UK, Swiss, or Singaporean firms. These professionals often specialize in:
• Large language model fine-tuning
• MLOps and distributed training systems
• Applied NLP and computer vision
• AI infrastructure scaling
• Retrieval-augmented generation systems
Compensation in this tier aligns closely with global market rates. Senior engineers may earn between 160,000 and 250,000 USD annually while residing in India. This creates a powerful geo-arbitrage advantage.
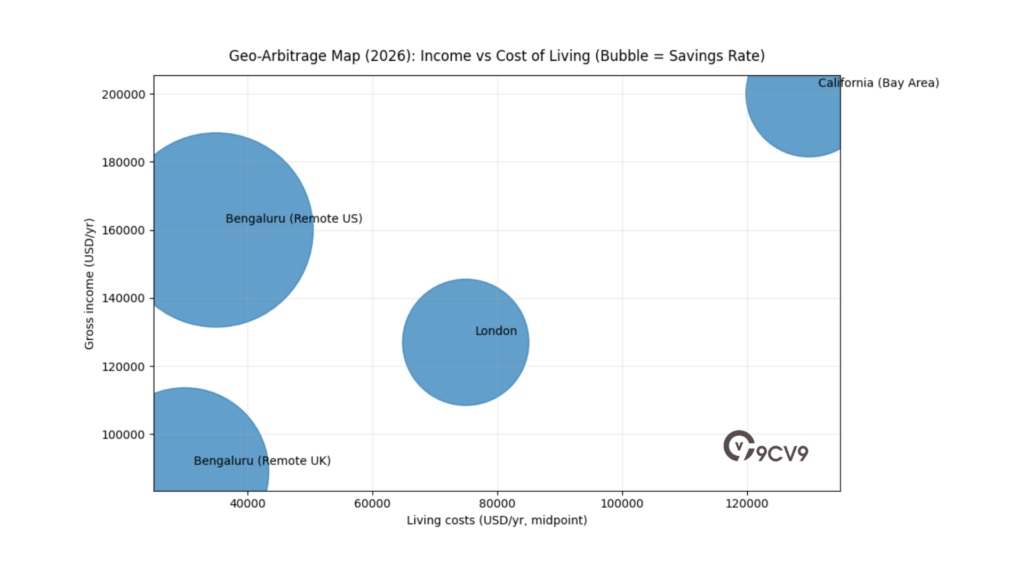
Geo-Arbitrage and Purchasing Power Advantage
Geo-arbitrage refers to the income differential created when compensation is benchmarked to high-cost economies while living in lower-cost regions.
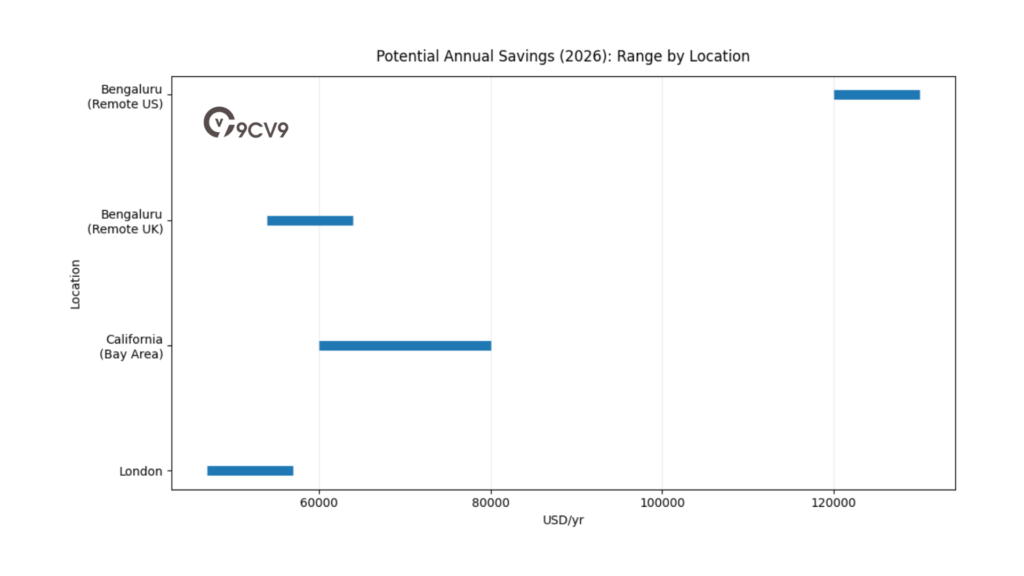
Illustrative Purchasing Power Comparison (2026)
| Location of Residence | Gross Annual Income (USD Equivalent) | Estimated Annual Living Costs (USD) | Potential Savings Rate |
|---|---|---|---|
| London | 127,000 | 70,000 – 80,000 | 30 – 40% |
| California (Bay Area) | 200,000 | 120,000 – 140,000 | 30 – 40% |
| Bengaluru (Remote UK) | 89,000 | 25,000 – 35,000 | 45 – 55% |
| Bengaluru (Remote US) | 160,000 | 30,000 – 40,000 | 55%+ |
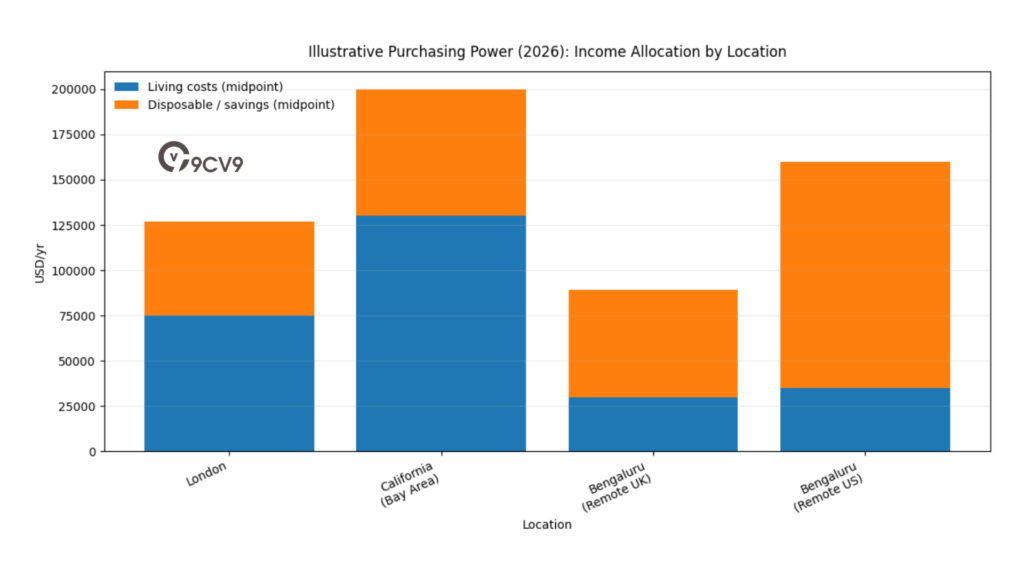
For example, an engineer in Bengaluru earning £70,000 (approximately 89,000 USD) from a London-based employer may enjoy a higher effective standard of living than a London-based engineer earning £100,000. Lower housing costs, reduced commuting expenses, and favorable taxation structures amplify net disposable income.
Tax Efficiency and Section 44ADA
India’s tax framework further strengthens the remote-arbitrage advantage. Under Section 44ADA of the Indian Income Tax Act, eligible professionals can declare 50 percent of their gross receipts as taxable income, simplifying compliance and reducing effective tax liability.
Key financial implications include:
• Lower effective tax burden relative to salaried employment
• Higher post-tax disposable income
• Greater flexibility in managing professional expenses
• Improved net savings rate compared to high-cost Western hubs
As a result, many remote AI engineers in India report net savings rates between 45 and 55 percent of gross income. By contrast, engineers in high-cost US technology hubs often achieve net savings rates closer to 30 to 40 percent due to elevated housing, taxation, and healthcare expenses.
Domestic vs Global-Remote Value Proposition Matrix
| Factor | Domestic Employment (India) | Global Remote Employment |
|---|---|---|
| Salary Benchmark | Local Market Indexed | International Indexed |
| Currency Exposure | INR | USD / GBP |
| Effective Tax Optimization | Moderate | High (contract model) |
| Purchasing Power Advantage | Moderate | Very High |
| Income Volatility Risk | Low to Moderate | Moderate |
Strategic Implications for Employers
For international firms, hiring senior AI engineers in India at 160,000–200,000 USD represents a 20–40 percent cost discount relative to equivalent US hires. However, competition for top-tier Indian AI talent has intensified as more global companies adopt remote-first policies.
For Indian enterprises, the rise of global-remote parity has introduced upward pressure on domestic salary bands. Retention strategies now include:
• Equity participation
• International project exposure
• Research-driven roles
• Hybrid on-site opportunities abroad
Outlook for 2026 and Beyond
India’s AI labor market is no longer defined solely by cost efficiency. It now functions as a dual-economy system: a domestic market aligned with rupee-based enterprise structures and a globally integrated remote talent segment earning near-parity with Western benchmarks.
This structural transformation is expected to continue through 2027 and beyond, as distributed AI development becomes normalized and international employers increasingly compete for India’s top-tier machine learning and generative AI specialists.
c. Vietnam: The 60–80% Cost Advantage
Vietnam has emerged in 2026 as one of the most compelling AI hiring destinations in Asia-Pacific. Once positioned primarily as a software outsourcing market, the country has transitioned into a structured AI engineering hub, particularly in Ho Chi Minh City and Hanoi. With competitive compensation levels, expanding technical education pipelines, and growing exposure to international AI projects, Vietnam now plays a strategic role in global distributed workforce models.
The defining feature of Vietnam’s AI labor market is its substantial cost differential relative to Silicon Valley and other US hyper-hubs. Despite compensation levels that are 60–80 percent lower, productivity outcomes for well-managed teams frequently reach 80–90 percent of US benchmarks, particularly in applied AI domains.
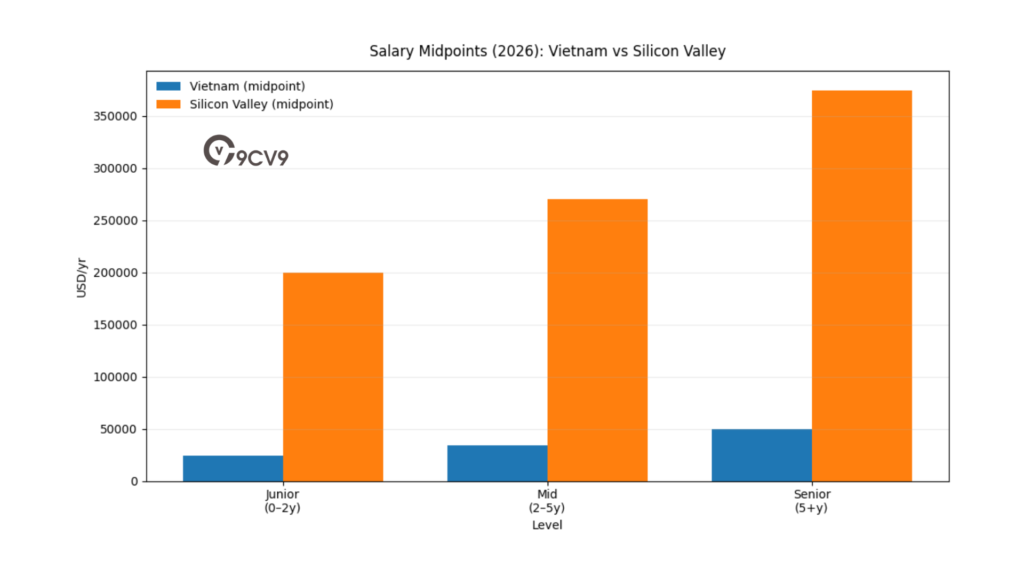
Vietnam vs Silicon Valley AI Salary Comparison (2026)
| Level of Expertise | Annual Salary in Vietnam (USD) | Silicon Valley Baseline (USD) | Approximate Cost Savings (%) |
|---|---|---|---|
| Junior (0–2 Years) | 20,000 – 28,000 | 180,000 – 220,000 | ~88% |
| Mid-Level (2–5 Years) | 28,000 – 40,000 | 220,000 – 320,000 | ~87% |
| Senior (5+ Years) | 40,000 – 60,000 | 300,000 – 450,000 | ~86% |
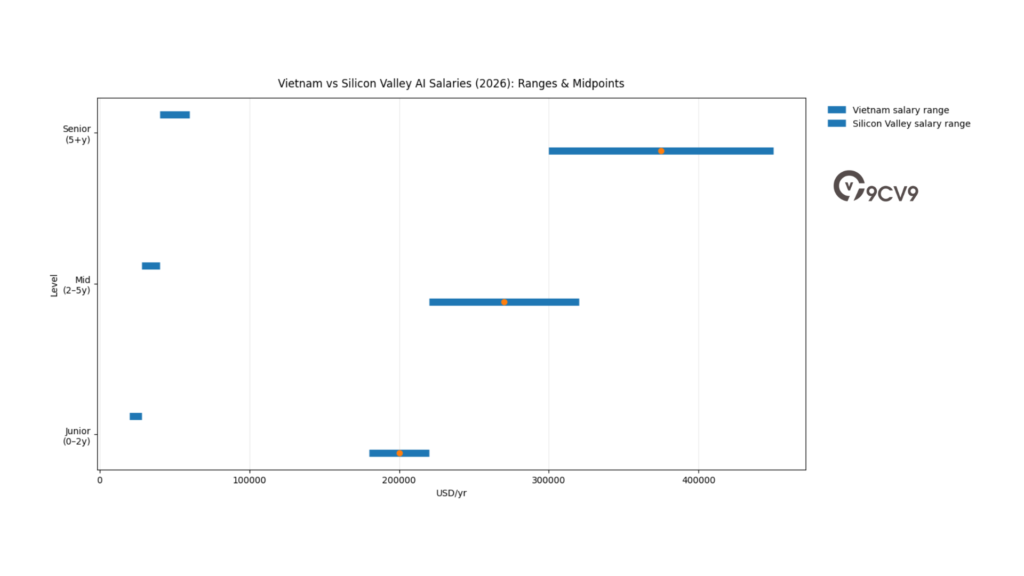
The financial implications of this cost differential are significant. Hiring an experienced senior AI engineer in Vietnam may generate annual savings of 200,000 to 400,000 USD per developer when compared to a Silicon Valley equivalent. For organizations building multi-person AI teams, the aggregate cost reduction can materially alter capital allocation strategies.
Core Technical Capabilities
Vietnamese AI engineers in 2026 are increasingly specialized in:
• Computer vision and image recognition systems
• Natural language processing and multilingual modeling
• Cloud platform orchestration (AWS, Azure, GCP)
• MLOps pipeline automation
• AI-enabled SaaS product development
Many developers possess international project exposure through partnerships with US, Japanese, South Korean, and European firms. English proficiency within technical teams continues to improve, particularly among senior engineers and project leads.
Productivity and Delivery Metrics
While nominal compensation is significantly lower than in US technology hubs, performance output remains competitive when teams are structured effectively.
Vietnam AI Productivity Assessment Matrix (2026)
| Performance Metric | Relative Benchmark vs US Teams |
|---|---|
| Code Delivery Velocity | 80 – 90% |
| AI Model Implementation Accuracy | 85 – 95% |
| Infrastructure Deployment Speed | 75 – 85% |
| Innovation Autonomy | Moderate to High |
| Research-Level Depth | Emerging |
For applied AI implementation, enterprise automation, and product integration, Vietnamese teams often achieve strong delivery consistency. However, frontier AI research roles remain more concentrated in US and Singapore ecosystems.
Recruitment Cost Advantage
Beyond salary differentials, recruitment expenses in Vietnam remain substantially lower than in the United States.
Recruitment Cost Comparison (Per Hire, 2026)
| Region | Average Recruitment Cost (USD) |
|---|---|
| Vietnam | 2,000 – 5,000 |
| United States | 15,000 – 30,000 |
| Singapore | 12,000 – 20,000 |
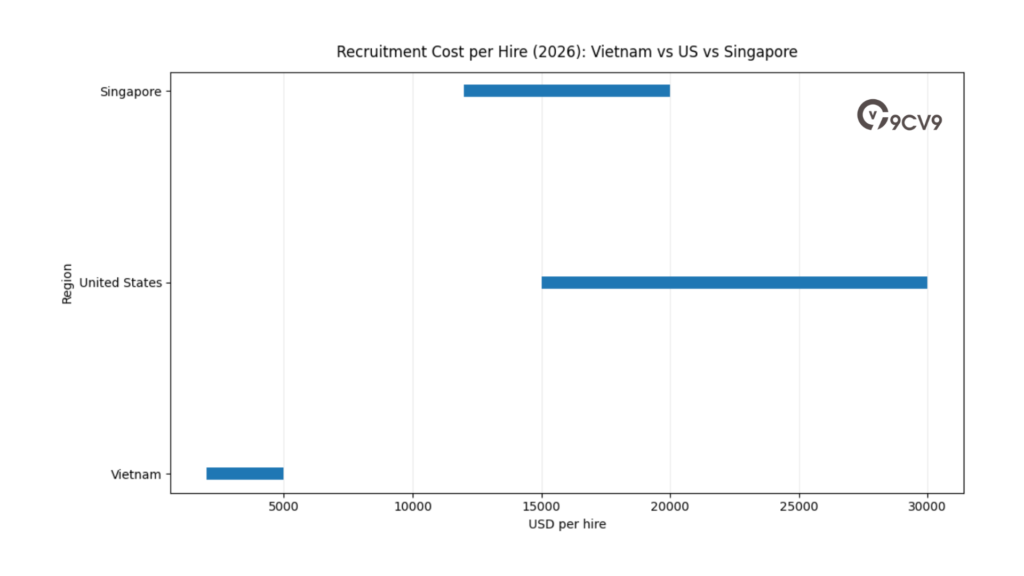
Lower agency fees, reduced signing bonus expectations, and smaller relocation requirements contribute to this advantage. This makes Vietnam particularly attractive for scaling mid-sized AI teams without incurring high upfront hiring expenses.
Total Cost of Ownership Comparison
When evaluating hiring markets, organizations increasingly analyze total cost of ownership (TCO), including salary, recruitment, infrastructure, and retention expenses.
AI Engineer Cost Structure Comparison (Senior Level, 2026)
| Cost Component | Silicon Valley (USD) | Vietnam (USD) |
|---|---|---|
| Base Salary | 300,000 – 450,000 | 40,000 – 60,000 |
| Bonuses & Benefits | 40,000 – 80,000 | 5,000 – 10,000 |
| Recruitment Costs | 15,000 – 30,000 | 2,000 – 5,000 |
| Total First-Year Cost | 355,000 – 560,000 | 47,000 – 75,000 |
The delta in first-year cost can exceed 300,000 USD per senior engineer.
Strategic Considerations
Despite its compelling cost advantage, Vietnam’s AI ecosystem presents strategic considerations:
• Smaller pool of deep research specialists
• Time zone differences for US-based firms
• Growing competition as more companies enter the market
• Gradual upward wage pressure due to increased foreign demand
However, for companies focused on applied AI deployment, enterprise integration, and scalable product engineering, Vietnam offers one of the strongest cost-performance ratios globally.
Outlook for 2026 and Beyond
Vietnam’s AI workforce is expected to expand steadily through 2027 and beyond, supported by government digital transformation initiatives and foreign direct investment in semiconductor and AI infrastructure.
As distributed AI development becomes institutionalized, Vietnam is likely to remain a cornerstone of Southeast Asia’s growth engine—offering 60–80 percent cost savings relative to Silicon Valley while delivering high operational efficiency for applied AI development teams.
4. Latin America: The Nearshore Strategic Choice
a. Regional Compensation Benchmarks
Latin America has become one of the most strategically important nearshore regions for AI talent acquisition in 2026. Over the past year, utilization of Agent of Record (AOR) services for AI hiring across the region has increased by approximately 300 percent, reflecting a structural shift toward compliant cross-border employment models.
North American enterprises are increasingly prioritizing Latin America due to three structural advantages:
• Time zone alignment with US working hours
• Cultural and business communication compatibility
• Competitive compensation levels relative to US markets
Rather than serving solely as a cost-reduction alternative, Latin America is now viewed as a strategic nearshore extension of US AI teams.
Regional Compensation Benchmarks in Latin America (2026)
Mexico, Brazil, Colombia, and Chile have established technology ecosystems supported by venture capital activity, government digitalization initiatives, and growing AI specialization.
Latin America AI Salary Benchmarks (2026)
| Country | Junior (USD/yr) | Mid-Level (USD/yr) | Senior / Lead (USD/yr) |
|---|---|---|---|
| Mexico | 36,000 – 45,000 | 48,000 – 65,000 | 75,000 – 110,000 |
| Brazil | 32,000 – 42,000 | 48,000 – 72,000 | 75,000 – 96,000 |
| Colombia | 28,000 – 38,000 | 40,000 – 60,000 | 65,000 – 90,000 |
| Chile | 30,000 – 40,000 | 50,000 – 75,000 | 80,000 – 105,000 |
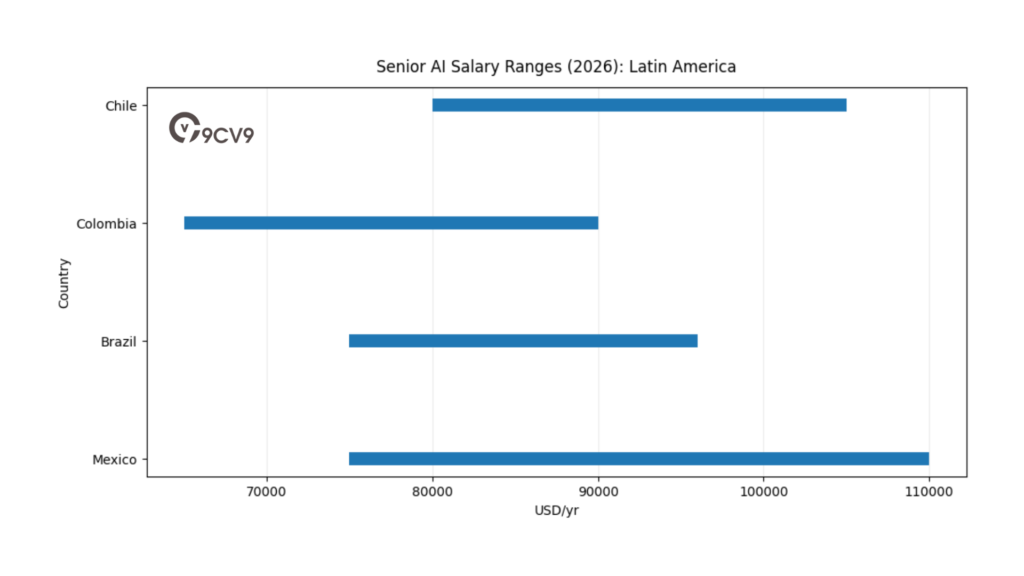
These benchmarks represent locally employed AI engineers within domestic labor frameworks. However, remote and contract-based engagements for US firms may command slightly higher rates.
Mexico: The Nearshore Leader
Mexico has emerged as the leading nearshore AI destination for US companies. With strong STEM output, proximity to Texas and California, and trade alignment under USMCA, the country provides operational ease for cross-border collaboration.
Mexico’s average AI engineer salary of approximately 58,075 USD annually remains highly competitive locally while delivering significant cost savings for US employers.
Cost Comparison: Mexico vs United States (Senior Level, 2026)
| Location | Senior AI Salary (USD/yr) | Estimated Savings vs US (%) |
|---|---|---|
| United States | 180,000 – 250,000 | Baseline |
| Mexico | 75,000 – 110,000 | 45 – 60% |
Time zone synchronization enables real-time collaboration, which reduces productivity friction compared to offshore markets in Asia-Pacific.
Brazil: Depth and Specialization
Brazil hosts the largest technology workforce in Latin America and has seen rapid specialization in AI research, computer vision, fintech AI, and applied machine learning.
Specialized roles in Brazil demonstrate increasing compensation tiers:
• AI Research Engineers: 4,000 – 7,800 USD per month
• LLM and Agentic Engineering Specialists: 4,500 – 8,000 USD per month
Annualized, this places senior specialized roles in the range of approximately 54,000 to 96,000 USD. These figures remain substantially below US equivalents while offering robust technical capabilities.
Brazil’s ecosystem advantages include:
• Strong academic institutions
• Large domestic fintech market
• Government innovation incentives
• Growing startup density
Colombia and Chile: Emerging Stability Hubs
Colombia has rapidly expanded its AI and data engineering workforce, particularly in Bogotá and Medellín. Competitive salary bands and improving digital infrastructure have positioned the country as a rising nearshore alternative.
Chile offers economic stability and strong regulatory governance, making it attractive for companies requiring predictable compliance environments.
Nearshore Efficiency Matrix (2026)
| Factor | Latin America | United States | Asia-Pacific (Offshore) |
|---|---|---|---|
| Salary Cost | Moderate | Very High | Low to Moderate |
| Time Zone Alignment (US) | High | Full | Low to Moderate |
| Cultural Compatibility | High | Full | Moderate |
| Real-Time Collaboration | Strong | Strong | Limited |
| Recruitment Costs | Moderate | High | Low |
Agent of Record (AOR) Growth and Compliance
The 300 percent surge in AOR utilization indicates increasing reliance on third-party compliance providers. These services allow companies to:
• Hire AI engineers without establishing local legal entities
• Ensure payroll and tax compliance
• Mitigate misclassification risk
• Accelerate onboarding timelines
For mid-sized and enterprise firms, AOR frameworks significantly reduce legal exposure while enabling nearshore scalability.
Strategic Cost Analysis: Total Compensation Perspective
Total cost savings in Latin America extend beyond base salary.
Total Cost Comparison (Senior AI Engineer, 2026)
| Cost Component | United States (USD) | Latin America (USD) |
|---|---|---|
| Base Salary | 200,000 | 85,000 |
| Employer Taxes & Benefits | 30,000 – 50,000 | 10,000 – 18,000 |
| Recruitment & Onboarding | 20,000 – 30,000 | 8,000 – 12,000 |
| Estimated First-Year Cost | 250,000 – 280,000 | 103,000 – 115,000 |
Savings per senior hire may range between 130,000 and 170,000 USD annually, while preserving collaborative efficiency due to time zone proximity.
Strategic Outlook for 2026
Latin America’s role in the global AI labor market has shifted from peripheral outsourcing to strategic nearshore integration. The combination of competitive salaries, time zone compatibility, and increasing specialization in advanced AI domains has made the region a preferred choice for North American enterprises.
As AI adoption accelerates in fintech, logistics, healthcare, and e-commerce, Latin America is expected to remain a core pillar of distributed AI workforce strategies—offering substantial cost efficiency without sacrificing operational alignment or collaboration quality.
5. Specialization Premiums and Niche Skillset Economics
a. High-Value Technical Specializations
By 2026, AI hiring has shifted from broad “Generative AI developer” roles toward hyper-specialized engineering tracks. The market now rewards depth over breadth, with compensation directly tied to enterprise risk exposure, deployment scale, and automation autonomy.
The transition from generative content systems to agentic AI architectures—where models execute multi-step, tool-augmented workflows autonomously—has materially reshaped salary hierarchies.
From Generative AI to Agentic AI
Early generative AI roles focused primarily on prompt engineering, fine-tuning, and content synthesis. In contrast, agentic AI roles require:
• Multi-agent orchestration design
• Memory systems and retrieval integration
• Tool use and API chaining
• Autonomy guardrails and safety controls
• Real-time evaluation and fallback mechanisms
This shift has increased demand for engineers proficient in frameworks such as PyTorch and JAX, alongside orchestration platforms like LangGraph and CrewAI.
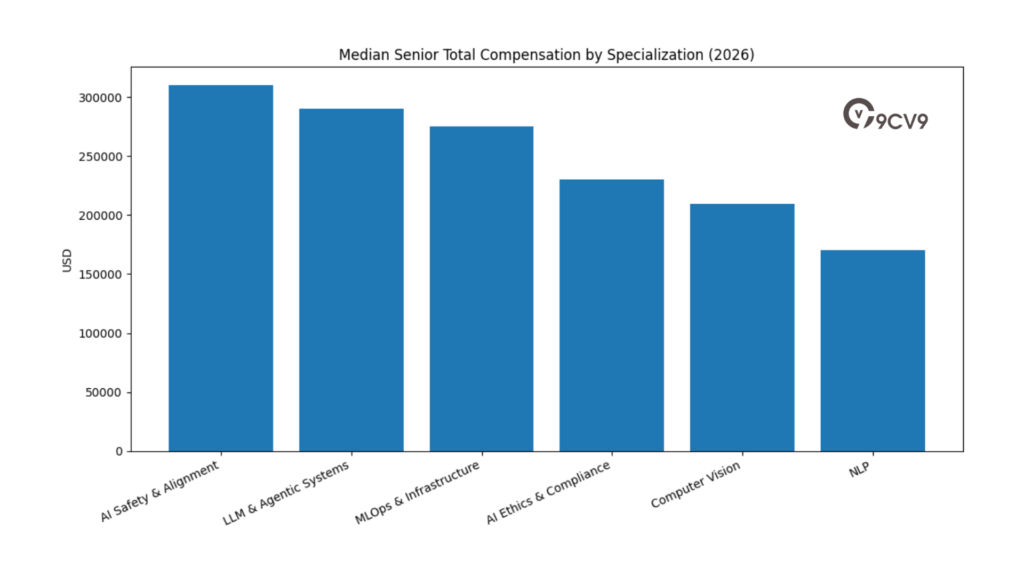
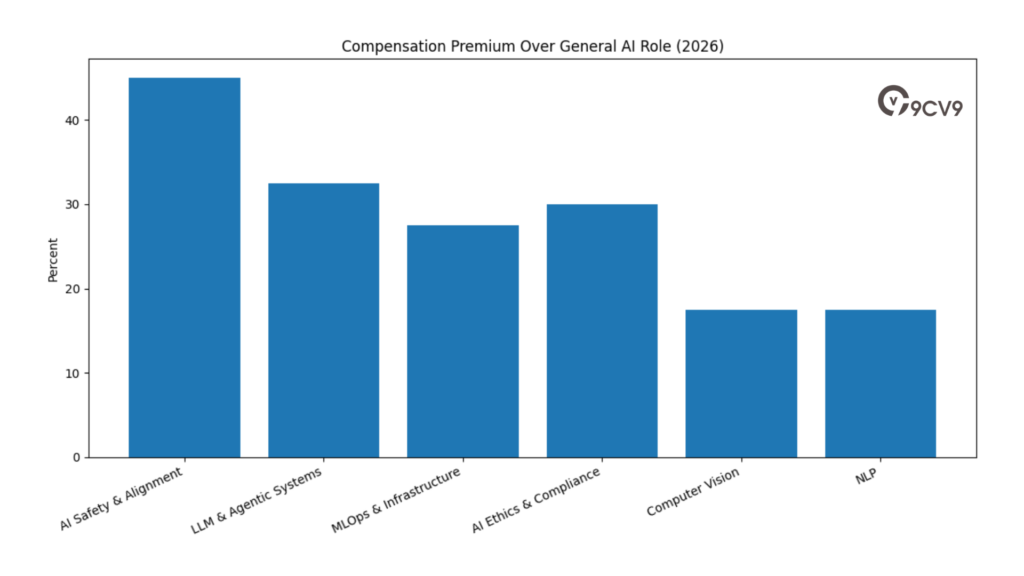
High-Value AI Specializations and Compensation Premiums (2026)
| Specialization Area | Premium Over General AI Role | Median Senior Total Compensation (USD) |
|---|---|---|
| AI Safety & Alignment | 45% | 310,000 |
| LLM & Agentic Systems | 25% – 40% | 290,000 |
| MLOps & Infrastructure | 20% – 35% | 275,000 |
| AI Ethics & Compliance | 30% | 230,000 |
| Computer Vision | 15% – 20% | 209,831 |
| Natural Language Processing | 15% – 20% | 170,000 |
AI Safety & Alignment: The Highest Premium Tier
AI Safety and Alignment commands the largest premium in 2026, often reaching 45 percent above baseline senior AI engineering compensation.
Drivers of this premium include:
• Enterprise regulatory exposure
• Model hallucination risk mitigation
• Bias and fairness auditing
• Adversarial robustness
• Interpretability tooling
Large enterprises deploying foundation models in regulated industries—finance, healthcare, defense—are allocating disproportionate budgets toward governance architecture.
In US markets, median senior total compensation in AI Safety now reaches approximately 310,000 USD. Compensation is particularly elevated in organizations deploying proprietary foundation models or safety-critical autonomous systems.
LLM & Agentic Systems Engineering
LLM and agentic systems engineers now sit at the core of enterprise AI automation strategies. These professionals design:
• Tool-using autonomous agents
• Multi-agent coordination systems
• Retrieval-augmented generation (RAG) pipelines
• Long-term memory systems
• API and workflow integration layers
Premiums range between 25 and 40 percent over general AI roles, with median senior total compensation approaching 290,000 USD in US markets.
Companies transitioning from experimentation to full automation place outsized value on engineers who can design resilient, production-grade agent architectures rather than prototype-level demos.
MLOps & Infrastructure: The Production Multiplier
MLOps specialists ensure that AI systems remain scalable, observable, and cost-optimized after deployment. Their value lies not in model training alone, but in lifecycle management.
Key competencies include:
• Model monitoring and drift detection
• Distributed training orchestration
• Cloud cost optimization
• CI/CD pipelines for ML systems
• Governance logging and reproducibility
Premiums range between 20 and 35 percent over generalist AI roles, with median senior total compensation near 275,000 USD in the United States.
In India, senior MLOps professionals commanding salaries above ₹30 LPA (approximately 36,100 USD) are typically those managing enterprise-scale infrastructure deployments for multinational firms. In US markets, comparable expertise is often attached to roles exceeding 225,000 USD.
AI Ethics & Compliance
With global regulatory frameworks expanding, AI ethics specialists now operate at the intersection of engineering, legal, and policy domains.
Compensation premiums average around 30 percent above baseline AI roles, with median senior compensation near 230,000 USD in US markets.
Their responsibilities frequently include:
• AI risk assessments
• Algorithmic transparency documentation
• Regulatory readiness audits
• Cross-functional compliance coordination
• Bias mitigation protocols
As governance standards formalize globally, this specialization is expected to remain structurally premium-priced.
Computer Vision and NLP: Mature but Still Valuable
Computer Vision and Natural Language Processing remain foundational specializations. However, they now carry more moderate premiums—typically 15 to 20 percent—due to broader talent availability and maturation of tooling ecosystems.
Median senior compensation levels:
• Computer Vision: ~209,831 USD
• Natural Language Processing: ~170,000 USD
While still highly valued, these roles increasingly require integration with broader agentic or production infrastructure capabilities to command top-tier compensation.
Specialization Economics Matrix (2026)
| Skill Complexity | Enterprise Risk Exposure | Revenue Impact | Compensation Premium |
|---|---|---|---|
| Low | Low | Moderate | 0% – 10% |
| Moderate | Moderate | High | 15% – 25% |
| High | High | Very High | 30% – 45% |
Roles tied directly to enterprise risk mitigation (safety, compliance) or autonomous workflow automation (agentic systems) occupy the top-right quadrant of this matrix—where both risk and revenue impact are high.
Strategic Implications for Employers
The 2026 AI labor market demonstrates that:
• Specialization depth now outweighs generalist capability
• Risk mitigation expertise commands the highest pay
• Autonomous workflow engineering is the fastest-growing premium tier
• Infrastructure reliability expertise remains mission-critical
As AI systems transition from experimental to mission-critical infrastructure, compensation increasingly reflects not just technical skill—but enterprise liability, regulatory exposure, and automation leverage.
In this mature AI economy, the highest-paid engineers are those who either prevent catastrophic failure or enable scalable autonomy.
b. Specialized Role Benchmarks
By 2026, AI compensation structures reflect deep functional segmentation across research, engineering, infrastructure, governance, and product leadership. Specialization now influences compensation at every organizational tier—from analysts and individual contributors to research scientists and principal architects.
A notable structural distinction has emerged between core model architects and applied integration engineers. Senior Machine Learning Engineers focused on foundational model design typically command a 5–10 percent premium over Applied AI Engineers responsible for integrating large language models into existing enterprise products.
United States AI Role Compensation Benchmarks (2026)
| Role Title | US Base Salary (Avg) | Total Compensation (US) |
|---|---|---|
| AI Research Scientist | 180,000 – 400,000 | 320,000 – 500,000+ |
| ML Engineer (Senior) | 150,000 – 240,000 | 236,875 (median) |
| LLM Specialist | 160,000 – 245,000 | 290,000 |
| MLOps Engineer | 145,000 – 225,000 | 275,000 |
| AI Product Manager | 160,000 – 260,000 | 170,000 – 250,000 |
| AI Ethics Officer | 135,000 – 180,000 | 200,000+ |
AI Research Scientist: The Elite Tier
AI Research Scientists occupy the highest technical compensation band outside executive leadership. These professionals focus on:
• Novel architecture development
• Reinforcement learning systems
• Alignment research
• Large-scale pretraining strategies
• Evaluation methodology design
In leading AI labs and frontier startups, total compensation frequently exceeds 500,000 USD annually. At the most elite level, total packages can surpass 1 million USD, particularly when equity is included.
Major laboratories such as OpenAI, Google DeepMind, and Anthropic have historically driven these upper compensation bands due to intense competition for frontier research talent.
Series D startups often offer stock grants valued between 2–4 million USD over vesting periods, dramatically increasing total realized compensation if valuation milestones are met.
Senior ML Engineers: Architecture vs Application
Senior ML Engineers focusing on:
• Core model architecture
• Training optimization
• Distributed systems design
• Parameter-efficient fine-tuning
• Scaling laws and evaluation
command a 5–10 percent premium over Applied AI Engineers primarily responsible for:
• LLM API integration
• Workflow automation
• Prompt optimization
• Feature deployment within SaaS platforms
Median senior total compensation sits near 236,875 USD in the US, though high-performing engineers in top-tier firms exceed 300,000 USD with equity and bonuses.
LLM Specialists and Agentic System Engineers
LLM Specialists—particularly those designing agentic workflows and retrieval-augmented systems—earn total compensation near 290,000 USD in US markets.
Their value stems from:
• Multi-agent orchestration
• Memory design and retrieval pipelines
• Tool integration
• Evaluation frameworks for autonomous workflows
As enterprises move from experimentation to full automation, these roles increasingly influence revenue impact, thereby sustaining their premium.
MLOps Engineers: The Production Backbone
MLOps Engineers ensure that AI systems remain stable, scalable, and cost-effective post-deployment.
Total compensation averaging 275,000 USD reflects their responsibility over:
• Infrastructure scaling
• Monitoring and drift detection
• Model retraining pipelines
• Cost optimization at inference scale
• Compliance logging
Their value correlates directly with operational uptime and cloud expenditure efficiency.
AI Product Managers: Strategy Meets Execution
AI Product Managers operate at the intersection of technical feasibility and market viability.
Base salaries range from 160,000 to 260,000 USD, with total compensation typically between 170,000 and 250,000 USD. Compensation varies based on whether the role is:
• Platform-level (higher strategic leverage)
• Feature-level (execution-focused)
• Research-commercialization bridge roles
AI Ethics Officers and Governance Leaders
AI Ethics Officers and compliance leaders increasingly occupy executive-adjacent roles.
Base compensation ranges between 135,000 and 180,000 USD, with total packages exceeding 200,000 USD in large enterprises. Their influence spans:
• Regulatory readiness
• Algorithmic audits
• Risk governance frameworks
• Enterprise AI policy enforcement
As global AI regulation formalizes, these roles are shifting from advisory to operational authority positions.
Hedge Fund AI Engineers: ROI-Driven Compensation
A distinct outlier in compensation benchmarks is the hedge fund AI engineer. Firms deploying AI-integrated quantitative strategies often offer:
• Base salaries between 200,000 – 400,000 USD
• Performance-based bonuses tied to trading alpha
• Total compensation exceeding 1 million USD
Unlike enterprise tech firms where equity drives upside, hedge funds tie compensation directly to return on investment. Engineers who materially improve model performance can command multi-million-dollar annual payouts in exceptional years.
Elite Compensation Drivers Matrix (2026)
| Compensation Driver | Impact on Total Pay |
|---|---|
| Frontier Research Capability | Very High |
| Revenue-Linked Performance | Extremely High |
| Equity in Late-Stage Startups | High |
| Infrastructure Ownership Scope | High |
| Regulatory Risk Responsibility | Moderate to High |
The highest compensation tiers are concentrated where:
• Revenue impact is measurable and direct
• Intellectual property creation is strategic
• Enterprise risk exposure is significant
• Talent scarcity remains acute
Strategic Outlook
AI compensation in 2026 is no longer dictated solely by job title. Instead, it reflects:
• Depth of specialization
• Proximity to revenue generation
• Level of research originality
• Infrastructure ownership scope
• Regulatory and governance exposure
The labor market increasingly rewards engineers and researchers who either create foundational model breakthroughs or directly monetize AI systems at scale. At the uppermost tiers, compensation mirrors not just technical skill—but economic leverage.
6. The Burden of Employment: Taxes, Benefits, and Overhead
a. US Employer-Side Costs and Compliance Requirements
The true cost of hiring an AI engineer extends well beyond base salary. In 2026, employer-side obligations—including payroll taxes, statutory benefits, compliance overhead, and operational tooling—can increase total employment cost by 19–34 percent above base pay in the United States.
For organizations competing in the AI talent market, understanding fully loaded cost structures is essential for accurate workforce planning and margin forecasting.
US Employer-Side Costs and Compliance Requirements
In the United States, employer payroll costs are composed primarily of federal insurance contributions, unemployment taxes, healthcare benefits, retirement contributions, and indirect overhead.
According to data from the U.S. Bureau of Labor Statistics, employer costs for employee compensation average approximately 30 percent above wages across professional and technical services categories, with variation based on benefits design and state-level obligations.
For AI engineers earning a base salary of 150,000 USD, the employer’s annual cost structure typically resembles the following:
Fully Loaded Cost Breakdown (Base Salary: $150,000)
| Component | Estimated Annual Cost (USD) | % of Base |
|---|---|---|
| Payroll Taxes (FICA, FUTA, state taxes) | 11,475 – 18,000 | 7.6% – 12% |
| Health Insurance (Employer Contribution) | 6,000 – 12,000 | 4% – 8% |
| Retirement (401k Match) | 2,000 – 4,500 | 1.3% – 3% |
| Paid Time Off (Valued Cost) | 4,000 – 6,000 | 2.6% – 4% |
| Equipment & Software Licensing | 5,000 – 10,000 | 3.3% – 6.6% |
| Total Fully Loaded Cost | 178,475 – 200,500+ | 119% – 134%+ |
This calculation does not include recruitment costs, onboarding time, legal compliance services, or potential equity dilution.
Payroll Taxes and Federal Contributions
Employer payroll tax obligations include:
• Social Security (6.2% up to wage cap)
• Medicare (1.45% uncapped)
• Federal Unemployment Tax (FUTA)
• State unemployment insurance (variable by state)
Combined employer-side payroll tax burdens generally range between 7.6 percent and 12 percent of salary, depending on state and wage cap thresholds.
Healthcare and Retirement Contributions
Employer-sponsored health insurance remains one of the largest non-wage cost drivers. For single coverage, employers typically contribute 6,000–12,000 USD annually per employee. Family coverage increases this cost substantially.
Retirement matching contributions—commonly structured as 401(k) matches—add 1.3–3 percent of base salary depending on match policy design.
Operational and Productivity Costs
Beyond statutory obligations, employers must account for:
• High-performance laptops and GPUs
• Cloud credits and compute allocation
• SaaS tools (Git hosting, security, DevOps, collaboration)
• AI model API consumption
• Security compliance systems
For AI engineers in production environments, equipment and software expenditures alone can exceed 10,000 USD annually.
Regulatory and Reporting Expansion in 2026
The 2026 fiscal year introduces expanded payroll reporting obligations under OBBBA (Organizational Benefit and Business Accountability standards), increasing granularity in wage classification, contractor segmentation, and compensation disclosure reporting.
Additionally, more US states have implemented salary-range transparency laws, requiring:
• Disclosure of minimum and maximum pay ranges
• Inclusion of benefits descriptions in postings
• Remote eligibility clarity
Noncompliance penalties have increased. The average cost of payroll noncompliance now exceeds approximately 845 USD per employee per year, factoring penalties, administrative correction, and legal consultation.
Compliance Cost Risk Matrix (United States, 2026)
| Risk Area | Financial Impact | Operational Impact |
|---|---|---|
| Payroll Misclassification | High | High |
| Reporting Errors | Moderate | Moderate |
| Benefits Noncompliance | High | High |
| Salary Disclosure Violations | Moderate | Reputational |
| Tax Filing Delays | Moderate | Administrative |
Strategic Implications for AI Hiring
For AI roles with base salaries exceeding 200,000 USD, fully loaded employer cost may approach 250,000–280,000 USD annually once taxes, benefits, tooling, and compliance overhead are included.
This cost structure explains the rapid growth of:
• Nearshore employment strategies
• Employer of Record (EOR) models
• Agent of Record (AOR) frameworks
• Hybrid contractor structures
The fully loaded employment model in the United States remains the most administratively intensive among major AI labor markets. While it offers strong legal protections and infrastructure stability, it imposes a structural cost premium compared to emerging global AI talent hubs.
In 2026, the strategic challenge for enterprises is not merely hiring AI engineers—but optimizing the total cost of compliant employment while preserving productivity, retention, and regulatory alignment.
b. European and Asian Tax/Benefit Profiles
Employer-side labor costs vary significantly across Europe, Asia, and Latin America. In 2026, Western European nations continue to maintain high social security contributions tied to expansive welfare systems, while emerging Asian markets such as Vietnam have introduced targeted reforms to support technology sector growth.
Understanding statutory burdens is critical when modeling total AI hiring costs across jurisdictions.
Comparative Employer Contribution Benchmarks (2026)
| Region / Country | Employer Tax / Social Security Rate | Mandatory Benefits Overview |
|---|---|---|
| Germany | 20% – 22% | Pension, health, unemployment, nursing care |
| United Kingdom | 13.8% (National Insurance) | Pension auto-enrolment, statutory sick pay |
| Vietnam | 21.5% | Social insurance (17.5%), health (3%), unemployment (1%) |
| Mexico | 36% – 44% | 13th month salary, healthcare, housing fund |
| Colombia | ~33% | 13th month salary, social security |
| Chile | 5% – 8.5% | Minimum mandatory social contributions |
Western Europe: High Contributions, High Stability
Germany
Germany maintains one of the highest employer social contribution burdens in Europe. Employers typically contribute between 20 and 22 percent of gross salary toward:
• Public pension insurance
• Statutory health insurance
• Unemployment insurance
• Long-term nursing care insurance
However, Germany applies contribution ceilings (Beitragsbemessungsgrenze). In 2026, employer social security contributions are capped at approximately €8,050 per month (about €96,600 annually).
Implication for AI Hiring
For high-earning AI specialists earning significantly above €100,000 annually, employer marginal contribution rates decline beyond the cap. This creates a flattening effect on fully loaded cost at senior and principal levels.
United Kingdom
United Kingdom employers contribute 13.8 percent National Insurance on earnings above the secondary threshold.
Mandatory employer obligations include:
• Auto-enrolment pension contributions
• Statutory sick pay
• Paid leave (minimum 28 days including bank holidays)
Compared to Germany, the UK has a lower employer contribution percentage but offers fewer universal welfare benefits funded through payroll.
Asia: Reform-Oriented Growth Economies
Vietnam
Vietnam continues to refine its tax and labor framework to attract technology investment.
Employer statutory contributions total approximately 21.5 percent, comprising:
• 17.5 percent social insurance
• 3 percent health insurance
• 1 percent unemployment insurance
2026 Policy Developments
A new Personal Income Tax (PIT) Law effective July 1, 2026 simplifies tax brackets from seven to five, reducing effective tax burdens for many middle-income employees.
The top PIT bracket remains 35 percent for monthly income exceeding VND 100 million.
Additionally, the January 2026 statutory minimum wage increase raises the base used for calculating Social Insurance (SHUI) contributions, marginally increasing employer cost at lower salary bands.
Strategic Impact
Vietnam’s contribution rate is comparable to Germany in percentage terms but operates on significantly lower wage bases, preserving its overall cost advantage for AI talent relative to Western Europe and North America.
Latin America: Structurally Higher Statutory Add-Ons
Mexico
Mexico presents one of the highest effective employer cost burdens in Latin America.
Employer obligations include:
• Social security contributions
• Housing fund (INFONAVIT) payments
• Mandatory 13th month salary (Aguinaldo)
• Profit-sharing obligations in certain structures
Effective employer burden may range between 36 and 44 percent depending on compensation structure and benefits policy.
Colombia
Colombia requires employer contributions of approximately 33 percent, including:
• Pension
• Health insurance
• Risk insurance
• 13th month salary
Chile
Chile maintains comparatively lower employer contribution rates, typically between 5 and 8.5 percent, though employees contribute higher portions toward pension systems.
Cost Efficiency Comparison Matrix (Senior AI Engineer Example)
| Country | Base Salary (USD Equivalent) | Employer Add-On % | Effective Cost Multiplier |
|---|---|---|---|
| United States | 200,000 | 19% – 34% | 1.19 – 1.34x |
| Germany | 150,000 | ~20% (capped) | ~1.20x (plateaus above cap) |
| United Kingdom | 150,000 | ~14% + pension | ~1.18 – 1.22x |
| Vietnam | 60,000 | 21.5% | ~1.215x |
| Mexico | 90,000 | 36% – 44% | 1.36 – 1.44x |
| Colombia | 75,000 | ~33% | ~1.33x |
| Chile | 85,000 | 5% – 8.5% | 1.05 – 1.085x |
Strategic Interpretation for AI Workforce Planning
Key structural observations for 2026:
• Western Europe offers high regulatory stability but elevated payroll burdens.
• Germany’s capped contribution system benefits high-salary AI specialists.
• Vietnam maintains competitive cost positioning despite contribution increases.
• Mexico and Colombia carry significant statutory add-ons due to mandatory bonuses and benefit structures.
• Chile offers comparatively lighter employer-side burdens in the region.
For enterprises building distributed AI teams, effective workforce modeling must incorporate:
• Contribution caps
• Mandatory 13th month salaries
• Pension auto-enrolment obligations
• Wage-based contribution recalibrations
• Tax bracket reforms affecting employee net compensation
In 2026, total AI employment cost is increasingly shaped not just by salary benchmarks—but by the architecture of national social insurance systems. Strategic global hiring decisions now require jurisdiction-specific financial modeling rather than simple wage comparisons.
7. Recruitment Dynamics and the War for Elite Talent
a. Recruitment Pricing Models 2026
The global shortage of highly specialized AI engineers continues to distort traditional recruitment economics. In 2026, time-to-hire, compensation competitiveness, and sourcing channel efficiency have become strategic variables—not administrative ones.
Elite AI talent pools remain thin relative to enterprise demand, particularly in:
• AI Safety & Alignment
• Agentic Systems Engineering
• Distributed Training Infrastructure
• Quantitative AI for Financial Systems
As a result, recruitment fees have reached historic highs, and organizations increasingly optimize between contingency, retained, and technology-enabled hiring models.
Recruitment Pricing Models (2026)
Traditional agencies continue to price services as a percentage of first-year compensation, though alternative models are expanding rapidly.
| Recruitment Model | Typical Fee Structure | Estimated Cost (for $150k Role) |
|---|---|---|
| Contingency Search | 15% – 25% of salary | 22,500 – 37,500 |
| Retained Search | 25% – 35% of salary | 37,500 – 52,500 |
| Flat Fee (Senior) | Fixed amount | 7,500 – 15,000 |
| AI-Powered Platform | 10% – 15% of agency rate | 2,250 – 5,625 |
| Hourly Service Model | 75 – 250 USD per hour | Varies by duration |
Contingency Search: Volume with Risk
Contingency firms operate on success-based fees, typically 15–25 percent of first-year salary. For senior AI engineers at 150,000 USD, this equates to 22,500–37,500 USD per hire.
Advantages:
• No upfront cost
• Broad candidate sourcing
• Suitable for mid-level roles
Limitations:
• Competing recruiter submissions
• Reduced role exclusivity
• Limited strategic advisory
Retained Search: Executive-Level Precision
Retained search firms command 25–35 percent of salary and are typically reserved for:
• AI Research Directors
• Principal ML Architects
• Head of AI roles
• Quantitative AI leads
Fees for a 150,000 USD role range between 37,500–52,500 USD and scale significantly for roles exceeding 250,000 USD base.
This model offers:
• Dedicated search commitment
• Confidential market mapping
• Competitive offer advisory
• Equity structuring guidance
Flat-Fee and AI-Powered Models
Flat-fee recruitment models have gained traction among growth-stage startups seeking cost predictability. Senior AI hires may cost 7,500–15,000 USD, significantly undercutting percentage-based agencies.
AI-powered recruitment platforms reduce cost further by automating sourcing, screening, and matching. At 10–15 percent of traditional agency fees, total cost for a 150,000 USD role may fall between 2,250–5,625 USD.
These platforms leverage:
• Skill-matching algorithms
• Compensation benchmarking engines
• Candidate scoring systems
• Automated outreach
However, they may lack the high-touch negotiation strategy required for elite candidates.
Hourly Advisory Models
Some firms now provide on-demand AI hiring advisory at 75–250 USD per hour, covering:
• Technical screening design
• Compensation benchmarking
• Offer negotiation coaching
• Global compliance structuring
This hybrid model appeals to companies with internal sourcing teams but limited AI expertise.
The Cost of Waiting: The Hidden Multiplier
The most overlooked hiring expense is vacancy cost.
In 2026, a senior AI role offered below a 200,000 USD base salary floor in the US market takes an average of 114 days to fill.
Time-to-Fill Risk Matrix
| Base Salary Offered | Avg. Time to Fill | Hiring Risk Level |
|---|---|---|
| 150k – 180k | 110 – 130 days | High |
| 180k – 200k | 75 – 100 days | Moderate |
| 200k+ | 45 – 70 days | Lower |
A prolonged vacancy in a revenue-generating AI role can create:
• Delayed product launches
• Slower model deployment
• Missed enterprise contract windows
• Competitive feature gaps
Estimated Hidden Cost of Vacancy
For senior AI roles tied to product development or automation:
• 20–40 percent additional hidden cost may accrue relative to annual salary
• Opportunity cost may exceed recruitment fee savings
• Engineering team velocity declines due to workload redistribution
For a 150,000 USD base role, a 4-month delay may represent 30,000–60,000 USD in lost productivity or deferred revenue impact—often exceeding agency fees entirely.
Recruitment Strategy Efficiency Matrix (2026)
| Model Type | Cost Efficiency | Speed | Executive Suitability | Negotiation Support |
|---|---|---|---|---|
| Contingency | Moderate | Moderate | Low–Moderate | Moderate |
| Retained | Low (High Fee) | High | High | High |
| Flat Fee | High | Moderate | Moderate | Low–Moderate |
| AI Platform | Very High | High | Low–Moderate | Low |
| Hybrid Advisory | High | High | High (if internal sourcing exists) | High |
Strategic Implications
In the 2026 AI labor market, organizations must balance three competing variables:
• Direct recruitment cost
• Time-to-fill velocity
• Offer competitiveness
Attempting to minimize fee percentages while underpricing compensation often produces the highest total cost due to vacancy delays.
Elite AI talent markets operate under supply-constrained dynamics. Compensation strategy and recruitment channel selection are no longer independent decisions—they are interdependent levers within a high-stakes competitive ecosystem.
The war for elite AI talent is not won by minimizing fees. It is won by minimizing friction, time, and uncertainty in the hiring process.
8. Macroeconomic Drivers: Demand, Supply, and the 2026 Reality
a. The Global Talent Shortage and Economic Impact
The 2026 AI labor market is characterized by a structural imbalance between accelerating enterprise demand and a constrained pool of deeply qualified specialists. While computer science graduation rates continue to rise globally, the conversion rate from general applicants to truly senior, production-ready AI engineers remains approximately 6–9 percent.
This mismatch is not cyclical—it is structural. The skill bar has risen faster than educational and professional retraining systems can adapt.
Demand Acceleration vs. Supply Maturation
Enterprise AI adoption has moved from experimentation to mission-critical deployment. Organizations are now building:
• Autonomous agentic workflows
• Multimodal reasoning systems
• Large-scale ML infrastructure
• AI-integrated quantitative trading systems
• Governance and safety frameworks
However, only a fraction of software engineers possess the combination of:
• Distributed systems expertise
• Advanced model training experience
• Infrastructure scalability skills
• Governance and compliance literacy
• Production-grade evaluation capability
The result is a sharply constrained senior talent layer.
The Global Talent Shortage and Economic Impact
According to projections from the U.S. Bureau of Labor Statistics, the United States faces a deficit exceeding 1.2 million software and IT professionals by 2026.
Globally, shortages in machine learning infrastructure, MLOps, and agentic systems engineering are projected to generate approximately 5.5 trillion USD in economic losses by 2026 due to:
• Delayed digital transformation initiatives
• Slower product innovation cycles
• Deferred AI commercialization
• Reduced productivity scaling
The economic cost of under-deployed AI capacity now rivals traditional capital inefficiencies.
Applicant-to-Role Ratio: The Multimodal Bottleneck
In emerging sub-disciplines such as multimodal AI systems, the applicant-to-role ratio has dropped below equilibrium.
Current market dynamics show:
• 0.9 qualified applicants per open multimodal AI position
• Less than one production-ready candidate per vacancy
• High counteroffer frequency
• Elevated compensation bidding wars
This imbalance drives:
• Rapid offer escalation
• Shortened candidate decision windows
• Increased poaching from elite labs and startups
Geographic Concentration of Elite Talent
Despite the global rhetoric of distributed workforces, high-end AI expertise remains geographically clustered.
Approximately 62 percent of globally qualified AI talent is concentrated in six metro ecosystems:
• San Francisco
• New York
• Seattle
• Boston
• London
• Berlin
These hubs benefit from:
• Proximity to venture capital
• Frontier research labs
• Established AI startup ecosystems
• Academic research pipelines
• Concentrated cloud infrastructure investment
While remote work has broadened hiring geography, the densest expertise networks remain centralized.
Skill Deprecation Velocity and Workforce Upskilling
AI is not only creating demand—it is accelerating skill obsolescence.
According to estimates from Gartner, generative AI evolution will require approximately 80 percent of the engineering workforce to undergo significant upskilling through 2027.
Key drivers of skill depreciation:
• Rapid framework evolution
• Agentic orchestration complexity
• Model architecture innovation
• Cloud-native ML pipeline shifts
• Regulatory compliance expansion
Engineers who specialized exclusively in earlier generative AI prompt-based systems now face capability gaps in:
• Autonomous multi-agent systems
• Memory-augmented architectures
• Infrastructure observability tooling
• Safety evaluation frameworks
Supply-Side Constraint Model (2026)
| Factor | Supply Impact | Market Effect |
|---|---|---|
| Low Senior Conversion Rate | Severe | Salary Inflation |
| Geographic Talent Clustering | High | Regional Premiums |
| Rapid Skill Obsolescence | High | Upskilling Costs |
| Enterprise AI Adoption Speed | Extreme | Vacancy Pressure |
| Multimodal Specialization Gap | Severe | Competitive Bidding |
The 2026 Reality: Structural, Not Temporary
The AI talent gap is not a short-term labor imbalance. It reflects:
• Exponential model complexity
• Enterprise risk sensitivity
• Infrastructure scaling demands
• Global regulatory scrutiny
• Competitive AI arms races
Universities are producing more graduates, but deep production-grade AI engineering expertise requires years of compound experience across research, deployment, and optimization environments.
Strategic Implications for Enterprises
Organizations must now approach AI workforce planning as macroeconomic risk management.
Effective responses include:
• Investing in structured internal upskilling programs
• Building global distributed hiring strategies
• Leveraging nearshore and offshore markets
• Designing retention incentives tied to innovation impact
• Accelerating hiring velocity to reduce vacancy drag
In 2026, the defining feature of the AI labor market is not simply high salaries. It is scarcity under acceleration.
The imbalance between demand and supply is shaping compensation, recruitment models, geographic strategy, and long-term workforce architecture. AI capability is no longer just a competitive advantage—it is an economic multiplier constrained by human capital availability.
b. ROI Analysis: AI Agents vs. Human Employees
As AI engineer compensation rises and labor markets tighten, organizations are increasingly evaluating the financial viability of autonomous AI agents as operational equivalents to certain human roles.
The shift is not about full workforce replacement. It is about task-level substitution—automating structured, repetitive, and rule-based workflows to reduce marginal labor cost while increasing scalability.
Fully Loaded Human Cost vs. AI System Cost
In the United States, a human employee earning 55,000 USD in base salary typically incurs a fully loaded employer cost of 75,000–95,000 USD annually after:
• Payroll taxes
• Health insurance contributions
• Retirement matching
• Paid leave
• Equipment and software
• Compliance overhead
By contrast, an AI system performing equivalent structured administrative or operational functions may cost between 3,000 and 25,000 USD per year, depending on:
• API usage volume
• Infrastructure hosting costs
• Licensing fees
• Maintenance and monitoring
• Initial implementation investment
Cost Comparison Example (Administrative Function)
| Component | Human Employee | AI System |
|---|---|---|
| Base Compensation / License | 55,000 | 8,000 |
| Taxes & Benefits | 20,000–30,000 | — |
| Equipment & Software | 3,000–5,000 | 2,000 |
| Maintenance / Ops | — | 3,000 |
| Total Annual Cost | 75,000–95,000 | 10,000–15,000 |
Replacing an 80,000 USD administrative role with a 10,000 USD AI system yields approximately 70,000 USD in direct annual savings, excluding secondary productivity gains.
ROI Calculation Framework
The return on investment (ROI) for AI implementation is typically calculated as:
ROI = (Cost Savings + Revenue Growth − Investment) / Investment
Where:
• Cost Savings = Reduced labor, error reduction, efficiency gains
• Revenue Growth = Increased output capacity or improved conversion
• Investment = Implementation cost, integration, training, infrastructure
Illustrative ROI Scenario
Assume:
• Initial AI implementation cost: 30,000 USD
• Annual AI operating cost: 10,000 USD
• Replaced human cost: 80,000 USD
Net Annual Savings = 80,000 − 10,000 = 70,000 USD
First-Year Net Benefit = 70,000 − 30,000 (initial investment) = 40,000 USD
ROI = 40,000 / 30,000 = 133% in Year 1
Many organizations report full ROI realization within 3–9 months, particularly in:
• Customer support automation
• Invoice processing
• Document classification
• Data extraction workflows
• HR onboarding tasks
Scaling Economics: Linear vs. Exponential Cost Growth
Human labor scales linearly.
AI systems scale near-exponentially relative to cost.
Scaling Model Comparison
| Growth Metric | Human Model | AI Model |
|---|---|---|
| Additional Workload | Requires new hires | Requires marginal compute |
| Marginal Cost Increase | High | Low |
| Time to Scale | Weeks–Months | Minutes–Days |
| Consistency | Variable | High |
For example, doubling workload in a human model may require doubling headcount. In AI-driven systems, marginal cost may increase only by incremental API or infrastructure consumption.
Strategic Advantages of AI Agents
AI systems excel in:
• Structured, repetitive workflows
• 24/7 availability
• High-volume transaction processing
• Standardized decision trees
• Predictable rule-based environments
They do not incur:
• Sick leave
• Turnover risk
• Payroll compliance complexity
• Benefits negotiation
• Salary inflation pressures
Limitations and Risk Considerations
However, AI agents remain limited in:
• Ambiguous decision-making
• Complex stakeholder negotiation
• Ethical judgment calls
• Creative problem-solving
• Cross-functional leadership
Therefore, ROI is highest when AI augments or replaces narrowly scoped operational tasks—not strategic human roles.
Capital Allocation Perspective
From a CFO standpoint, AI systems transform:
• Fixed payroll liabilities → variable technology expense
• Ongoing benefit obligations → scalable operational cost
• Long hiring cycles → rapid deployment cycles
The macroeconomic implication is significant. Organizations can now expand output capacity without proportional payroll growth, decoupling revenue expansion from headcount expansion.
Enterprise ROI Matrix (2026)
| Role Type | Automation Feasibility | ROI Potential | Risk Level |
|---|---|---|---|
| Administrative Support | High | Very High | Low |
| Customer Service (Tier 1) | High | High | Moderate |
| Data Processing | Very High | Very High | Low |
| Mid-Level Analyst | Moderate | Moderate | Moderate |
| Senior Strategist | Low | Low | High |
Conclusion
The 2026 reality is not human vs. AI—it is human plus AI optimization.
For structured, repeatable functions, AI agents can deliver:
• 60–90 percent cost reduction
• Rapid ROI realization
• Elastic scalability
• Lower compliance burden
As AI engineer salaries rise and global labor shortages persist, autonomous systems increasingly represent not just a technological innovation—but a capital efficiency strategy.
The most competitive organizations are those that strategically redeploy human talent toward high-leverage, judgment-driven work while assigning predictable operational tasks to AI systems.
9. Build vs. Buy: The Specialized AI Agency Model
As AI systems increase in architectural complexity, many organizations face a strategic decision: build internal AI capability or buy expertise through specialized AI agencies.
In 2026, this decision is influenced by three primary constraints:
• Talent scarcity
• Time-to-market pressure
• Capital allocation discipline
For companies lacking an established in-house AI team, specialized agencies provide immediate access to senior ML engineers, MLOps architects, and agentic system designers—without the long recruitment cycle.
AI Development Cost Benchmarks (2026)
Development costs vary significantly by project scope, autonomy level, and infrastructure requirements.
| Project Complexity | Development Cost (USD) | Timeline | Annual Operating Cost |
|---|---|---|---|
| Simple Task Agent | 5,000 – 25,000 | 2–4 weeks | 15% – 30% of build cost |
| Workflow Agent | 25,000 – 80,000 | 4–10 weeks | 15% – 30% of build cost |
| Enterprise Agentic System | 150,000 – 300,000+ | 10–24 weeks | 15% – 30% of build cost |
| Custom Computer Vision Platform | 500,000+ | 6–12 months | 15% – 30% of build cost |
Simple Task Agents
These systems automate structured, rule-based processes such as:
• Invoice classification
• Ticket routing
• FAQ response systems
• Document extraction
They require limited orchestration logic and minimal custom infrastructure. ROI can often be realized within a single fiscal quarter.
Workflow Agents
Workflow agents coordinate multi-step processes across systems, APIs, and databases. They typically involve:
• Retrieval-augmented pipelines
• Tool integrations
• Decision-branch logic
• Role-based access controls
These systems introduce moderate engineering complexity and require more robust monitoring and evaluation frameworks.
Enterprise Agentic Systems
Enterprise-grade agentic systems are designed for autonomous multi-agent coordination, long-horizon task execution, and integration across mission-critical systems.
Key characteristics include:
• Memory persistence layers
• Multi-agent orchestration
• Safety and guardrail frameworks
• Observability dashboards
• Custom evaluation benchmarks
• Compliance and audit logging
Such deployments often require 10–24 weeks and cross-functional collaboration across engineering, data, security, and legal teams.
Custom Computer Vision Platforms
High-end custom computer vision platforms—especially in manufacturing, healthcare, or logistics—frequently exceed 500,000 USD due to:
• Data labeling pipelines
• Edge-device optimization
• Model retraining loops
• Hardware integration
• Latency optimization requirements
Primary Cost Drivers in AI Projects
Data Preparation: 40–60% of Total Budget
Across nearly all AI deployments, data availability and preparation remain the dominant cost component.
Budget allocation breakdown typically resembles:
| Cost Component | % of Total Budget |
|---|---|
| Data Cleaning & Labeling | 25% – 40% |
| Data Engineering | 15% – 25% |
| Model Development | 20% – 30% |
| Infrastructure Setup | 10% – 20% |
| Monitoring & Compliance | 5% – 10% |
Poor data quality extends timelines and increases retraining cycles. Agencies with established data pipelines often provide disproportionate value in this phase.
Infrastructure Cost Dynamics
Compute remains a major operational variable.
On major cloud providers such as Amazon Web Services and Google Cloud Platform, GPU instance pricing typically ranges:
• 1–3 USD per hour for basic GPU compute
• 15–30+ USD per hour for high-performance H100 or B200-class GPUs
For context:
• A training job running 500 hours on a 20 USD/hour instance costs 10,000 USD
• Continuous production inference at scale can exceed 5,000–20,000 USD per month depending on volume
Operating Cost Rule of Thumb
Annual operating expenses for AI systems typically range between 15–30 percent of the original build cost.
This includes:
• Cloud infrastructure
• Model monitoring
• Retraining cycles
• API usage fees
• Security patching
• Technical support
Build vs. Buy Decision Matrix (2026)
| Factor | Build In-House | Specialized Agency |
|---|---|---|
| Upfront Hiring Cost | High | Low |
| Time to Market | Slow | Fast |
| Long-Term Cost Control | High (after setup) | Moderate |
| Knowledge Retention | High | Moderate |
| Risk of Misexecution | High (if inexperienced) | Lower (if proven agency) |
| Scalability | Moderate | High |
When to Build
• Long-term AI core competency is strategic
• Ongoing product differentiation depends on proprietary models
• Internal data moat is significant
• Budget supports senior AI hires
When to Buy
• Immediate deployment required
• Limited internal AI expertise
• One-off or limited-scope automation projects
• Budget constrained by hiring scarcity
Strategic Considerations for 2026
The rising cost of senior AI engineers—often exceeding 250,000 USD fully loaded in the US—means building an internal team may require multi-million-dollar annual payroll commitments.
By contrast, agencies convert:
• Fixed payroll risk → project-based capital expense
• Long recruitment cycles → immediate execution
• Skill scarcity → on-demand access
However, over-reliance on agencies can create dependency and limit institutional learning.
Capital Allocation Perspective
The build vs. buy decision increasingly mirrors enterprise IT outsourcing decisions of the early cloud era.
Organizations must evaluate:
• Core vs. non-core AI capabilities
• Time-to-value urgency
• Data complexity
• Internal governance readiness
• Long-term maintenance burden
In 2026, the specialized AI agency model functions as a strategic accelerator. For many firms, it provides a bridge—allowing rapid AI deployment while internal capabilities mature.
The most effective enterprises blend both approaches:
• Agencies for rapid system deployment
• Internal teams for long-term optimization and differentiation
AI capability is now both a technological and financial architecture decision.
10. The Global Cost of Living and Take-Home Pay Parity
In a distributed AI workforce, compensation benchmarking cannot rely on nominal salary alone. Organizations competing for global AI talent must evaluate purchasing power parity (PPP), tax structures, and local cost-of-living indices to determine whether offers are truly competitive.
A $150,000 offer may be average in one market and elite in another. The key variable is real disposable income after taxes and living expenses.
Cost of Living Index Comparison (NYC = 100)
The following benchmarks illustrate relative purchasing power across major global AI hubs.
| City Hub | Cost of Living Index (NYC = 100) | Single Expat – Monthly Expense (Comfortable) | Family of 4 – Monthly Expense |
|---|---|---|---|
| San Francisco | 87.5 | $6,757 | $12,335 |
| Zurich | 84.3 | $6,502 | $12,739 |
| London | 79.5 | $6,478 | $12,113 |
| Singapore | 81.2 | $6,225 | $12,736 |
| Boston | 78.0 | $6,441 | $11,368 |
| Amsterdam | 72.0 | $4,856 | $9,389 |
| Austin | 68.0 | $4,758 | $9,557 |
| Berlin | 65.0 | $4,450 | $8,200 |
| Bangalore | 28.0 | $1,500 | $3,200 |
| Ho Chi Minh City | 26.0 | $1,400 | $2,950 |
Real Salary Power: Why Geography Matters
The disparity in monthly expenses explains a critical phenomenon in global hiring:
• A $200,000 salary in San Francisco often delivers middle-upper class comfort
• A $100,000 salary in Bangalore or Ho Chi Minh City can deliver top-tier lifestyle positioning
Example: Disposable Income Comparison
Scenario A: San Francisco
Salary: $200,000
Effective tax (federal + state + payroll, est.): ~35%
Take-home: ~$130,000
Annual living cost (~$6,757 × 12): ~$81,000
Estimated disposable income: ~$49,000
Scenario B: Bangalore
Salary: $100,000
Effective tax (India high bracket est.): ~30%
Take-home: ~$70,000
Annual living cost (~$1,500 × 12): ~$18,000
Estimated disposable income: ~$52,000
Despite half the nominal salary, disposable income is higher in Bangalore.
Strategic Compensation Anchoring Models
Organizations typically adopt one of three global pay strategies:
Location-Based Pay
Compensation is indexed to the employee’s local cost of living.
Advantages:
• Cost efficiency
• Internal equity by geography
• Predictable margin control
Risks:
• May demotivate top-tier talent relocating to lower-cost markets
Role-Based Global Benchmarking
Compensation tied to global role value rather than geography.
Advantages:
• Strong employer brand
• Attracts elite distributed talent
• Reduces negotiation friction
Risks:
• Payroll inflation
• Internal pay compression
80th Percentile Anchor Strategy (Hybrid Model)
High-performing organizations increasingly:
• Anchor offers to the 80th percentile of the national average in the employer’s home country
• Allow remote employees to reside in lower-cost regions
This creates:
• High perceived fairness
• Exceptional purchasing power for employees
• Strong retention
• Lower replacement risk
This model is especially effective in AI engineering roles where output, not physical presence, drives value.
Take-Home Pay Parity: Beyond Cost of Living
Cost of living is only one dimension. True competitiveness requires analyzing:
Tax Structures
Effective tax rates vary dramatically:
• Progressive tax systems in Western Europe
• Territorial tax advantages in Singapore
• Lower total burden in certain Southeast Asian jurisdictions
Gross salary parity does not equal net parity.
Social Benefits and Healthcare
In cities like Zurich or Berlin, higher taxes may offset:
• Public healthcare
• Subsidized education
• Strong public infrastructure
In contrast, US-based employees may allocate significant income toward:
• Private health insurance
• Childcare
• Retirement contributions
Currency Stability and Inflation Risk
Emerging markets may offer lower living costs but introduce:
• Currency volatility
• Inflation exposure
• Regulatory risk
Compensation structures may need:
• USD-denominated contracts
• FX adjustment clauses
• Quarterly currency reviews
Retention Impact of Purchasing Power Optimization
Data from distributed workforce studies consistently shows:
• Employees experiencing high purchasing power relative to peers report higher job satisfaction
• Voluntary attrition decreases when real disposable income increases
• Geographic arbitrage increases perceived career advantage
When organizations allow employees to live in lower-cost regions while earning near top-tier global compensation:
• Lifestyle flexibility improves
• Savings rates increase
• Burnout declines
This directly correlates with long-term retention in high-demand AI roles.
Executive Decision Framework
When structuring global AI compensation in 2026, organizations should evaluate:
| Variable | Key Question |
|---|---|
| Cost of Living | What is the employee’s local expense baseline? |
| Effective Tax Rate | What is real take-home pay after tax? |
| Purchasing Power | How does disposable income compare globally? |
| Replacement Risk | How competitive is the local AI market? |
| Brand Positioning | Does pay strategy signal premium or cost arbitrage? |
Strategic Takeaway
In a global AI labor market, nominal salary figures are misleading.
What determines competitiveness is:
Real Take-Home Pay
- Purchasing Power
- Lifestyle Quality
- Long-Term Financial Security
A well-structured global compensation strategy recognizes that a $100,000 salary in Bangalore or Ho Chi Minh City can provide significantly greater lifestyle leverage than a $200,000 salary in San Francisco.
Organizations that design compensation around real economic value rather than geography alone achieve:
• Higher retention
• Stronger employer brand
• Better capital efficiency
• Greater talent satisfaction
In 2026, global pay parity is no longer a payroll issue—it is a strategic advantage in the race for elite AI talent.
11. Future Outlook
The 2026 AI labor market is governed by new economic dynamics shaped by agentic systems, compute scarcity, and globalized talent mobility. The rise of autonomous multi-agent architectures has compressed demand for generalist software engineering while sharply increasing demand for orchestration, alignment, and systems-level AI expertise.
The “generalist” developer is increasingly commoditized. The “specialist” AI engineer capable of designing, evaluating, and governing autonomous systems has become a strategic asset class.
This structural shift represents more than wage inflation. It signals a reorganization of human capital around AI-native capabilities.
Structural Shift: From Code Execution to Autonomous Orchestration
The transition toward agentic architectures requires engineers who can:
• Design multi-agent coordination frameworks
• Implement retrieval-augmented and tool-using systems
• Build evaluation and safety pipelines
• Optimize inference at scale
• Integrate observability and governance controls
These competencies are scarce and difficult to substitute. Organizations unable to hire at this level face compounding competitive disadvantages.
Adopt a Zonal Compensation Strategy
Global compensation is increasingly structured around “zone economics” rather than national averages.
Tier-1 hubs such as San Francisco and London continue to dictate the global salary ceiling for elite AI engineers. However, meaningful cost efficiency exists in Tier-3 and Tier-4 cities where purchasing power arbitrage is substantial.
Zonal Efficiency Framework
| Zone | Example Markets | Relative Salary Index | Talent Density | Strategic Use Case |
|---|---|---|---|---|
| Zone 1 | San Francisco, London | 100% | Very High | Leadership, research, architecture |
| Zone 2 | Berlin, Amsterdam | 75–85% | High | Applied ML, MLOps |
| Zone 3 | Bangalore, Ho Chi Minh City | 40–60% | Growing | Development-heavy execution |
| Zone 4 | Secondary LATAM / SEA hubs | 30–50% | Emerging | Scaling production initiatives |
A zonal model allows organizations to maintain a premium leadership layer in Zone 1 while optimizing engineering throughput in Zones 3 and 4.
Leverage Global Arbitrage Strategically
Nearshore regions in Latin America and offshore hubs in Asia—particularly Ho Chi Minh City and Bangalore—provide 60–80% cost savings for development-intensive initiatives.
However, arbitrage must be capability-aligned, not purely cost-driven.
Appropriate for arbitrage:
• Model integration
• Evaluation tooling
• Data pipeline engineering
• Feature deployment
Less suitable for pure arbitrage:
• Safety-critical systems
• Alignment research
• Core model architecture
• Autonomous system governance
Cost savings without capability parity increases systemic risk.
Budget for Specialization Premiums
As AI systems move from prototype to production, three domains command premium compensation:
AI Safety
Alignment Engineering
MLOps and Model Governance
Specialists in these domains typically command 25–45% salary premiums compared to standard ML engineers.
Why the Premium Exists
• Regulatory scrutiny is increasing
• Enterprise risk tolerance is declining
• Model evaluation complexity is growing
• Autonomous failure modes are high impact
Production-grade AI systems require not only performance but reliability, traceability, and controllability.
Incentivize with Infrastructure: The Rise of Compute Equity
Elite AI engineers increasingly evaluate employers based on infrastructure access.
High-performance GPUs—such as NVIDIA H100 and B200-class accelerators—are strategic leverage points. Restricted compute environments reduce experimentation velocity and degrade employer attractiveness.
Organizations can differentiate by offering:
• Dedicated GPU quotas
• Research experimentation budgets
• “Compute equity” allocations tied to innovation milestones
• 10–20% protected research time
This mirrors historical models where top firms competed on lab access rather than salary alone.
The Talent Gap Toward 2030
Global demand for AI specialization continues to outpace supply due to:
• Rapid enterprise AI adoption
• Government investment in sovereign AI
• Proliferation of agentic systems
• Regulatory-driven compliance requirements
The widening gap increases:
• Compensation volatility
• Poaching frequency
• Counteroffer inflation
• Retention risk
Organizations unable to establish structured talent pipelines and internal training ecosystems will face escalating acquisition costs.
The Economics of Scarcity
Three economic laws define the 2026 AI labor market:
Skill Scarcity Law
The rarer the capability, the greater the compounding wage premium.
Infrastructure Leverage Law
Engineers gravitate toward environments where experimentation velocity is highest.
Global Mobility Law
Top AI talent is geographically fluid; compensation must reflect global opportunity cost, not local averages.
Strategic Implications for Organizations
To remain competitive, organizations must:
Adopt multi-zone compensation architecture
Blend premium hubs with cost-efficient execution centers
Budget explicitly for safety and alignment premiums
Invest in infrastructure access as a recruiting differentiator
Develop internal upskilling programs to reduce long-term dependence on external markets
Failure to implement these adjustments will result in:
• Escalating hiring cycles
• Increased attrition
• Inferior production reliability
• Reduced innovation velocity
The Great Recalibration
The “Great Recalibration” of 2026 is not a temporary salary spike. It is a structural redistribution of value toward AI-native specialization.
The organizations that dominate the next industrial cycle will be those that:
• Secure scarce specialist talent
• Architect compensation globally
• Align incentives with compute access
• Institutionalize AI governance expertise
AI talent is no longer a support function. It is the primary engine of enterprise competitiveness.
Between 2026 and 2030, the decisive variable separating market leaders from marginalized incumbents will not be capital alone—but the ability to recruit, empower, and retain senior AI engineering talent at scale.
Conclusion
The cost to hire AI engineers in 2026 is no longer a straightforward salary calculation. It is a multidimensional strategic decision shaped by geography, specialization, infrastructure access, regulatory exposure, and long-term workforce planning. Organizations that approach AI hiring as a simple compensation benchmark will consistently underestimate the real investment required to build production-grade AI capability.
Across global markets, the economic landscape has fundamentally shifted. The rise of agentic systems, autonomous workflows, and large-scale model orchestration has transformed AI engineering from a niche technical role into one of the most strategically valuable functions inside modern enterprises. As a result, compensation structures have recalibrated to reflect scarcity, specialization depth, and production accountability.
Global Salary Benchmarks: A Structural Divide
In Tier-1 innovation hubs such as San Francisco and London, senior AI engineers command premium total compensation packages driven by competitive density and venture-backed demand. Fully loaded annual costs—when accounting for salary, bonuses, equity, benefits, taxes, infrastructure, and recruitment overhead—can exceed $250,000 to $400,000 per engineer.
Meanwhile, high-growth markets like Bangalore and Ho Chi Minh City offer substantial purchasing power advantages. While nominal salaries are lower, real take-home value is significantly higher relative to local living costs. This geographic arbitrage enables organizations to achieve 60–80% cost efficiency on development-heavy initiatives without sacrificing quality—provided hiring standards remain rigorous.
However, cost savings must not be confused with capability parity. Elite AI architecture, alignment engineering, and production-grade MLOps remain globally scarce, regardless of location. The premium attached to these roles is universal.
Beyond Base Salary: The Full Cost Model
The complete cost to hire AI engineers in 2026 includes multiple components:
Base Compensation
Equity or Long-Term Incentives
Signing Bonuses and Retention Packages
Recruitment Fees (often 20–30% of annual salary)
Infrastructure Allocation (GPU compute, cloud credits)
Tooling and Licensing Costs
Compliance and Governance Overhead
Ongoing Training and Research Budget
When aggregated, these elements can increase total first-year expenditure by 30–50% above advertised base salary figures.
Infrastructure, in particular, has become a decisive variable. Access to high-performance GPU environments and scalable cloud platforms is now an implicit part of compensation. Engineers evaluating offers increasingly consider compute availability as a form of “technical equity.” Organizations that restrict experimentation capacity will struggle to attract senior-level AI talent regardless of salary competitiveness.
Specialization Premiums Are Permanent, Not Cyclical
One of the defining characteristics of the 2026 AI labor market is the widening gap between generalist software engineers and specialized AI practitioners. Professionals skilled in AI safety, alignment research, model governance, distributed training systems, and agentic orchestration command compensation premiums of 25–45% above standard machine learning roles.
This premium reflects structural risk. Production AI systems now operate in customer-facing, compliance-sensitive, and revenue-critical environments. The cost of failure is reputational, financial, and regulatory. As AI deployment scales across healthcare, finance, logistics, and public infrastructure, the need for reliability and governance expertise will only intensify.
Organizations that fail to budget for these specialization premiums risk under-hiring for safety and overexposing themselves to systemic risk.
The Zonal Compensation Strategy Advantage
A zonal compensation strategy has emerged as the most sustainable hiring model in 2026. Rather than anchoring salaries solely to headquarters geography, leading enterprises now architect global pay bands across multiple tiers:
Tier-1 hubs for leadership, research, and architectural design
Tier-2 markets for applied machine learning and MLOps
Tier-3 and Tier-4 markets for scaled engineering execution
This distributed model balances innovation density with cost efficiency. It also reduces single-market dependency risk and enhances retention by allowing flexible geographic mobility.
Companies that adopt this approach gain three advantages:
Lower blended payroll cost
Broader talent access
Higher retention through purchasing power optimization
The Retention Equation: Compensation Plus Infrastructure
Hiring AI engineers in 2026 is only half the equation. Retention is equally critical. Replacement costs for senior AI roles often exceed 1.5x annual salary when factoring in lost productivity and recruitment cycles.
Retention drivers now include:
Competitive global compensation
Meaningful equity participation
Dedicated research time
Access to modern compute infrastructure
Clear ownership of high-impact systems
Career progression in AI leadership tracks
Organizations that invest in these elements reduce churn and stabilize long-term AI capability.
Forecast Toward 2030
The global AI talent gap continues to widen as enterprise adoption accelerates. Governments are investing in sovereign AI programs. Corporations are embedding autonomous systems across operations. Startups are launching agentic platforms at unprecedented velocity.
This macro trend implies sustained wage pressure, especially for:
Senior AI Architects
AI Safety Engineers
Alignment Researchers
Distributed Systems Specialists
MLOps and Model Governance Experts
The cost to hire AI engineers is unlikely to normalize downward in the near term. Instead, compensation will increasingly stratify by specialization depth and production accountability.
Strategic Takeaways for Organizations
To successfully navigate the cost to hire AI engineers in 2026, organizations must:
Treat AI hiring as capital allocation, not HR expenditure
Adopt zonal compensation frameworks
Budget for specialization premiums
Account for infrastructure as part of compensation
Optimize for real take-home pay parity globally
Blend build-and-buy strategies where appropriate
Invest in retention infrastructure as aggressively as recruitment
Companies that approach AI hiring reactively will face escalating salary demands, extended vacancy periods, and innovation stagnation. Those that proactively structure global compensation architectures will secure the expertise necessary to lead in the AI-driven economy.
Final Perspective
The cost to hire AI engineers in 2026 reflects more than supply and demand—it represents the reorganization of economic value around artificial intelligence capability. The organizations that understand this shift and align their compensation, infrastructure, and workforce strategies accordingly will define the next decade of technological leadership.
In a world increasingly powered by autonomous systems and machine intelligence, AI engineering talent is no longer a support function. It is the primary engine of competitive advantage.
If you find this article useful, why not share it with your hiring manager and C-level suite friends and also leave a nice comment below?
We, at the 9cv9 Research Team, strive to bring the latest and most meaningful data, guides, and statistics to your doorstep.
To get access to top-quality guides, click over to 9cv9 Blog.
To hire top talents using our modern AI-powered recruitment agency, find out more at 9cv9 Modern AI-Powered Recruitment Agency.
People Also Ask
How much does it cost to hire an AI engineer in 2026 globally?
The cost ranges from $60,000 in emerging markets to $400,000+ total compensation in Tier-1 hubs like the US, depending on seniority, specialization, and equity packages.
What is the average AI engineer salary in the United States in 2026?
Senior AI engineers in the US typically earn $180,000–$250,000 base salary, with total compensation often exceeding $300,000 when bonuses and equity are included.
How does AI engineer salary vary by region in 2026?
Salaries are highest in North America and Western Europe, moderate in Eastern Europe, and significantly lower in Asia and Latin America due to cost-of-living differences.
Is it cheaper to hire AI engineers in Asia in 2026?
Yes, countries like India and Vietnam offer 60–80% lower salary costs compared to US markets while maintaining strong technical talent pools.
What is the cost to hire a machine learning engineer in 2026?
Machine learning engineers earn between $90,000 and $220,000 globally, depending on region, experience level, and production system expertise.
What factors influence AI engineer hiring costs in 2026?
Key factors include specialization, location, infrastructure access, equity, tax structures, recruitment fees, and market demand for advanced AI skills.
How much does it cost to hire a senior AI engineer in 2026?
Senior AI engineers cost $200,000–$400,000 annually in Tier-1 hubs when factoring in salary, bonuses, benefits, and infrastructure expenses.
Are AI safety engineers more expensive in 2026?
Yes, AI safety and alignment specialists command 25–45% salary premiums due to regulatory pressure and production risk management needs.
What is the total first-year cost of hiring an AI engineer?
The first-year cost is often 30–50% higher than base salary due to signing bonuses, recruitment fees, onboarding, cloud infrastructure, and training budgets.
How much do AI engineers earn in Europe in 2026?
In Western Europe, senior AI engineers typically earn $120,000–$200,000, while Eastern Europe averages $70,000–$120,000.
What is the cost difference between hiring in the US and India?
Hiring in India can reduce payroll costs by up to 70% compared to US salaries, while still providing access to experienced AI professionals.
Do AI engineers receive equity in 2026?
Yes, equity is common in startups and tech firms, often adding 10–40% to total compensation depending on company stage and role seniority.
How does cost of living affect AI engineer salaries?
Higher living costs in cities like San Francisco and London push salaries upward, while lower-cost regions enable competitive pay with higher purchasing power.
What is the average AI developer salary worldwide in 2026?
Globally, AI developer salaries range from $60,000 to $250,000+, depending on geography, experience, and technical specialization.
Is remote hiring reducing AI engineer salary costs?
Remote hiring allows access to lower-cost regions, but elite talent often benchmarks pay against global standards rather than local averages.
How much does it cost to hire an MLOps engineer in 2026?
MLOps engineers typically earn $130,000–$230,000 in advanced markets, reflecting their critical role in deployment and model governance.
Why are AI engineer salaries increasing in 2026?
Rapid enterprise AI adoption, agentic systems growth, and limited specialist supply are driving sustained wage inflation worldwide.
What is the salary of AI engineers in Latin America in 2026?
Senior AI engineers in Latin America earn approximately $70,000–$140,000, offering cost-efficient nearshore alternatives for US companies.
How much should startups budget for AI hiring in 2026?
Startups should budget at least $200,000–$350,000 per senior AI hire when including salary, equity, infrastructure, and recruitment costs.
Do AI engineers require dedicated GPU budgets?
Yes, infrastructure costs such as GPU cloud instances can add thousands per month per engineer, impacting total hiring expenses.
What is the cost to hire entry-level AI engineers in 2026?
Entry-level AI engineers typically earn $60,000–$120,000 globally, depending on region and technical proficiency.
How does specialization impact AI engineer pay?
Specialists in AI safety, alignment, distributed systems, and agentic architecture earn significantly more than generalist developers.
What recruitment fees apply when hiring AI engineers?
Recruitment agencies often charge 20–30% of annual base salary, significantly increasing the first-year hiring cost.
How much do AI engineers earn in Southeast Asia in 2026?
In Southeast Asia, experienced AI engineers earn $50,000–$120,000, depending on expertise and international project exposure.
Is hiring offshore AI engineers cost-effective in 2026?
Offshore hiring can reduce development costs by 50–80%, but success depends on quality standards, communication, and governance frameworks.
What is the cost to hire a generative AI engineer in 2026?
Generative AI specialists often earn $150,000–$300,000+ in advanced markets due to demand for LLM and agentic system expertise.
How does equity compensation affect total AI hiring costs?
Equity increases total compensation value but may reduce upfront cash outflow, depending on vesting schedules and company growth stage.
Are AI engineer salaries expected to rise after 2026?
Yes, ongoing talent shortages and expanding AI adoption suggest continued salary growth through 2030.
What is the most cost-efficient region to hire AI engineers in 2026?
India, Vietnam, and parts of Eastern Europe offer the most competitive balance of cost savings and technical capability.
How can companies optimize AI hiring budgets in 2026?
Organizations should adopt zonal compensation strategies, leverage global arbitrage, budget for specialization premiums, and invest in retention to control long-term costs.
Sources
MRJ Recruitment
Rise
BEON.tech
Qubit Labs
9cv9
Softspace Solutions
Remotely Talents
NetCom Learning
SmartDev
Euro Top Tech
Schiff Sovereign
Jeevi Academy
Playroll
BrainSource
Index.dev
Hire in South
Leap Scholar
SSBM Geneva
FMC Group
Omega Trove Consulting
IRIS Software Group
Cintra
RBA Group
UK Government
Trading Economics
Slasify
Howdy
KPMG
Gloat
Sparkout Tech
Groovy Web
Elsner Technologies
Visual Capitalist

")


