

 Software in 2026")


")


")


Key Takeaways
- Specialized tech roles in AI, cybersecurity, and cloud architecture command the highest salary growth across global SaaS markets in 2026.
- Total compensation packages, including remote flexibility, equity, and wellness benefits, are key to attracting and retaining top software talent.
- Emerging markets like Vietnam and the UAE are experiencing rapid salary growth, reshaping global hiring and workforce strategies in the SaaS industry.
As we step into 2026, the global Software and SaaS (Software-as-a-Service) industry stands at a critical intersection of innovation, automation, and evolving workforce dynamics. With rapid advancements in artificial intelligence, cloud computing, cybersecurity, and data-driven decision-making, the demand for skilled technology professionals has never been higher. At the heart of this demand lies a pressing question for both employers and professionals: what are the expected salary benchmarks across key roles, regions, and specializations in the tech world today?
Also, read our latest guide on the top SaaS recruitment agencies in the world.

This comprehensive salary guide explores how compensation trends in the software and SaaS sector are shifting on a global scale, offering deep insight into the financial realities shaping today’s digital workforce. From software engineers and AI specialists to DevOps professionals, cybersecurity leaders, and SaaS sales executives, the market has become increasingly diverse, both in terms of salary structures and compensation strategies. The traditional salary model is being redefined by a mix of base pay, performance-based incentives, equity offerings, and flexible work arrangements, particularly in high-growth economies and innovation hubs.
In 2026, the global SaaS market is expected to surpass a valuation of $1.2 trillion, with North America, Western Europe, and Asia-Pacific leading the charge in terms of both technology adoption and talent acquisition. Meanwhile, regions like the Middle East, Southeast Asia, and Latin America are witnessing accelerated hiring and wage growth due to economic diversification and investment in digital transformation. With a global workforce increasingly embracing remote work and cross-border collaboration, salary expectations are no longer limited by geography alone but instead reflect a new era of global pay parity, skills-based compensation, and talent mobility.
Another defining trend in 2026 is the widening salary gap between technical specialists and generalist roles. Professionals skilled in cybersecurity, machine learning, cloud infrastructure, and AI engineering are commanding premium compensation as organizations prioritize innovation and digital resilience. Conversely, roles tied to repetitive or legacy IT tasks are seeing slower wage growth, if not stagnation, as automation reshapes enterprise operations and leaner tech stacks become the norm.
The importance of job titles, experience levels, company funding stages, and even sectoral focus (e.g., fintech, healthcare tech, or manufacturing SaaS) cannot be overlooked. Whether you’re a job seeker aiming to benchmark your market worth, a startup founder planning your talent budget, or an HR leader aligning internal compensation with external trends, this salary guide offers reliable data and practical insights to make informed decisions.
Throughout this guide, readers will find detailed salary comparisons by role, geography, experience level, and industry vertical, including tables and matrices designed to present clean and accurate compensation data. Special emphasis is given to regions such as the United States, United Kingdom, Singapore, Vietnam, the UAE, and emerging tech markets across Europe and APAC. Key highlights include evolving trends in SaaS sales compensation, the rise of customer success as a revenue stabilizer, and the influence of AI on pay structures for technical teams.
In short, this report serves as a strategic tool for understanding how the global software and SaaS talent economy is evolving in 2026 and how salary benchmarks are shaping workforce strategy across borders. With competitive hiring intensifying and companies striving to attract and retain top tech talent, knowing the current compensation landscape is no longer optional—it’s essential.
Before we venture further into this article, we would like to share who we are and what we do.
About 9cv9
9cv9 is a business tech startup based in Singapore and Asia, with a strong presence all over the world.
With over nine years of startup and business experience, and being highly involved in connecting with thousands of companies and startups, the 9cv9 team has listed some important learning points in this overview of Salaries in the Software & SaaS Industry in 2026: A Complete Guide.
If your company needs recruitment and headhunting services to hire top-quality employees, you can use 9cv9 headhunting and recruitment services to hire top talents and candidates. Find out more here, or send over an email to [email protected].
Or just post 1 free job posting here at 9cv9 Hiring Portal in under 10 minutes.
Salaries in the Software & SaaS Industry in 2026: A Complete Guide
- The North American Benchmark: US Market Dominance and Hub Dynamics
- Artificial Intelligence and Machine Learning: The Premium Economy
- Cybersecurity and Infrastructure: Resilience as a Competitive Asset
- Global Perspective: International Salary Rankings and Trends
- Asia-Pacific and the Middle East: Emerging Hubs of Innovation
- SaaS Sales and Customer Success: The Revenue Engine
- Cross-Functional Analysis: Technology Across Industries
- Workforce Strategy: Benefits, Flexibility, and Calculation
- Strategic Synthesis and Future Outlook
1. The North American Benchmark: US Market Dominance and Hub Dynamics
a. Metropolitan Variance and Cost of Living Integration
The global software and SaaS industry continues to experience significant growth in 2026, with evolving salary trends reflecting changes in work models, economic shifts, and digital transformation across regions. Among all markets, the United States remains the most dominant force—both in terms of market share and compensation. This guide presents a detailed look at how software professionals are paid globally, with a deep dive into the United States as a benchmark, while considering key factors like location, company stage, and role.
The United States as the Global Compensation Leader
The United States holds a commanding position in the global SaaS industry, contributing nearly 48% to the total global SaaS market. It is home to more than 17,000 SaaS companies, ranging from large-scale tech giants to emerging startups. This dominance translates directly into higher salary ranges for software professionals across the country.
However, the salary structure in the U.S. is far from uniform. Geographic location, cost of living, company size, and funding stage all significantly influence how much a software or SaaS employee earns.
Regional Salary Disparities Across U.S. Tech Hubs
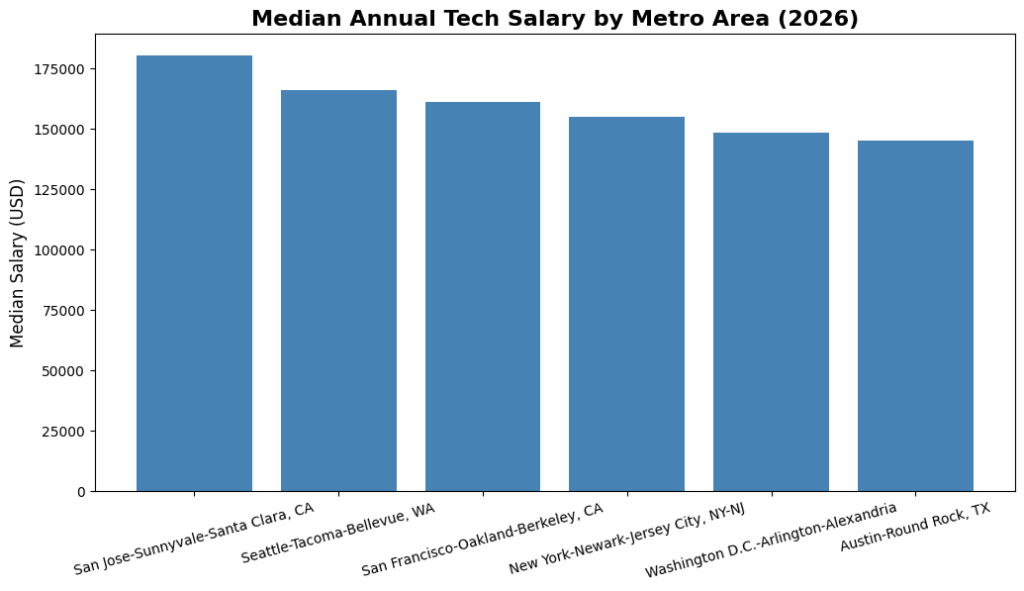
In 2026, salary differences between U.S. cities remain notable despite the normalization of remote work. Cities with a strong tech ecosystem, high industry concentration, and higher living costs still offer higher compensation. Key metropolitan areas such as San Jose, Seattle, and San Francisco continue to lead the nation in median tech salaries.
Below is a comparative overview of median salaries, total job availability, and cost of living index (COL Index) across major U.S. tech hubs:
U.S. Tech Hub Compensation and Cost Overview (2026)
| Metro Area | Median Annual Salary | Total Tech Jobs | Cost of Living Index |
|---|---|---|---|
| San Jose-Sunnyvale-Santa Clara, CA | $180,320 | 98,420 | 272 |
| Seattle-Tacoma-Bellevue, WA | $165,750 | 112,340 | 182 |
| San Francisco-Oakland-Berkeley, CA | $160,870 | 71,280 | 240 |
| New York-Newark-Jersey City, NY-NJ | $155,000 | 195,000 | 210 |
| Washington D.C.-Arlington-Alexandria | $148,220 | 85,000 | 155 |
| Austin-Round Rock, TX | $145,000 | 45,000 | 115 |
This data clearly indicates that cities with strong technology ecosystems tend to offer more lucrative compensation packages, although they also come with a higher cost of living. The correlation between tech job density and salary level remains consistent in 2026.

The Influence of On-Site Work on Salary Trends
The return-to-office (RTO) trend is emerging as a critical driver of compensation growth in major urban markets. Despite the widespread shift to remote work, a growing number of companies—especially large enterprises—are pushing for hybrid or full-time office attendance. This movement is reshaping salary structures in several key cities.
The following table outlines recent salary growth rates linked to RTO demands in selected cities:
Year-over-Year Salary Growth by RTO-Driven Cities (2026)
| City | Year-over-Year Salary Increase | Notes |
|---|---|---|
| New York City | 10% | Strong push for in-office presence |
| Washington D.C. | 6% | Federal contractors and major firms leading RTO |
| Atlanta | 6% | Growing enterprise cluster with on-site models |
Research indicates that 78% of business leaders in large organizations agree that employees who work on-site tend to receive higher compensation. This highlights a renewed prioritization of in-person collaboration, especially in enterprise environments where teamwork and physical presence are considered strategic advantages.
Conclusion and Implications for Employers and Candidates
In summary, the U.S. remains the gold standard for software and SaaS industry compensation in 2026. While high-paying cities offer strong financial rewards, they also bring a higher cost of living. At the same time, compensation trends are being reshaped by return-to-office policies, with increased pay for on-site roles—especially in cities where large employers are headquartered.
Key insights for candidates:
- Location continues to play a major role in salary negotiations.
- Remote roles may offer flexibility but may come with slightly lower pay in 2026.
- Professionals willing to work on-site in high-cost tech hubs can expect faster salary growth.
Key insights for employers:
- Competitive salaries remain essential to attract top talent in core tech cities.
- Organizations embracing hybrid or on-site work models must balance compensation with location-based expectations.
- Leveraging regional salary benchmarks helps optimize hiring strategies in a globally competitive SaaS talent market.
b. Software Engineering Seniority and Compensation Scaling
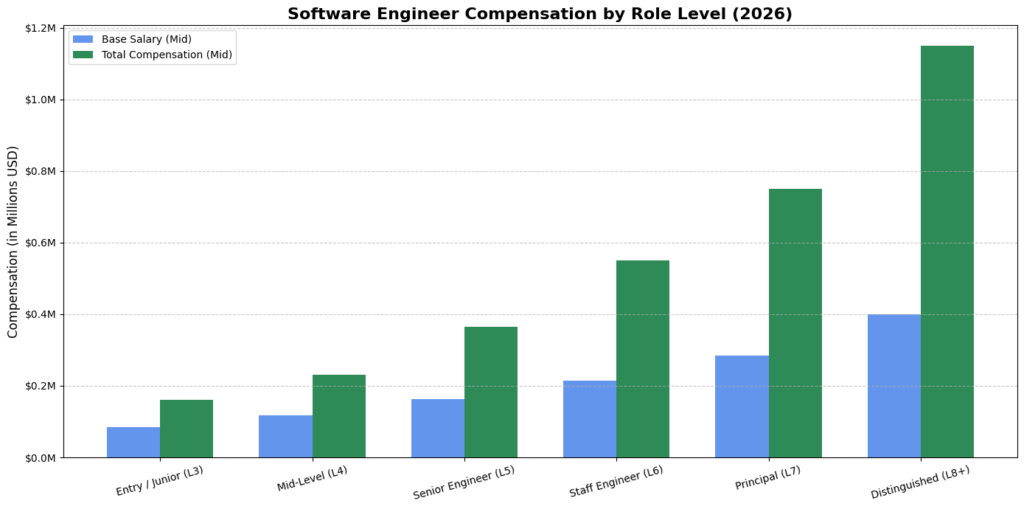
The structure of engineering roles in tech companies is typically divided into levels that align with both years of experience and scope of responsibilities. Each step up the ladder comes with significantly higher expectations and a larger compensation package. While base salaries are important, equity and bonuses can often double or even triple the total compensation at senior and executive levels.
Engineering Salary Benchmark by Level (United States & Top Tech Firms in 2026)
The following table illustrates estimated compensation ranges in 2026 based on standard U.S. tech leveling, particularly within top-tier firms:
Software Engineer Compensation Matrix – 2026 (USD)
| Role Level | Years of Experience | Base Salary Range | Estimated Total Compensation (FAANG / Unicorns) |
|---|---|---|---|
| Entry / Junior (L3) | 0 – 2 years | $75,000 – $95,000 | $120,000 – $200,000 |
| Mid-Level (L4) | 2 – 5 years | $95,000 – $140,000 | $180,000 – $280,000 |
| Senior Engineer (L5) | 5 – 8 years | $140,000 – $185,000 | $280,000 – $450,000 |
| Staff Engineer (L6) | 8 – 12 years | $180,000 – $250,000 | $400,000 – $700,000 |
| Principal (L7) | 12+ years | $220,000 – $350,000 | $600,000 – $900,000 |
| Distinguished (L8+) | 15+ years | $300,000 – $500,000 | $800,000 – $1,500,000+ |
Key Observations:
- Entry-level roles typically focus on coding fundamentals, debugging, and minor enhancements.
- Mid-level engineers take ownership of features, contribute to architecture discussions, and begin managing complexity in systems.
- Senior engineers lead design decisions, mentor teams, and drive large-scale projects with strategic importance.
- At the Staff and Principal levels, engineers are responsible for setting long-term technical vision, influencing cross-team architecture, and often partnering closely with executive leadership.
- Distinguished engineers and technical fellows operate at an executive level, shaping company-wide engineering standards and roadmaps.
Distribution of Compensation: Base Pay vs Equity and Bonuses
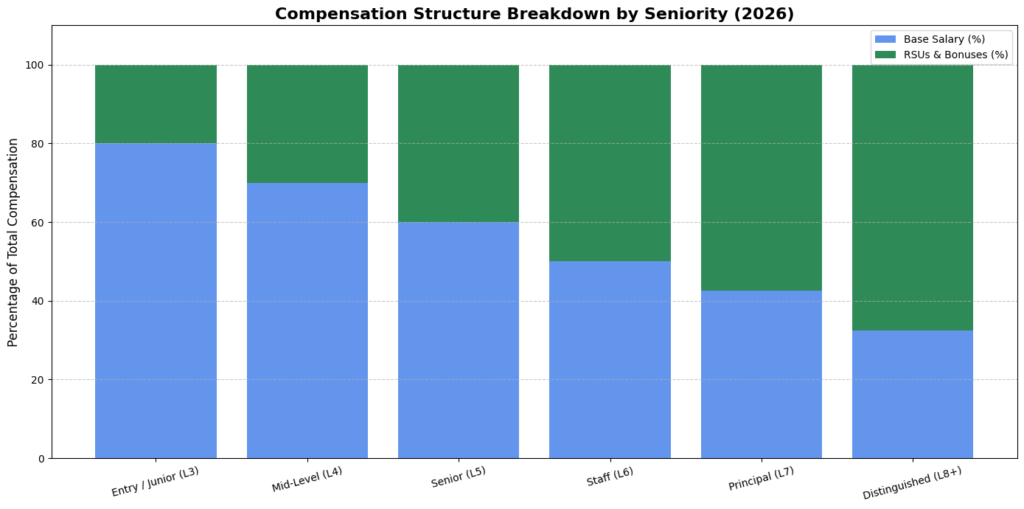
As professionals advance in their careers, base salary becomes just one component of their overall earnings. Equity grants (RSUs) and performance bonuses form a substantial part of total compensation at the higher levels, particularly in fast-growing or publicly traded companies.
Compensation Structure Breakdown by Seniority
| Level | Base Salary (%) | RSUs & Bonuses (%) | Notes on Structure |
|---|---|---|---|
| Entry / Junior (L3) | 75% – 85% | 15% – 25% | Base-heavy, minimal stock or bonus components |
| Mid-Level (L4) | 65% – 75% | 25% – 35% | Modest equity, growing performance-based bonuses |
| Senior (L5) | 55% – 65% | 35% – 45% | Mix of base pay and equity, linked to long-term goals |
| Staff (L6) | 45% – 55% | 45% – 55% | Larger RSUs and bonus plans tied to business impact |
| Principal (L7) | 35% – 50% | 50% – 65% | Highly leveraged on equity and performance incentives |
| Distinguished (L8+) | 25% – 40% | 60% – 75% | Majority of compensation derived from stock and bonuses |
Global Outlook and Applicability
While these benchmarks are based on U.S. figures, many multinational corporations follow similar leveling systems across their global offices, with adjusted base salaries based on location-specific cost of living and market rates. For example:
- A Staff Engineer in London may earn a base salary 20% lower than in San Francisco but still receive comparable equity options.
- A Senior Engineer in Singapore or Berlin might receive a higher base than their regional peers due to regional talent shortages, though equity packages may differ.
Conclusion: What This Means for Employers and Candidates in 2026
For candidates:
- Understanding career levels helps plan long-term growth and compensation goals.
- Equity and bonus packages matter more as seniority increases, often impacting wealth accumulation more than salary.
- Negotiation should focus not just on salary, but also on RSU refresh cycles, vesting schedules, and bonus triggers.
For employers:
- Competitive compensation at higher levels requires more than salary benchmarking; equity planning, retention strategies, and career path clarity are key.
- Startups and mid-size SaaS companies must offer compelling total rewards packages to compete with FAANG-level compensation, even if cash salaries are lower.
- Building structured engineering levels helps create transparent career paths and improves both hiring and retention.
2. Artificial Intelligence and Machine Learning: The Premium Economy
a. AI and Data Engineering Benchmarks
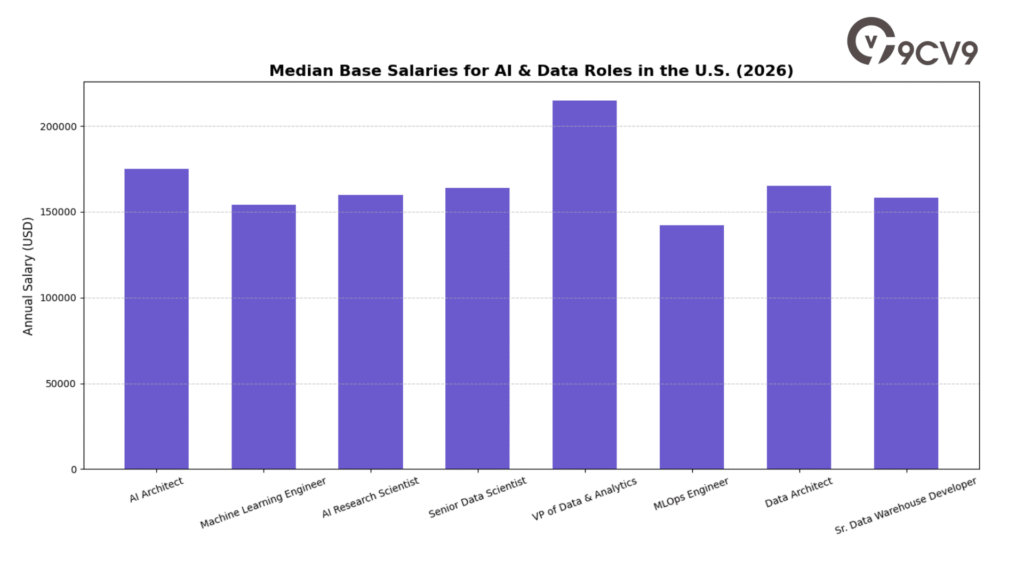
The demand for AI and ML professionals has seen an 88% year-over-year increase in hiring. This has led to what experts describe as a “two-speed market,” where salaries for generalist software roles remain stable—or in some regions, decline—while compensation for AI-related roles continues to surge.
Companies are allocating a greater portion of their salary budgets to attract and retain AI specialists, making these roles some of the most financially rewarding in 2026.
2026 AI & Data Role Salary Matrix – United States (Annual Base Salaries)
| Job Role | Typical Salary Range (Low–High) | Median / Average Salary |
|---|---|---|
| AI Architect | $142,750 – $196,750 | $175,000 |
| Machine Learning Engineer | $118,000 – $198,000 | $154,000 |
| AI Research Scientist | $124,000 – $210,000 | $160,000 |
| Senior Data Scientist | $132,000 – $204,000 | $164,000 |
| VP of Data & Analytics | $170,000 – $265,000 | $215,000 |
| MLOps Engineer | $110,000 – $178,000 | $142,000 |
| Data Architect | $135,000 – $185,000 | $165,000 |
| Senior Data Warehouse Developer | $138,000 – $178,000 | $158,000 |
These roles command significantly higher pay due to the advanced technical expertise required, the scarcity of talent, and the critical value AI now brings to business operations across sectors.
Shift in Entry-Level Hiring and the Rise of “AI Fluency”
One of the key developments in 2026 is the marked decline in hiring for junior roles in AI and software. Entry-level hiring at levels P1 and P2 has dropped by up to 73% in certain markets. This decline is closely tied to the increasing use of AI automation tools that can perform many of the routine tasks traditionally assigned to early-career engineers.
However, professionals who can demonstrate “AI fluency”—meaning they understand how to work with, adapt, and integrate AI tools into software development—are seeing enhanced compensation opportunities. These individuals are not just coders; they are AI-enabled contributors who help organizations accelerate digital transformation.
Premium Compensation for AI-Enabled Professionals in 2026
| Category | Average Premium Over Non-AI Peers |
|---|---|
| Individual Contributor Engineers (IC Track) | 12% higher |
| Engineering Managers and Tech Leads | 3% higher |
This premium reflects the business value of professionals who are both technically skilled and able to use AI tools to improve code quality, optimize systems, or accelerate feature delivery.
Strategic Importance of AI and ML Roles in the Global Market
Employers worldwide are redesigning their workforce models to prioritize AI and ML expertise. In the United States, Europe, and parts of Asia-Pacific, senior AI professionals are now considered strategic hires—on par with traditional leadership roles. As a result, compensation packages for these positions often include:
- Larger equity grants (RSUs)
- Performance bonuses tied to innovation metrics
- Flexible work structures and research allowances
Conclusion: AI and Machine Learning Careers Lead the Future of Tech Salaries
In 2026, the clearest salary growth is seen in AI-driven roles. Organizations are realigning their hiring strategies to attract and retain professionals who bring both deep technical skills and a strategic understanding of AI integration. Generalist engineers must now reskill or upskill to remain competitive in a market increasingly defined by automation, data intelligence, and machine learning innovation.
For job seekers, this represents a major opportunity: those who can adapt to this new reality by learning AI technologies and applying them effectively will continue to command top-tier salaries. For employers, competing for top AI talent means offering not just financial rewards, but also purpose-driven projects, cutting-edge resources, and room for innovation.
3. Cybersecurity and Infrastructure: Resilience as a Competitive Asset
a. Leadership and Architect Salaries in Security
The digital infrastructure of modern companies is constantly under pressure from new and more advanced cyber threats. As a result, employers are prioritizing security governance, risk management, and compliance. The average cybersecurity salary in the U.S. in 2026 has risen to approximately $191,665, while total compensation for senior roles—such as Chief Information Security Officers (CISOs)—can easily surpass $400,000 when including bonuses and equity.
Cybersecurity now plays a direct role in business growth, customer trust, and operational continuity, making it one of the most valuable areas within enterprise technology.
Cybersecurity Leadership and Architect Role Salary Matrix – United States (2026)
| Role / Title | Salary Range (Low–High) | Median / Average Salary |
|---|---|---|
| CISO | $185,000 – $310,000 | $235,000 |
| Head of Cybersecurity | $315,000 – $483,000 | $400,000 |
| Cloud Security Architect | $136,000 – $208,000 | $168,000 |
| Senior DevSecOps Engineer | $160,900 – $198,700 | $180,000 |
| Application Security Engineer | $120,302 – $153,235 | $136,000 |
| Cybersecurity Analyst | $92,000 – $152,000 | $118,000 |
| Information Security Analyst | $113,500 – $164,750 | $142,000 |
This table reflects the high demand and premium compensation for talent skilled in modern security architecture, cloud environments, and DevSecOps integration. These professionals play vital roles in safeguarding systems, data, and infrastructure.

The Rise of ERP Developers in Secure Digital Transformation
Another emerging trend in 2026 is the growing importance of internal Enterprise Resource Planning (ERP) specialists. As companies implement large-scale digital transformation initiatives, the need for secure, stable ERP systems becomes essential. These professionals help organizations manage vendor integrations, monitor internal risk, and streamline core business processes.
ERP developers are now viewed as key to maintaining operational security and efficiency, especially in industries that rely on complex, multi-system platforms such as manufacturing, logistics, and finance.
ERP Development and Integration Salary Overview – 2026
| Role | Typical Salary Range (Low–High) | Median Salary |
|---|---|---|
| ERP Developer (Mid-Level to Senior) | $115,000 – $165,000 | $143,500 |
| ERP Implementation Specialist | $108,000 – $155,000 | $138,000 |
| ERP Security and Compliance Manager | $120,000 – $180,000 | $150,000 |
These roles are essential for ensuring long-term ROI on enterprise tech investments. As more businesses move toward integrated, cloud-based ERP platforms, demand for this talent is expected to rise steadily.
Salary Trends Comparison: Cybersecurity vs. General Software Engineering (2026)
| Category | Average Base Salary | Premium vs. General Software Roles |
|---|---|---|
| Cybersecurity (All Levels) | $191,665 | 25% – 35% higher |
| ERP Developers | $143,500 | 10% – 20% higher |
| Software Engineers (General) | $138,000 | Baseline |
The salary gap between cybersecurity experts and general software engineers reflects the growing business need for protection, compliance, and secure infrastructure. Professionals who can combine technical expertise with security understanding are positioned for long-term career growth and above-market compensation.
Conclusion: Cybersecurity and Infrastructure Roles Take Center Stage in 2026
In the global software and SaaS sector, security is now viewed as a competitive advantage. As businesses face an expanding digital threat landscape, cybersecurity professionals—especially those in leadership and architect roles—are receiving record-high compensation. Infrastructure specialists, such as ERP developers, are also gaining attention for their ability to protect and optimize core business operations.
Organizations that invest in skilled security and infrastructure talent are not only reducing risk—they’re also building trust, enabling innovation, and ensuring operational resilience. For job seekers, upskilling in areas like cloud security, DevSecOps, and ERP systems can unlock high-paying, in-demand career opportunities in 2026 and beyond.
4. Global Perspective: International Salary Rankings and Trends
a. Comparative Country Analysis for Software Engineering
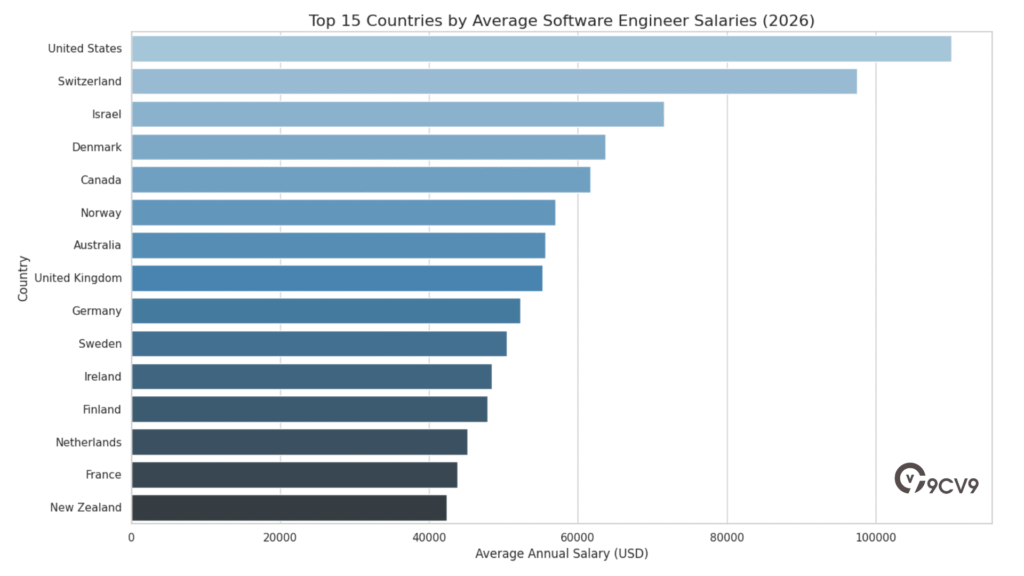
In today’s global hiring environment, salary levels vary greatly between countries. While the United States continues to lead in terms of overall compensation, other countries—such as Switzerland, Israel, and Denmark—have emerged as strong regional players with high-paying opportunities for experienced tech professionals.
Countries with advanced tech infrastructure and strong innovation ecosystems tend to offer higher salaries, particularly for senior roles. However, developing regions are quickly catching up, especially in areas with booming outsourcing and startup activity.
2026 Global Software Engineer Salary Comparison by Country
The following table presents a detailed breakdown of the top 15 global tech markets based on average annual salaries for software engineers. It includes insights into compensation at both junior and senior levels, along with the latest year-over-year salary growth trends.
Top 15 Countries by Software Engineer Salaries – 2026
| Rank | Country | Average Annual Salary (USD) | Junior-Level Salary (USD) | Senior-Level Salary (USD) | YoY Salary Growth (%) |
|---|---|---|---|---|---|
| 1 | United States | $110,140 | $69,354 | $104,188 | +8.2% |
| 2 | Switzerland | $97,518 | $89,643 | $127,693 | +5.4% |
| 3 | Israel | $71,559 | $69,851 | $114,751 | +6.8% |
| 4 | Denmark | $63,680 | $65,774 | $89,273 | +6.8% |
| 5 | Canada | $61,680 | $51,183 | $73,184 | +9.1% |
| 6 | Norway | $57,013 | $45,000 | $70,000 | +5.2% |
| 7 | Australia | $55,640 | $45,000 | $68,000 | +6.4% |
| 8 | United Kingdom | $55,275 | $38,664 | $77,603 | +4.8% |
| 9 | Germany | $52,275 | $51,188 | $78,194 | +7.2% |
| 10 | Sweden | $50,437 | $38,000 | $62,000 | +4.2% |
| 11 | Ireland | $48,427 | $35,000 | $58,000 | +5.6% |
| 12 | Finland | $47,850 | $35,000 | $58,000 | +4.2% |
| 13 | Netherlands | $45,180 | $35,000 | $55,000 | +4.8% |
| 14 | France | $43,849 | $36,523 | $59,024 | +4.5% |
| 15 | New Zealand | $42,399 | $32,000 | $52,000 | +5.8% |
Key Insights:
- The United States offers the highest average compensation overall, with strong growth in both junior and senior salary segments.
- Switzerland ranks second, driven by a highly developed economy and a large concentration of fintech and life sciences firms.
- Israel shows strong growth and high senior-level pay, thanks to its thriving startup ecosystem and defense-sector innovation.
- Scandinavian countries such as Denmark and Norway maintain competitive salary levels along with strong work-life balance incentives.
- Emerging English-speaking markets such as Canada, Australia, and the UK remain attractive due to their talent infrastructure and global accessibility.
Regional Observations and APAC Salary Gap
Despite notable global improvements, a considerable salary gap still exists between Western countries and many APAC (Asia-Pacific) economies. While countries such as India, the Philippines, and Vietnam are not listed in the top 15 based on average compensation, they remain critical hubs for outsourced software development and offer fast-growing career opportunities, especially for remote-first roles.
Western firms continue to invest heavily in these regions, offering localized salaries that are well above the regional average, though still significantly lower than those in the U.S. or Europe. This model benefits companies with budget constraints while also giving developers in these regions exposure to global tech environments.
Conclusion: Navigating the Global Software Salary Landscape in 2026
The 2026 global software and SaaS salary map reflects both opportunity and disparity. As companies scale internationally, understanding salary benchmarks in different markets becomes essential—not only for budgeting and HR planning but also for fairness, talent retention, and employer branding.
For tech professionals, this data reveals where the highest-paying markets are and highlights the importance of choosing the right geography, industry segment, and level of expertise. For employers, leveraging global salary intelligence enables smarter hiring strategies and helps navigate the challenges of distributed workforce management.
b. European Market Nuances and Funding Stages
According to 2026 data, the median salary growth across Europe’s software engineering workforce is holding steady at around 5.0%. This is the second year in a row with relatively consistent growth, signaling market stabilization after the steep increases seen between 2021 and 2024.
However, the year-over-year growth rate has not been equal across all markets. The United Kingdom, for instance, saw a significant drop in growth momentum after previously recording a peak increase of 8.5%. Meanwhile, markets like Sweden and Germany continue to display moderate but healthy growth supported by strong demand and increased investment in digital transformation.
2026 Mid-Level Software Engineer Salary Benchmark – Top European Markets
| Country | Average Salary (Mid-Level, P3) | Salary in Local Currency | Year-over-Year Growth (%) |
|---|---|---|---|
| United Kingdom | £70,000 | £70,000 | +1.6% |
| Germany | £64,500 | €74,100 | +4.5% |
| Netherlands | £63,700 | €73,200 | +1.6% |
| Sweden | £59,700 | €68,600 | +5.5% |
| France | £57,100 | €65,600 | +1.2% |
| Spain | £48,600 | €55,900 | +1.0% |
This data shows the influence of local economic conditions, talent supply, and digital industry maturity on salary levels. Germany and Sweden are among the few showing robust growth, while markets like the UK, France, and Spain reflect either slower expansion or plateauing wages.
Impact of Funding Stages on Software & SaaS Compensation
One of the most important salary trends in Europe for 2026 is the clear link between a company’s funding stage and its salary offers. As tech firms progress through financing rounds—from seed stage to Series C+ or public offerings—they tend to increase their compensation offers, especially for more experienced professionals.
Startups in later funding stages often have larger salary budgets, more structured HR systems, and aggressive talent acquisition strategies. This is particularly noticeable for mid- and senior-level roles, where the talent is expected to contribute to scalability, innovation, and operational resilience.
2026 Salary Premiums by Funding Stage – European SaaS Firms
| Role Level | Early-Stage Startups (Seed to Series B) | Late-Stage Startups (Series C+ to IPO) | Compensation Difference (%) |
|---|---|---|---|
| Mid-Level Engineer | £60,000 – £63,000 | £69,000 – £73,000 | +15% |
| Senior Engineer | £75,000 – £85,000 | £95,000 – £110,000 | +29% to +31% |
| Engineering Manager | £85,000 – £100,000 | £115,000 – £135,000 | +30% |
The numbers reflect how funding maturity often brings larger compensation budgets, more long-term equity incentives, and higher salary ceilings. This pattern is consistent across tech hubs in London, Berlin, Amsterdam, and Stockholm.
Conclusion: Navigating European Salary Structures in 2026
The European software and SaaS talent market in 2026 is characterized by:
- Stable overall growth across major regions
- Regional variations in year-over-year increases
- A strong link between salary levels and the company’s funding lifecycle
For software engineers and SaaS professionals, understanding these market signals can lead to more informed decisions regarding job offers, salary negotiations, and long-term career planning. For employers, aligning compensation strategies with funding stages and regional benchmarks is crucial for attracting top-tier talent while maintaining fiscal discipline.
5. Asia-Pacific and the Middle East: Emerging Hubs of Innovation
a. Singapore: The “Skills-First” Talent Nexus
Both APAC and Middle Eastern regions are gaining attention for their impressive growth in digital services. With a forecasted compound annual growth rate (CAGR) of 22% in the APAC SaaS sector, countries such as Singapore, India, Vietnam, and Indonesia are now key players in the global talent pool. Likewise, the Middle East is in the midst of what experts call an “exponential growth phase,” backed by massive government-led initiatives in digital infrastructure.
Key Regional Highlights for 2026
| Region | Notable Developments | Industry Growth Trends |
|---|---|---|
| Asia-Pacific (APAC) | Fastest-growing SaaS market with strong digital expansion | 22% CAGR forecast over 10 years |
| Middle East | Rapid transformation via tech investment in UAE, KSA | Strong hiring in cloud, fintech |
| Singapore | Talent sustainability, AI & cybersecurity specialization | 4%–4.3% avg salary growth |
Singapore: A Central Innovation and Skills-First Hub
Singapore continues to stand out in 2026 as a highly developed tech hub with a focus on upskilling and internal talent mobility. While overall salary growth is stabilizing at around 4% to 4.3%, high-demand technical roles in areas such as artificial intelligence, data science, and cybersecurity are experiencing much stronger growth, often reaching between 8% to 12% annually.
Singapore’s labor market strategy emphasizes internal development, with companies increasingly investing in training programs to retain talent and adapt to rapid technological changes. In addition, contract-based hiring is now a core component of workforce strategy, with 55% of Singaporean tech firms indicating they plan to increase contractor usage for flexible project needs in 2026.
2026 Entry-Level Tech Salary Benchmarks in Singapore
| Role Title | Monthly Salary Range (SGD) | Annual Salary Range (SGD) |
|---|---|---|
| AI Engineer / Specialist | S$5,000 – S$7,000 | S$60,000 – S$84,000 |
| Data Scientist | S$5,200 – S$6,500 | S$62,400 – S$78,000 |
| UI/UX Designer | S$4,200 – S$5,800 | S$50,400 – S$69,600 |
| Data Analyst | S$3,900 – S$5,300 | S$46,800 – S$63,600 |
| Cybersecurity Analyst | S$3,000 – S$6,000 | S$36,000 – S$72,000 |
These figures show that entry-level positions in tech within Singapore continue to outpace many non-technical career paths in terms of both compensation and long-term career potential. Roles tied to data, AI, and cybersecurity are among the most lucrative starting points for new graduates.
Contract Hiring and Workforce Agility in Singapore
Contract hiring is becoming increasingly common as companies prioritize flexibility, cost-efficiency, and access to specialized skills for short-term projects. Singapore’s labor policies and employer mindset support this trend, positioning the country as a leader in agile workforce adoption.
2026 Contracting Trend Overview – Singapore
| Workforce Strategy | Key Insights |
|---|---|
| Contractor Utilization | 55% of companies plan to expand contract hiring |
| Talent Development | Focus on internal mobility and retraining programs |
| High-Demand Projects | AI, cybersecurity, product design, and cloud ops |
This shift allows firms to scale quickly, maintain lean full-time headcounts, and bring in specific skill sets without the long-term obligations tied to permanent roles.
Conclusion: APAC and the Middle East Power Global Tech Salary Evolution
The global software and SaaS salary landscape is changing rapidly, and the rise of APAC and the Middle East is playing a central role in that shift. These regions are no longer simply cost-effective alternatives; they are innovation hubs that offer increasingly competitive compensation, dynamic career paths, and robust industry growth.
For job seekers, these markets present exciting new career opportunities—especially for those skilled in AI, data analytics, and cybersecurity. For employers, they offer access to expanding talent pools and strategic advantages in workforce cost management, scalability, and regional reach.
b. Vietnam and the GCC: Rapid Transformation
Vietnam is entering a new phase of tech-driven growth. Salaries in the country’s software and SaaS sectors are rising significantly, especially for roles tied to artificial intelligence, data analytics, and fintech product development. AI specialists and digital leaders are now among the most in-demand professionals, often seeing pay increases between 15% and 25%. Meanwhile, more general software development roles are growing at a steadier pace, with typical salary increases ranging from 5% to 15%.
The shift reflects the country’s growing digital ambitions and the desire to compete with larger regional tech hubs like Singapore and India.
2026 Salary Matrix – Vietnam (Tech & Leadership Roles)
| Role Level / Title | Monthly Salary Range | Currency |
|---|---|---|
| Manager (Finance / IT Functions) | 35,000,000 – 70,000,000 | VND |
| CEO / CFO / COO (Technology) | 150,000,000 – 350,000,000 | VND |
In particular, Vietnamese companies are competing aggressively to retain experienced tech managers and C-level executives who can lead transformation efforts, scale digital platforms, and implement emerging AI strategies. This push for leadership talent is intensifying the local salary race and shifting the expectations of both domestic professionals and returning overseas Vietnamese talent.
The GCC Region: Digital Leadership and Strategic Nationalization Drive Salaries Higher
In the Gulf region, especially in countries like the United Arab Emirates (UAE), the tech sector is expanding as part of larger national agendas to build knowledge-based economies. In 2026, GDP growth in the GCC is forecasted at 4.6%, driven largely by innovation, foreign investment, and large-scale digital infrastructure projects.
Tech salaries in the GCC are surging, particularly in leadership and consulting roles that focus on cloud computing, cybersecurity, data platforms, and investment technologies. These roles often involve managing international teams, aligning digital functions with regulatory frameworks, and leading high-value strategic programs.
2026 Salary Matrix – UAE (Executive Tech & Finance Roles)
| Role / Position | Monthly Salary Range | Currency |
|---|---|---|
| Managing Director (Consulting Sector) | 70,000 – 200,000 | AED |
| CFO (Investments / Funds) | 85,000 – 200,000 | AED |
These compensation levels reflect the region’s emphasis on high-impact leadership and its attractiveness to global executives seeking tax-efficient, high-reward roles in one of the world’s fastest-growing economies.
Nationalization Strategies Reshape the Talent Landscape in the UAE
An important trend in 2026 is the UAE’s continued push for nationalization in the private sector—particularly within skilled technology roles. Known as “Emiratisation,” this initiative requires companies to ensure that a minimum of 10% of their skilled roles are filled by UAE nationals. While this creates new opportunities for local professionals, it also increases competition for top-tier roles, especially in organizations balancing local policy compliance with international standards of execution and innovation.
Key Talent Trends in Vietnam and the GCC (2026 Overview)
| Market | Key Drivers of Salary Growth | Most In-Demand Roles |
|---|---|---|
| Vietnam | Rise in AI, Fintech, and SaaS investment | AI Specialists, Digital Managers, CTOs |
| UAE (GCC) | Digital economy transition, Emiratisation mandates | CIOs, Managing Directors, Investment CFOs |
Both regions are investing heavily in long-term technology infrastructure and digital upskilling initiatives, indicating that the upward trend in salaries is likely to continue well beyond 2026.
Conclusion: Emerging Markets Take the Lead in Competitive Tech Compensation
Vietnam and the GCC are no longer simply low-cost alternatives in the global tech hiring ecosystem. They have now become fast-moving, high-reward regions offering competitive salaries for leadership, strategic technology, and innovation-focused roles. As these economies continue to evolve, tech professionals with expertise in AI, digital finance, and cross-border management will find these markets increasingly attractive.
6. SaaS Sales and Customer Success: The Revenue Engine
a. Sales Roles and OTE Benchmarks
In 2026, SaaS companies worldwide continue to rely heavily on sales and customer success teams to drive predictable recurring revenue. These teams are not only responsible for closing new deals, but also for expanding existing accounts, protecting renewals, and ensuring long-term customer retention.
However, compensation models for SaaS sales are changing quickly. As AI sales tools and automated workflows become more advanced, many organisations are redesigning their go-to-market strategy. This shift is especially impacting traditional quota-carrying Account Executive (AE) roles, where transactional sales activities are increasingly supported or replaced by AI agents.
This section explains how SaaS sales compensation works in 2026, what the most common salary and OTE benchmarks look like, and why hiring delays in revenue roles can create major financial losses.
Why SaaS Sales Compensation Is Being Reshaped in 2026
The SaaS sales industry in 2026 is moving into a more efficient and performance-driven era. Many companies are pushing for lower customer acquisition costs and tighter sales productivity, especially as:
AI agents can automate outbound outreach and follow-ups
CRM systems have smarter pipeline scoring
Prospecting tools generate leads faster with less manual effort
Revenue teams are expected to deliver more with leaner headcount
This has created pressure on traditional AE models, particularly in segments where deal sizes are smaller and sales cycles are more repeatable.
Traditional vs AI-Native SaaS Sales Structures (2026 Comparison)
A growing number of SaaS organisations are comparing older sales structures to newer AI-enabled models. In many cases, companies can achieve similar ARR outcomes while lowering go-to-market costs by using AI-native workflows.
SaaS GTM Cost Efficiency Matrix (2026)
Traditional Sales Structure
• Large SDR team for outbound prospecting
• Manual qualification processes
• More headcount required for coverage
• Higher payroll and commission expenses
• Repetitive deal motions handled by humans
AI-Native Sales Structure
• Leaner SDR and AE teams
• AI-assisted prospecting and lead scoring
• Automated follow-up and scheduling
• Lower GTM operating costs
• Human reps focus more on strategy and closing
Estimated Outcome in 2026
• Up to 35% reduction in go-to-market cost for the same ARR output
• Higher demand for top-performing sales professionals
• More pressure to justify every sales hire with measurable revenue impact
This evolution does not eliminate sales jobs. Instead, it raises expectations and shifts sales work toward more complex, higher-value conversations.
How SaaS Sales OTE Works in 2026 (Base Salary + Commission)
In 2026, SaaS sales compensation remains closely tied to performance. Most companies still design pay using a mix of fixed salary and variable commission, commonly referred to as OTE (On-Target Earnings).
The standard structure typically looks like this:
Account Executives (AEs)
AEs usually earn a balanced split of base salary and commission, often 50:50. This model rewards quota achievement and deal closures.
Sales Development Representatives (SDRs / BDRs)
SDRs and BDRs usually have a stronger base salary component because they focus on pipeline generation rather than closing. A common model is 70:30 (base to variable).
SaaS Sales Compensation Ratio Benchmark Table (2026)
Role Type Common Pay Structure Why It Is Used
SDR / BDR 70% Base + 30% Variable Rewards pipeline activity and meeting output
Mid-Market AE 50% Base + 50% Variable Balanced incentives for closing mid-value deals
Enterprise AE 50% Base + 50% Variable Supports large quota targets and long sales cycles
Sales Leadership (Manager and above) Base + Variable tied to team results Encourages forecasting accuracy and team performance
This compensation structure makes SaaS sales roles highly attractive, but it also means performance and consistency strongly influence annual earnings.
SaaS Sales Salary and OTE Benchmarks in 2026
SaaS companies continue to offer competitive compensation packages to attract revenue talent. OTE levels rise quickly as sales professionals move into higher deal sizes and more complex sales cycles.
SaaS Sales Compensation Benchmarks (2026)
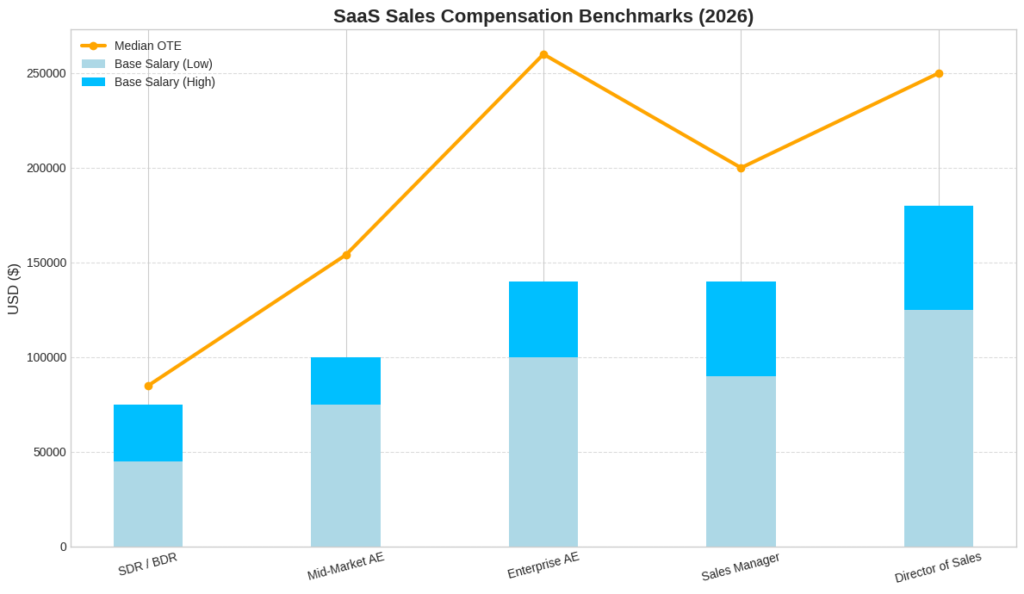
Role / Title Experience Level Base Salary Range (USD) Median OTE (USD)
SDR / BDR 0–2 Years $45,000 – $75,000 $85,000
Mid-Market Account Executive 2–5 Years $75,000 – $100,000 $154,000
Enterprise Account Executive 5–12 Years $100,000 – $140,000 $260,000
Sales Manager 8+ Years $90,000 – $140,000 $200,000
Director of Sales 10+ Years $125,000 – $180,000 $250,000
These benchmarks are based on common SaaS compensation patterns in mature markets, especially the United States, where revenue roles are highly structured and performance-driven.
Why “Cost-of-Vacancy” Matters More Than Ever in 2026
One of the most expensive hiring mistakes in SaaS is leaving revenue roles unfilled for too long. In sales, an empty seat is not just a hiring gap. It creates a measurable revenue loss.
This is known as the Cost-of-Vacancy.
For example, leaving an Account Executive role unfilled for 60 days can create more than $200,000 in missed revenue opportunity, based on:
Average annual quota: $1.2 million per AE
Lost pipeline creation and delayed deal cycles
Lower customer coverage and reduced follow-ups
Competitors closing opportunities faster in the same accounts
Cost-of-Vacancy Impact Table (AE Hiring Example)
Vacancy Situation Business Result
AE role unfilled for 60 days $200,000+ missed revenue opportunity
Average annual AE quota $1.2 million
Main reason it happens Pipeline stalls and deals slow down
Long-term risk Lower ARR growth and forecasting gaps
This is why fast hiring processes, clear compensation plans, and strong onboarding systems are now essential for SaaS revenue teams.
Customer Success as a Revenue Partner in 2026
While sales brings in new revenue, customer success protects and expands recurring revenue after the deal is closed. In 2026, many SaaS companies are tying customer success incentives more directly to revenue outcomes, including:
Renewal performance
Upsell and cross-sell contribution
Net revenue retention targets
Churn control metrics
This shift means customer success is no longer seen as a support function. It is increasingly treated as a revenue engine alongside sales.
Customer Success vs Sales Value Matrix (2026)
Function Area Primary Goal Revenue Impact
SaaS Sales Acquire new customers Drives new ARR growth
Customer Success Retain existing customers Protects ARR base
Customer Success (Commercial) Expand accounts through upgrades Increases ARR per customer
Key Takeaways for SaaS Revenue Compensation in 2026
For employers
• Sales compensation must reflect changing AI-enabled productivity
• Hiring delays for AEs create real financial losses
• OTE plans must remain achievable and competitive to retain talent
For candidates
• Understanding OTE structure is critical when comparing offers
• Enterprise and complex sales roles still offer the strongest earning upside
• AI-enabled selling skills can improve performance and long-term career growth
SaaS Sales Compensation Structure by Role Type (2026)
This table outlines how different sales roles are structured in terms of base and variable pay, explaining why each ratio is applied.
| Role Type | Pay Structure (Base : Variable) | Reason for Structure |
|---|---|---|
| SDR / BDR | 70% : 30% | Focused on prospecting and lead generation |
| Mid-Market Account Executive | 50% : 50% | Balanced incentive for both base salary and performance bonuses |
| Enterprise Account Executive | 50% : 50% | Reflects larger quotas and longer sales cycles |
| Sales Manager & Leadership | Variable tied to team results | Encourages team performance and accurate forecasting |
SaaS Sales Compensation Benchmarks (2026)
Below is a breakdown of typical salary and OTE benchmarks across major sales roles in SaaS companies, based on U.S. market data.
| Role / Title | Experience Level | Base Salary Range (USD) | Median On-Target Earnings (OTE) |
|---|---|---|---|
| SDR / BDR | 0–2 Years | $45,000 – $75,000 | $85,000 |
| Mid-Market Account Executive | 2–5 Years | $75,000 – $100,000 | $154,000 |
| Enterprise Account Executive | 5–12 Years | $100,000 – $140,000 | $260,000 |
| Sales Manager | 8+ Years | $90,000 – $140,000 | $200,000 |
| Director of Sales | 10+ Years | $125,000 – $180,000 | $250,000 |
Traditional vs AI-Native SaaS Sales Models (2026)
A comparison between conventional sales structures and modern, AI-enabled sales workflows, highlighting the efficiency advantages of AI adoption.
| Category | Traditional Sales Structure | AI-Native Sales Structure |
|---|---|---|
| Team Composition | Larger SDR and AE teams | Leaner, AI-supported sales teams |
| Prospecting Process | Manual outreach and lead scoring | Automated prospecting with AI tools |
| Deal Motion | Repetitive tasks handled by humans | AI handles repetitive tasks, humans focus on strategic sales |
| Payroll & Operating Cost | Higher due to larger team size and manual workload | Lower cost with reduced headcount and AI productivity |
| Estimated GTM Cost Reduction | — | Up to 35% cost reduction for similar ARR output |
Impact of AE Vacancy on Revenue Generation (2026)
Illustrates how leaving an Account Executive role unfilled can directly affect revenue growth due to lost opportunity.
| Scenario | Estimated Business Impact |
|---|---|
| AE role unfilled for 60 days | $200,000+ in lost revenue opportunity |
| AE annual revenue quota | $1.2 million |
| Main consequence | Deal delays, lost follow-ups, slower pipeline |
| Long-term risk | Reduced ARR and missed growth targets |
Customer Success vs Sales: Revenue Impact Comparison (2026)
Highlights how both sales and customer success functions contribute to SaaS revenue performance in different ways.
| Function Area | Primary Goal | Revenue Contribution |
|---|---|---|
| SaaS Sales | Acquire new customers | Drives new annual recurring revenue (ARR) |
| Customer Success | Retain and support customers | Protects and stabilizes existing ARR |
| CS with Commercial Focus | Upsell and expand usage | Increases net revenue per customer |
b. Customer Success: Stabilization and Growth
In the 2026 global software and SaaS landscape, Customer Success (CS) is no longer just a supportive function—it is now one of the most strategic areas for driving profitability and long-term customer value. As the industry matures, companies are shifting their priorities from aggressive new sales acquisition toward customer retention, usage expansion, and upselling. This transition has positioned customer success professionals as key revenue influencers in both startup and enterprise SaaS environments.
Organizations are now investing heavily in CS teams to strengthen customer relationships, improve product adoption, and reduce churn. These professionals are responsible for managing client health, building loyalty, and identifying growth opportunities within existing accounts—all of which directly impact recurring revenue and overall company valuation.
Global Trends in Customer Success Compensation
Customer success compensation structures are evolving to reflect the growing importance of the role. In 2026, salaries in CS are increasingly determined by the size of customer accounts managed, the complexity of the service model, and the scope of responsibilities (e.g., whether the CS professional also handles expansion or upselling).
Variable pay, especially at the Customer Success Manager (CSM) level, is increasingly tied to team retention rates, both gross and net. Over 50% of CSMs now report these metrics as their primary performance indicators (KPIs)—replacing older metrics like ticket resolution or CSAT scores.
2026 Global Customer Success Salary Matrix
| Role / Title | Median Base Salary (USD) | Highest Base Salary Reported (USD) | Notes on Pay Determinants |
|---|---|---|---|
| Customer Success Manager (CSM) | $78,247 | $117,000 | Varies by contract size and customer portfolio depth |
| Client Success Manager (US) | $91,915 | $250,000 (Strategic/Enterprise) | Highest pay in global or high-value accounts |
| Director of Customer Success | $121,435 | $180,000+ | Typically manages multi-region or departmental teams |
| Product Success Manager | $159,405 | $230,000+ | Focused on enterprise SaaS products and integrations |
These numbers reflect median and top-tier base salaries. Total compensation may include variable bonuses, equity (particularly in Series B+ and public SaaS firms), and performance-based rewards linked to account growth or churn reduction.
KPI Alignment and Variable Pay Structure in 2026
In today’s performance-driven CS environment, compensation is tightly linked to measurable customer outcomes. The following matrix highlights how compensation is now designed around specific customer success goals.
Customer Success Compensation KPI Matrix (2026)
| Compensation Component | Key Metric Used | Common Weight (%) in Total Pay |
|---|---|---|
| Base Salary | Role level and client complexity | 60% – 80% |
| Bonus / Variable | Gross / Net Retention Rate | 10% – 25% |
| Commission or Incentives | Upsell / Cross-sell revenue contribution | 10% – 20% |
| Equity (for senior roles) | Long-term value and growth alignment | Depends on company stage |
Professionals managing large enterprise accounts typically receive higher base salaries and are also offered bonuses tied to expansion revenue and contract renewals. By contrast, mid-market and SMB-focused CSMs tend to earn bonuses based on retention rates and usage adoption scores.
Key Performance Areas for Customer Success Roles in 2026
| Focus Area | Description | Impact on Compensation |
|---|---|---|
| Net Revenue Retention | Measured by renewals and expansions minus churn | High impact on variable pay |
| Customer Health Scoring | Tracks usage, NPS, support tickets, and satisfaction | Supports bonus eligibility |
| Adoption & Activation | Measures onboarding success and usage consistency | Tied to product success bonuses |
| Strategic Account Growth | Involves co-selling, upselling, or aligning with account plans | Triggers commission tiers |
Conclusion: Customer Success as a Growth and Retention Engine in 2026
Customer Success roles in 2026 are essential to the long-term health of SaaS businesses. As more companies rely on recurring revenue models, retaining and expanding existing customers has become more valuable than new customer acquisition alone. Salaries for CS professionals continue to rise, especially for those with experience in enterprise account management, product usage analysis, and revenue growth responsibilities.
For employers, investing in well-compensated and strategically aligned CS teams is now a proven method for improving customer lifetime value and reducing churn. For professionals, building skills in relationship management, renewal strategy, and data-driven customer analytics opens a clear path to both career growth and high earning potential.
7. Cross-Functional Analysis: Technology Across Industries
a. Salary Comparisons by Industrial Sector (US)
In 2026, technology has become deeply embedded across all industries. It is no longer confined to the software sector but has become a critical enabler of growth, innovation, and efficiency in sectors such as finance, healthcare, manufacturing, and professional services.
As industries transform digitally, the demand for highly skilled technical professionals has surged. Companies are investing in modernizing their systems, protecting sensitive data, automating operations, and unlocking insights from their data. This shift has led to significant differences in how much various sectors are willing to pay for technical talent.
Technology Roles Across Industries: A Strategic Investment
Industries are no longer just hiring engineers—they are hiring digital strategists who can enable automation, build secure digital platforms, and manage complex infrastructure. In 2026, compensation for tech professionals varies widely based on the industry they work in and the specific technical expertise they bring.
The following factors influence salary differences:
- Urgency of digital transformation
- Regulatory or data compliance demands
- Size of digital budgets and infrastructure scale
- Degree of customer-facing digital experience required
2026 Median Technology Salary Premiums by Industry (U.S. Market Overview)
| Industry Sector | Core Technical Focus Areas | Median Tech Salary Premium (vs. baseline) | Sector Description and Salary Driver |
|---|---|---|---|
| Financial Services | Cybersecurity, AI for Fintech, Data Governance | +15% to +20% | High compliance pressure and major cloud modernization initiatives |
| Healthcare | Cloud Security, Patient Data Privacy, Interoperability | +10% to +12% | Emphasis on securing health records, IoT in diagnostics, and AI in analytics |
| Manufacturing | Robotics, IoT, Automation Systems | +8% to +10% | Adoption of smart factory technologies, sensor-driven logistics |
| Professional Services | ERP Systems, Business Intelligence, Data Warehousing | +5% to +8% | Focus on internal optimization, SaaS-based practice management |
These salary premiums reflect the value placed on digital innovation within each industry. Sectors with high risk exposure, customer sensitivity, and operational complexity are consistently paying more to attract qualified tech professionals.
Industry Focus Matrix: Where Tech Professionals Are Most Valued in 2026
| Sector | Digital Transformation Stage | Talent Demand Intensity | Key Hiring Roles |
|---|---|---|---|
| Financial Services | Advanced (AI-native, Cloud-led) | Very High | Security Engineers, AI Developers, DevOps Specialists |
| Healthcare | Expanding (Regulatory + Cloud Push) | High | Cloud Security Experts, Data Privacy Architects |
| Manufacturing | Scaling (IoT + Robotics Integration) | Moderate to High | Industrial Automation Engineers, AI for Predictive Ops |
| Professional Services | Optimizing (ERP, Analytics-focused) | Moderate | Data Analysts, ERP Developers, Cloud Consultants |
The intensity of hiring reflects both the level of digital maturity and the strategic role of technology within each sector.
Why Tech Salaries Are Rising Faster Outside of Traditional Tech Firms
In 2026, non-tech industries are becoming the most aggressive in hiring software and cloud engineers, sometimes offering compensation packages that rival or even surpass those at traditional tech companies. This is because:
- These industries are catching up on years of underinvestment in IT infrastructure.
- They now recognize the financial and competitive risks of digital gaps.
- They need in-house expertise to avoid dependence on external vendors.
Many of these companies are now positioning themselves as “tech-first” within their verticals, offering career paths, R&D opportunities, and compensation comparable to Silicon Valley firms.
Conclusion: Cross-Industry Demand Reshaping Tech Salaries Globally
In this new landscape, the most sought-after software and SaaS professionals are those who can apply their skills within a specific industry context—whether that’s designing secure fintech applications, automating smart factories, or building patient-friendly digital health portals.
The cross-functional integration of technology across finance, healthcare, manufacturing, and services is not only raising salaries—it’s also redefining what it means to be a “tech role.” For professionals, this opens new career pathways in high-paying, non-traditional tech sectors. For employers, attracting top talent now requires more than a strong salary—it demands a compelling mission, modern tech stacks, and a clear commitment to digital innovation.
8. Workforce Strategy: Benefits, Flexibility, and Calculation
a Total Compensation Strategies in 2026
In 2026, the global software and SaaS industry is facing an increasingly candidate-driven job market. With talent shortages persisting across technical roles and retention concerns on the rise, companies are rethinking how they attract, retain, and reward their employees. A major transformation is underway: compensation is no longer defined solely by salary. Instead, it now includes a broader range of financial, personal, and wellness-related benefits, all bundled into what is known as the “Total Rewards” package.
This shift reflects a growing recognition that today’s tech professionals are not only evaluating job offers based on pay but also on flexibility, purpose, career development, and health-related support.
The Growing Importance of Total Rewards in 2026
Employers are being challenged to go beyond traditional compensation models. In 2026, 84% of organizations globally express concern over talent retention. To respond, more than half of hiring managers are actively enhancing their offerings by integrating new benefits that address employee well-being, performance motivation, and lifestyle balance.
Key Factors Driving Compensation Redesign:
- Increased competition for high-skill talent across tech and non-tech industries
- Generational shifts in workforce expectations, especially among Millennials and Gen Z
- The normalization of hybrid and remote work models
- Growing awareness of mental health and work-life integration
2026 Adoption Rates and Workforce Preferences – Total Rewards Matrix
| Benefit Category | Employer Adoption Rate (%) | Candidate Preference Insights |
|---|---|---|
| Remote / Hybrid Flexibility | 88% | Top priority for 70% of candidates; essential for work-life fit |
| Performance Bonuses (KPI-Based) | 65% | 53% of professionals would switch jobs for stronger bonuses |
| Mental Health & Wellness Programs | 42% | Increasingly valued across all experience levels |
| Equity / Stock Options | 35% | High priority for younger talent seeking long-term value |
This data reveals that while remote work has become a baseline expectation, equity plans and wellness support are now core components in job selection decisions—especially among emerging talent segments.
What Makes Up Total Compensation in 2026
Today’s software and SaaS professionals are evaluating offers based on “total compensation,” which includes a blend of guaranteed pay, incentives, and non-monetary benefits. Employers must now present a more holistic view of compensation when recruiting top-tier talent.
Components of a Competitive Total Rewards Package – 2026 Structure
| Compensation Component | Description and Role in Retention |
|---|---|
| Base Salary | Fixed annual or monthly salary |
| Performance Bonuses | KPI or revenue-driven bonuses tied to role outcomes |
| Equity / Stock Options | Long-term incentives aligned with company growth |
| Remote / Hybrid Work Flexibility | Work model flexibility (location, schedule) |
| Health and Wellness Benefits | Includes mental health support and medical coverage |
| Paid Leave and Sabbaticals | Generous PTO, parental leave, and recharge programs |
| Learning and Development Programs | Training budgets, certifications, career mobility |
Each of these elements plays a role in shaping an employee’s perception of value. For instance, a mid-level software engineer might accept a lower base salary if it includes a high-growth equity package, flexible hours, and access to premium wellness support.
How Companies Are Reshaping Workforce Strategy in 2026
Top-performing organizations in the software and SaaS space have shifted from compensation-only attraction models to experience-based retention strategies. These strategies emphasize:
- Internal mobility and cross-functional learning
- Mental health normalization and access
- Transparent promotion paths and merit-based bonuses
- Inclusive remote-first or hybrid work environments
Talent Retention Priorities Matrix – Strategic Shifts in 2026
| Strategic Focus Area | Importance to Candidates | Common Company Response |
|---|---|---|
| Flexibility and Autonomy | Very High | Offering fully remote or hybrid-first policies |
| Recognition and Growth | High | Implementing structured feedback and promotion |
| Wellness and Work-Life Balance | Medium to High | Partnering with wellness platforms and therapists |
| Equity and Long-Term Wealth Building | High (especially Gen Z) | Refreshing RSU programs and transparent vesting |
Conclusion: Total Compensation Defines Employer Competitiveness in 2026
In the software and SaaS hiring landscape of 2026, organizations that only focus on salary are losing ground. Candidates now expect a balanced, flexible, and values-driven compensation package—and companies are being measured on how well they deliver it.
Employers that invest in structured, human-centric workforce strategies not only secure better talent but also reduce attrition and boost long-term engagement. For candidates, understanding total rewards can help assess the true value of an offer beyond base pay.
b. Technical Calculation for Market Benchmarking
In today’s global software and SaaS economy, precise compensation benchmarking has become an essential part of workforce strategy. As companies increasingly rely on flexible staffing models—including contractors, consultants, and freelance engineers—they must translate full-time salaries into competitive hourly or daily rates. This ensures pay fairness across employment types and helps maintain market alignment when hiring across borders or through third-party platforms.
Recruitment agencies, HR professionals, and workforce planning teams are now using consistent mathematical formulas to derive hourly compensation rates from annual salary figures. These formulas help organizations evaluate whether they’re offering market-aligned pay, especially when managing mixed workforces that include permanent staff, hourly contractors, and remote freelancers.
Why Accurate Compensation Conversion Matters in 2026
The rise of hybrid work, global outsourcing, and project-based engagements has introduced more complexity into pay models. With many companies hiring across time zones and employment types, it’s critical to compare pay rates on a common scale.
Key applications of hourly or daily rate calculations include:
- Determining competitive pay for contract-based or freelance roles
- Comparing international salary packages across currencies and jurisdictions
- Planning project budgets that involve short-term technical contributors
- Ensuring compliance with local labor standards and fair pay expectations
Standard Salary Conversion Formula in 2026
In 2026, the widely accepted formula used by most global HR and recruitment firms to calculate an hourly rate from an annual salary is:
Hourly Rate = Annual Salary ÷ (Hours per Week × 52 Weeks)
This formula assumes that a full-time employee works consistently throughout the year, including paid time off, and it accounts for weekly hours based on local labor regulations.
Salary Conversion Matrix Example – Australia (2026 Standard)
Australia uses a 38-hour workweek as the standard for full-time employment. Using this benchmark, the following example demonstrates how to convert an annual salary into an hourly rate.
| Region | Annual Salary (AUD) | Standard Hours per Week | Conversion Formula | Hourly Rate (AUD) |
|---|---|---|---|---|
| Australia | $135,000 | 38 hours | $135,000 ÷ (38 × 52) | $68.32 |
This method ensures consistency across recruitment practices and helps companies manage fair contractor compensation in high-demand regions such as Australia, Singapore, the United States, and the United Kingdom.
Benchmarking Scenarios for Global Contractor Markets (2026)
| Country | Annual Salary Benchmark (USD Equivalent) | Standard Weekly Hours | Derived Hourly Rate (USD) | Notes |
|---|---|---|---|---|
| Australia | $90,000 USD | 38 | $45.55 | Reflects strong engineering base salary market |
| United States | $120,000 USD | 40 | $57.69 | Used widely in contract-to-hire negotiations |
| United Kingdom | £70,000 GBP | 37.5 | £35.90 | Aligns with IT contractor rates in London |
| Singapore | S$100,000 SGD | 40 | S$48.08 | Used for tech contractors in high-demand specializations |
These examples show how base annual compensation can be accurately broken down into hourly benchmarks, enabling better decision-making for both employers and job seekers operating in flexible work environments.
Conclusion: Technical Compensation Calculations Support Global Pay Consistency
As the software and SaaS industry embraces more agile workforce models in 2026, organizations need robust tools to maintain competitive, fair, and transparent compensation. Accurate conversion of annual salaries into hourly rates has become a cornerstone of this strategy—especially as companies balance full-time, part-time, and project-based staffing across borders.
For employers, mastering these calculations ensures stronger contractor negotiations, budget planning accuracy, and compliance with evolving employment standards. For professionals, understanding how their full-time salary translates to hourly or daily rates is critical when evaluating freelance offers or negotiating project contracts.
9. Strategic Synthesis and Future Outlook
The global software and SaaS industry in 2026 is no longer defined by unchecked growth or hyper-scaling at all costs. Instead, the market has entered a phase of mature, strategy-led development—where efficiency, value creation, and talent precision guide hiring and compensation decisions. This shift toward sustainable growth is reshaping how companies structure pay, which roles are rewarded most, and what professionals need to prioritize in order to thrive in the years ahead.
Across all regions and business sizes, a more strategic approach to salary architecture is emerging—one that balances financial discipline with bold investments in critical skills that drive innovation, security, and scalable revenue models.
The Two-Speed Software Workforce in 2026
Global employment trends in the software and SaaS sectors are beginning to divide into two major talent categories—each with vastly different compensation trajectories and demand profiles.
2026 Workforce Segmentation Matrix – Software and SaaS Industry
| Workforce Category | Role Focus Area | Market Demand Trend | Salary Growth Outlook | Strategic Relevance |
|---|---|---|---|---|
| Specialists in Innovation | AI, Cybersecurity, Cloud Architecture | Very High | Strong (10%–25% YoY) | Central to growth and resilience |
| Generalist Roles | Legacy IT, Rules-Based Tasks | Declining or Stable | Flat to Negative (<2% YoY) | Increasing automation risk |
Specialists with deep technical expertise and adaptability continue to see strong upward pressure on pay, while professionals in routine, rules-based roles are facing slower wage growth due to the rapid adoption of automation and AI tools.
AI Fluency and Domain Expertise: The New Currency of Compensation
One of the most consistent patterns in the 2026 salary data is the rising premium paid to individuals who demonstrate strong AI fluency—meaning the ability to design, integrate, and manage AI systems that boost productivity or deliver competitive advantages. Whether working in engineering, cybersecurity, product, or data roles, professionals who can apply AI to solve real-world business challenges are commanding the highest salaries and most lucrative career opportunities.
Specialization Premium Matrix – 2026 Global Software Roles
| High-Value Specialization Area | Average Global Salary Premium | Notes on Strategic Impact |
|---|---|---|
| Artificial Intelligence & LLMs | +18% to +30% | Core to automation, personalization, and GTM scaling |
| Cybersecurity & Compliance | +15% to +28% | Key to enterprise risk mitigation and data integrity |
| Cloud Architecture & DevSecOps | +12% to +25% | Enables scalable infrastructure and agile delivery |
| Fintech & Blockchain | +10% to +22% | Focused on secure digital transactions and platforms |
These figures represent global trends, with some variation by region and company maturity. However, the overarching takeaway is clear: specialized talent that drives transformation receives the largest share of compensation growth.
Organizational Priorities in 2026: Balancing Cost and Capability
For employers, the challenge is to manage rising costs of top-tier talent while keeping broad labor costs under control. This often involves careful workforce planning, which includes:
- Avoiding long-term vacancies in critical roles, particularly in AI, data, and security
- Automating legacy tasks to improve productivity per employee
- Leveraging internal mobility programs to retain and reskill high-potential workers
- Focusing hiring strategies on capabilities, not just credentials
2026 Strategic Talent Management Priorities Matrix
| Strategic Hiring Focus | Outcome Sought | Impact on Compensation Framework |
|---|---|---|
| Skills-Based Hiring | Better role fit and talent performance | Reduces overpayment for underqualified roles |
| Internal Talent Mobility | Enhances retention and upskilling | Strengthens ROI on total rewards investment |
| Cost-of-Vacancy Optimization | Minimizes revenue loss from open positions | Justifies faster hiring decisions for experts |
| Total Rewards Personalization | Aligns benefits with generational values | Improves offer acceptance and engagement |
Organizations that operationalize these strategies are more likely to maintain competitiveness in a market where talent expectations are rapidly evolving.
Looking Ahead: Salary Trends Beyond 2026
As the software and SaaS industry moves toward 2030, technology is no longer a support function—it is the foundation of every major business strategy. This shift means that compensation design will continue to prioritize talent that enables transformation, drives efficiency, and protects operational resilience.
Future Outlook Summary – Global Salary Architecture
| Area of Change | Expected Impact by 2030 | Employer Strategy Needed |
|---|---|---|
| AI-Driven Roles | Dominant in salary leadership | Invest in continuous learning infrastructure |
| Contracting and Freelance Models | Growth in flexible, high-skilled workers | Build flexible comp frameworks and benchmarks |
| Total Rewards Evolution | Customization becomes standard | Personalize benefits for retention |
| Pay Transparency & Global Equity | Rising regulatory and market expectations | Implement real-time salary benchmarking tools |
Conclusion: The Software Salary Landscape in 2026 and Beyond
The global software and SaaS salary ecosystem in 2026 is now defined by precision, specialization, and strategic value. Compensation is no longer just about matching market rates—it’s about aligning pay with impact. For professionals, the clearest path to high earnings lies in mastering innovation-driven domains like AI, cybersecurity, and cloud engineering. For companies, winning the race for talent means investing in adaptable workforce strategies, removing hiring bottlenecks, and aligning total rewards with modern workforce expectations.
Conclusion
As we reach the end of this comprehensive guide to salaries in the global software and SaaS industry for 2026, one key theme becomes undeniably clear: the world of work is evolving—fast, strategically, and across every corner of the tech-driven economy. Compensation today is not just about base pay figures. It reflects a deeper alignment between emerging technologies, market shifts, global talent supply, and the growing demand for specialization in a hyper-competitive digital environment.
The software and SaaS sectors have matured into global powerhouses where talent fuels growth, innovation drives investment, and pay structures serve as both a strategic lever and a retention tool. Whether companies are based in Silicon Valley, Singapore, Berlin, Sydney, or Dubai, the new rules of compensation revolve around specialization, flexibility, and measurable value. Employers are no longer paying for roles—they are paying for impact.
Key Takeaways from the 2026 Salary Landscape
• Specialization is the New Standard
Salaries are rising fastest for professionals with deep skills in artificial intelligence, cybersecurity, cloud infrastructure, data science, and DevSecOps. These roles not only command premium pay but also offer job security, cross-border mobility, and leadership opportunities. Engineers, architects, and product strategists in these domains are now seen as revenue accelerators, not just support functions.
• Generalist Roles Are Being Reassessed
Legacy IT roles, rules-based functions, and task-heavy responsibilities are being reshaped by automation, AI agents, and low-code/no-code platforms. As a result, wage growth for these categories has slowed or plateaued in many regions. Professionals in these roles are strongly encouraged to upskill or reskill in more strategic areas to remain competitive and increase their earning potential.
• Global Pay Structures Are Becoming More Sophisticated
From hourly rate conversion matrices for contractors to equity-linked compensation for full-time employees, 2026 has brought a more structured and data-driven approach to salary design. Companies are localizing offers for regional cost-of-living considerations while maintaining global parity in equity and performance-based rewards.
• Remote Work and Total Rewards Are Here to Stay
Remote and hybrid flexibility has transitioned from a temporary pandemic response to a permanent priority for the modern workforce. In fact, 88% of global employers now offer some form of flexible work arrangement. Meanwhile, base pay is increasingly supplemented by mental health support, learning budgets, flexible time off, and tailored wellness initiatives, making total rewards programs a critical differentiator in the employer value proposition.
• Regional Differences Still Shape Salary Outcomes
While the United States, Switzerland, and Israel lead global salary rankings for software engineers, countries like Vietnam, the UAE, India, and Brazil are emerging as fast-growing hubs where salaries are climbing rapidly. Understanding local market dynamics—such as tax structures, funding maturity, and nationalization programs—is essential for companies expanding internationally and for professionals seeking global career opportunities.
• SaaS Sales, Customer Success, and Tech-Adjacent Roles Are Evolving
Beyond engineering, roles in SaaS sales, customer success, and product management are becoming more performance-based and metrics-driven. In 2026, quota-carrying roles come with both high earnings potential and increasing pressure to deliver. Meanwhile, customer success teams are now tied directly to revenue outcomes, with compensation reflecting retention, upsell, and satisfaction metrics.
• Data-Driven Benchmarking Is Critical for Both Employers and Candidates
With compensation data becoming more transparent, accessible, and comparative, employers need to rely on real-time market benchmarking tools to remain competitive. Similarly, professionals must evaluate opportunities based not just on salary numbers, but on total compensation, internal mobility, career trajectory, and the organization’s technology vision.
The Road Ahead: A Skills-Centered, Value-Focused Future
Looking forward, the global salary structure in software and SaaS will continue to evolve around three core principles: skills-first hiring, total rewards personalization, and performance-based pay. As AI and automation reshape delivery models, companies will need fewer people—but more qualified ones. Every role will be judged not by the tasks it includes, but by the value it generates.
For employers, building compensation systems that are fair, transparent, and aligned with business goals will be essential for retaining top talent and driving sustainable growth. For candidates, investing in high-demand skill sets and understanding the global pay landscape will unlock career mobility and increased earning power in both traditional and emerging markets.
Ultimately, the organizations and professionals that thrive in the software and SaaS industry by 2026—and beyond—will be those who treat compensation not just as a cost or a number, but as a dynamic strategy for growth, innovation, and long-term success.
If you find this article useful, why not share it with your hiring manager and C-level suite friends and also leave a nice comment below?
We, at the 9cv9 Research Team, strive to bring the latest and most meaningful data, guides, and statistics to your doorstep.
To get access to top-quality guides, click over to 9cv9 Blog.
To hire top talents using our modern AI-powered recruitment agency, find out more at 9cv9 Modern AI-Powered Recruitment Agency.
People Also Ask
What is the average salary for a software engineer globally in 2026?
The global average salary for a software engineer in 2026 ranges between $85,000 and $110,000, depending on region, experience, and specialization.
Which countries pay the highest software salaries in 2026?
The United States, Switzerland, and Israel offer the highest software engineering salaries in 2026 due to their advanced tech ecosystems and demand for innovation.
How much does a SaaS sales executive earn in 2026?
SaaS sales executives can earn total compensation between $150,000 and $260,000, with enterprise account executives receiving the highest pay.
Are cybersecurity roles seeing higher salary growth in 2026?
Yes, cybersecurity roles are among the fastest-growing in salary, with premiums up to 25% due to rising demand for secure digital operations.
What is the hourly rate formula for software roles in 2026?
Hourly rate is calculated by dividing the annual salary by weekly hours multiplied by 52 weeks, commonly used in contractor market benchmarking.
Is AI expertise influencing software salaries in 2026?
AI-related roles, especially in machine learning and LLMs, are commanding salary premiums of 20–30% above traditional software positions.
What’s the typical salary for a Customer Success Manager in 2026?
A Customer Success Manager earns a base salary ranging from $78,000 to $117,000, with higher pay for strategic or enterprise account ownership.
Are entry-level software salaries increasing globally in 2026?
Yes, entry-level salaries are increasing in high-growth markets, with ranges from $50,000 to $80,000 depending on location and tech stack.
How do total rewards packages affect hiring in 2026?
Total rewards, including remote flexibility, mental health benefits, and equity, are critical for attracting and retaining top software talent.
What is the average salary growth rate for software engineers in 2026?
Global salary growth for software engineers averages 5%–9% annually, with higher growth seen in AI, cloud, and cybersecurity roles.
Which industries pay the highest software salaries in 2026?
Finance, healthcare, and professional services offer the highest pay for tech roles due to digital transformation and data compliance needs.
How much do software engineers earn in the US in 2026?
In the US, software engineers earn between $100,000 and $180,000, with higher compensation in metro hubs like San Francisco and New York.
What’s the difference in pay between generalists and specialists in 2026?
Specialists in AI, cloud, and security earn significantly more than generalists, with premiums ranging from 15% to 30% based on expertise.
What’s the cost of leaving a sales role vacant in 2026?
Leaving an Account Executive role unfilled for 60 days can lead to over $200,000 in lost revenue, based on a $1.2 million annual quota.
Do equity and stock options impact software compensation in 2026?
Yes, equity is a key part of total compensation, especially for mid to senior professionals in high-growth SaaS startups or public firms.
How do salaries in emerging markets like Vietnam compare in 2026?
Salaries in Vietnam are rising rapidly, especially for AI and fintech roles, with increases of 15–25% and strong growth in leadership pay.
Are remote software jobs paying less in 2026?
Remote roles may offer slightly lower base salaries in some regions, but often compensate with flexibility, bonuses, or global mobility perks.
What’s the role of performance bonuses in SaaS compensation?
Performance bonuses are essential, especially in SaaS sales and customer success, often comprising 30%–50% of total earnings.
How much does a Cloud Security Architect earn in 2026?
A Cloud Security Architect can earn between $136,000 and $208,000 in base salary, depending on region and enterprise scope.
Which APAC countries show strong salary growth in 2026?
Singapore, Vietnam, and India show strong tech salary growth due to rapid SaaS adoption and international hiring demand.
Do tech professionals prefer hybrid or remote roles in 2026?
Over 70% of tech professionals prefer hybrid or remote setups, making it a top decision factor when evaluating job offers.
What is the compensation trend in the Middle East for 2026?
Countries like the UAE and Saudi Arabia offer high salaries for tech leaders, with monthly executive pay reaching AED 200,000 or more.
How are contractor rates calculated in the software industry?
Contractor rates are calculated using the hourly rate formula and adjusted for taxes, benefits, and project duration across jurisdictions.
What’s the typical salary for a software engineering director in 2026?
A software engineering director earns between $160,000 and $250,000, with total compensation higher in public or late-stage companies.
Are wellness programs part of tech compensation in 2026?
Yes, wellness programs including mental health support are part of total rewards and growing in importance for candidate satisfaction.
Is there a gender pay gap in the software industry in 2026?
Despite improvements, a gender pay gap still exists, though many companies are implementing pay equity audits and transparency initiatives.
How do SaaS salaries vary by company funding stage in 2026?
Late-stage or IPO-ready companies offer 15%–30% higher salaries than early-stage startups, particularly for senior and technical roles.
What is the average salary for DevOps engineers in 2026?
DevOps engineers earn between $110,000 and $180,000 globally, depending on region, cloud expertise, and deployment scale.
Do customer success professionals receive bonuses in 2026?
Yes, bonuses are increasingly tied to retention rates, expansion revenue, and account health metrics in customer success compensation plans.
How are daily contractor rates used in project budgeting?
Daily rates help companies estimate short-term project costs and compare in-house versus external hiring for technical project delivery.
Sources
Vena Solutions
Robert Half
IEEE-USA InSight
Kelly Services
Splunk
Cordia Resources
Cherry Bekaert
Auxis
Hays
Robert Walters Singapore
CodeSubmit
Hakia
BridgeView
Ravio
Blue Signal Search
Robert Walters Vietnam
Remotely Talents
Lorien
Motion Recruitment
ZAWYA
MyCareersFuture
Vertical Institute
VIR Vietnam
Dubai Chronicle
NICVN
Scribd
SaaStr
Activated Scale
CaptivateIQ
Seattle Corporate Search
Networks Connect
Custify
Built In
PayScale
ZipRecruiter
Customer Success Salary
Everstage
Morgan McKinley
Customer Success Collective

")


