Key Takeaways
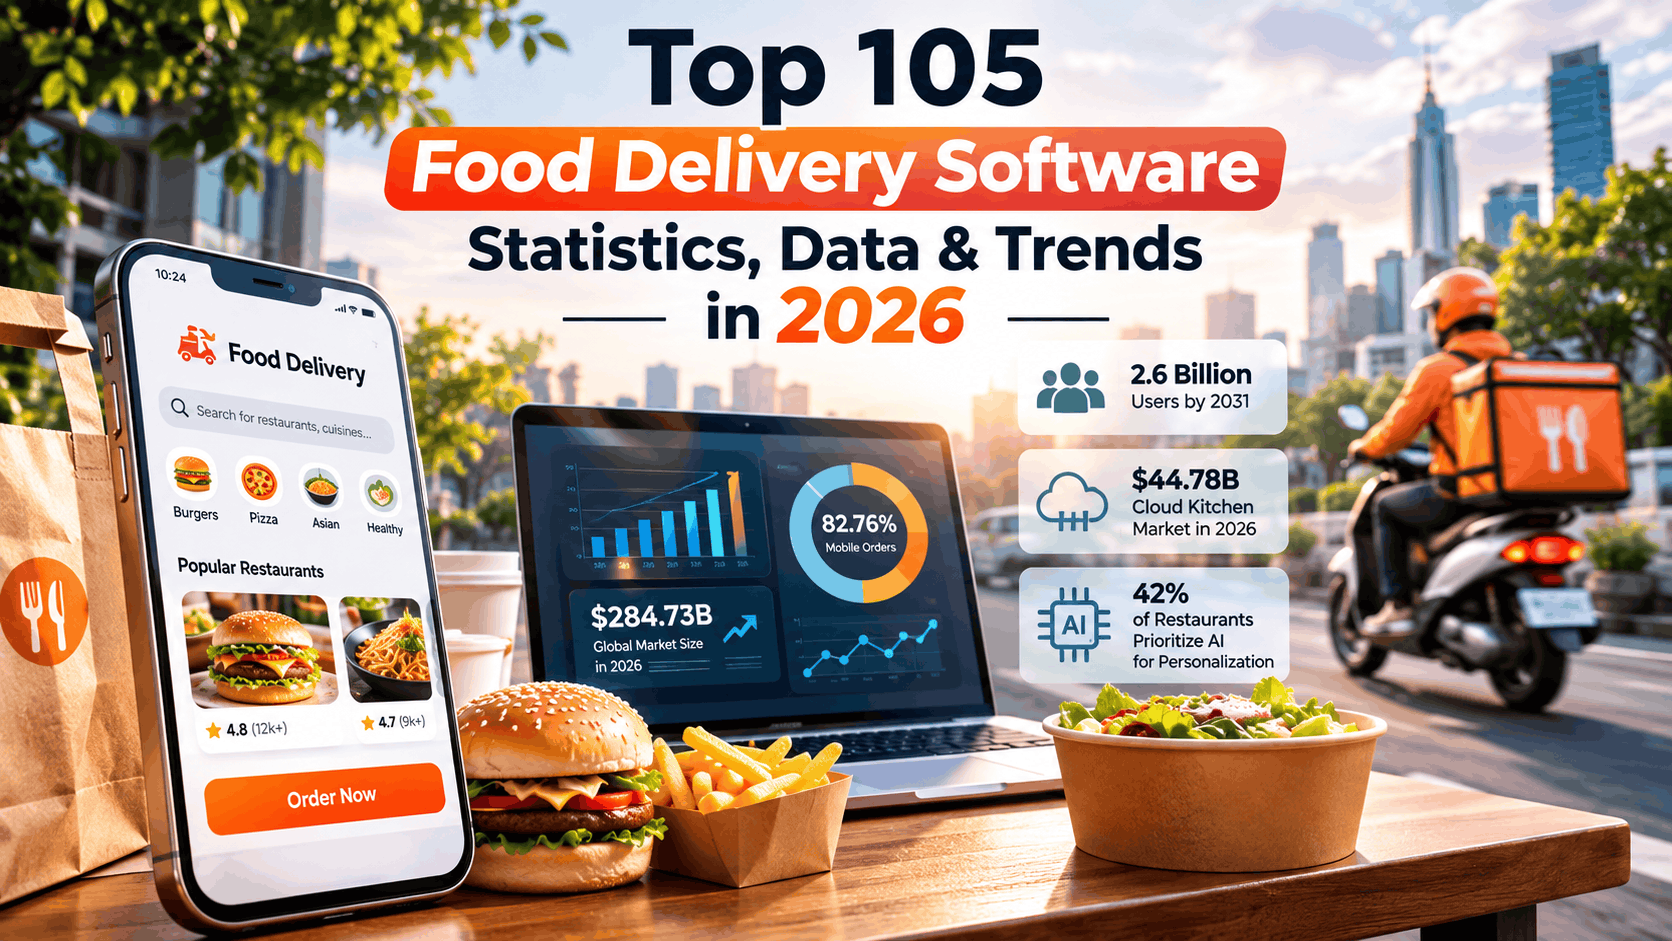
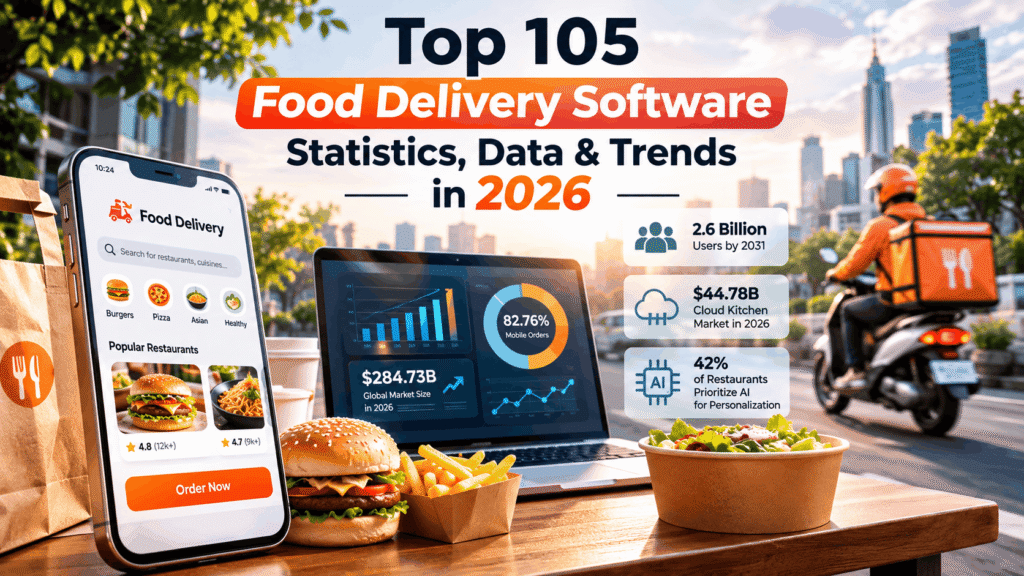
- Rapid Market Growth: The global online food delivery market is projected to reach USD 284.73 billion in 2026 and USD 468.51 billion by 2031, driven by digital adoption, mobile ordering, and growing consumer demand.
- Mobile Ordering and Cloud Kitchen Expansion: Mobile and tablet apps accounted for 82.76% of food delivery orders in 2025, while the global cloud kitchen market is forecast to reach USD 90.51 billion by 2031.
- AI, Automation, and Consumer Experience: Food delivery software trends in 2026 emphasize AI-powered personalization, real-time tracking, delivery optimization, and direct online ordering, as 58% of consumers expect deliveries within 40 minutes.
Food delivery software is transforming restaurant operations in 2026 through mobile ordering, AI-powered automation, real-time tracking, and digital payments. The global online food delivery market is projected to reach USD 284.73 billion in 2026, while mobile apps account for 82.76% of orders, highlighting growing demand for convenient, efficient, and personalized delivery experiences.
The global food delivery industry is undergoing a significant transformation in 2026, driven by rapid digital adoption, evolving consumer preferences, artificial intelligence (AI), and the growing demand for convenient, technology-enabled dining experiences. From mobile ordering applications and cloud kitchens to automated dispatch systems and real-time delivery tracking, food delivery software has become an essential component of the modern restaurant and food service ecosystem. As competition intensifies, restaurants, delivery platforms, and technology providers are increasingly investing in innovative software solutions to improve operational efficiency, reduce delivery costs, enhance customer satisfaction, and strengthen profitability.
Also, read our article on the Top 10 Best Food Delivery Software To Use.

The latest food delivery software statistics for 2026 highlight the extraordinary scale of this expanding industry. The global online food delivery market is estimated to reach USD 284.73 billion in 2026, up from USD 257.74 billion in 2025, with projections indicating growth to USD 468.51 billion by 2031 at a compound annual growth rate (CAGR) of 10.47%. Meanwhile, one market forecast values the food delivery software segment at USD 142.25 billion in 2026, with expectations of reaching USD 528.5 billion by 2035. Although market estimates vary depending on whether they measure delivery transactions, platform revenue, or software-related activities, these figures collectively illustrate the substantial commercial opportunities emerging across the digital food delivery ecosystem.
Mobile technology continues to dominate the industry, with mobile and tablet applications accounting for 82.76% of food delivery orders in 2025. Consumer adoption is also accelerating, with global meal delivery user penetration projected to reach 29.2% in 2026 and the number of users expected to climb to 2.6 billion by 2031. Major delivery platforms such as DoorDash, Uber Eats, and Grubhub remain influential competitors, while emerging markets across Asia-Pacific are creating new growth opportunities. The region is projected to expand at a 12.53% CAGR through 2031, reflecting increasing smartphone penetration, improving digital payment infrastructure, and changing urban consumption patterns.
Beyond traditional delivery applications, cloud kitchen software, restaurant online ordering systems, delivery management platforms, and AI-powered restaurant technology are reshaping how food businesses operate. The global cloud kitchen market is projected to grow from USD 44.78 billion in 2026 to USD 90.51 billion by 2031, while 56% of restaurant operators had already adopted online ordering systems by 2024. At the same time, 42% of restaurant operators identified improved personalization as their most important AI application, demonstrating the growing importance of customer analytics, intelligent recommendations, and data-driven engagement strategies.
Consumer expectations are also influencing food delivery software development. Research indicates that 58% of consumers expect deliveries within 40 minutes, while 45% abandon their orders when delivery fees become too expensive. Additionally, 67% of consumers express a preference for ordering directly through restaurant-owned websites or applications rather than third-party platforms. These trends emphasize the importance of transparent pricing, efficient delivery logistics, seamless payment integration, customer loyalty programs, and reliable order management systems.
For restaurant owners, food delivery startups, SaaS providers, investors, and technology decision-makers, understanding these developments is essential for navigating an increasingly competitive marketplace. Businesses that successfully integrate digital ordering, delivery automation, customer relationship management, and predictive analytics may be better positioned to improve customer retention, optimize operating costs, and capture emerging market opportunities.
This comprehensive guide to the Top 105 Food Delivery Software Statistics, Data & Trends in 2026 examines the latest industry developments across global market size, software adoption, mobile ordering, delivery platform market share, cloud kitchen expansion, digital payments, consumer behavior, and operational efficiency. By exploring these 105 statistics and market insights, readers can gain a clearer understanding of the technologies, business models, and consumer trends shaping the future of food delivery software in 2026 and beyond.
Before we venture further into this article, we would like to share who we are and what we do.
About 9cv9
9cv9 is a business tech startup based in Singapore and Asia, with a strong presence all over the world.
With over ten years of startup and business experience, and being highly involved in connecting with thousands of companies and startups, the 9cv9 team has listed some of the top and best companies/tools in this review.
If you like to get your company listed in our top B2B software reviews, check out our world-class 9cv9 Media and PR service and pricing plans here.
Top 105 Food Delivery Software Statistics, Data & Trends in 2026
1. Global Market Size & Growth
- The global online food delivery market is valued at USD 284.73 billion in 2026, up from USD 257.74 billion in 2025, signalling that demand for convenience-driven meal ordering shows no sign of slowing.
- Analysts project the market will reach USD 468.51 billion by 2031, representing a robust 10.47% compound annual growth rate (CAGR) for the 2026-2031 period.
- A separate estimate places the broader online food delivery services market at USD 198.99 billion in 2026, climbing to USD 314.84 billion by 2030 at a 12.2% CAGR — a reminder that market sizing varies meaningfully by scope and methodology.
- The market grew from $177.9 billion in 2025 to its current 2026 valuation at an 11.9% CAGR, driven by smartphone penetration and restaurant digitization.
- The food delivery software segment specifically — the actual technology platforms, not gross order value — is projected at USD 142.25 billion in 2026, expanding to USD 528.5 billion by 2035 at a remarkable 15.71% CAGR, confirming software providers are growing faster than the market they serve.
- Statista’s broader definition, which folds in grocery delivery crossover, projects worldwide online food delivery revenue reaching US$1.51 trillion in 2026.
- That same broader market is expected to grow at 6.24% CAGR through 2031, reaching a projected US$2.05 trillion.
- China alone is forecast to generate US$539.87 billion in food delivery revenue in 2026, making it the single largest national market in the world.
- The number of global Meal Delivery users is expected to reach 2.6 billion by 2031, reflecting the sheer scale of adoption underway.
- User penetration in the Meal Delivery market is projected at 29.2% globally in 2026, meaning nearly a third of the addressable population now uses these platforms.
- Longer-term forecasts suggest the food delivery industry could exceed $500 billion by 2032, reaching approximately $521.13 billion.
- Growth momentum is expected to intensify post-2030, with the market adding an estimated $223 billion in value between 2030 and 2035 alone.
- By 2033, some forecasts put the food delivery market as high as $576.37 billion, underscoring the industry’s mid-decade growth trajectory.
- Restaurant-to-consumer delivery is expected to account for 63.0% of the overall delivery segment in 2026, ahead of platform-to-consumer models, as diners increasingly favour trusted, established restaurant brands.
- Germany’s food delivery market is projected to grow at a steady 10.0% CAGR through 2036, supported by rising platform penetration among older demographics.
2. Payment Modes & Platform Segmentation
- Online payments accounted for 67.45% of all food delivery transactions in 2025, reflecting the industry’s decisive shift away from cash.
- Despite this, cash-on-delivery transactions are actually growing at the fastest rate of any payment mode, posting a 12.75% CAGR as the format expands into emerging markets with lower digital payment penetration.
- Mobile and tablet apps captured 82.76% of all food delivery orders in 2025, cementing mobile-first design as a non-negotiable requirement for delivery software.
- Desktop ordering portals, while a minority channel, still register an 11.84% CAGR, driven largely by enterprise and corporate catering demand.
- North America led all regions in food delivery revenue in 2025, reflecting the market’s early maturity in the region.
- Asia-Pacific is the fastest-growing food delivery region globally, expanding at a 12.53% CAGR through 2031 as smartphone and internet penetration accelerate across emerging economies.
- An overwhelming 95% of DoorDash orders placed in the past six months came through mobile devices, illustrating just how dominant app-based ordering has become even among established platforms.
3. Platform Market Share (US & Global)
- DoorDash commands an estimated 56-67% share of the U.S. food delivery market, making it the clear category leader domestically.
- Uber Eats holds the second-largest U.S. share at approximately 23-25%, trailing DoorDash by a significant margin.
- Grubhub’s U.S. market share sits in the 6-16% range depending on the measurement period, reflecting its ongoing struggle to keep pace with the two larger platforms.
- Market share is highly localized: DoorDash controls a commanding 74% share in San Francisco specifically, far above its national average.
- Conversely, Uber Eats leads Miami’s food delivery market with 55% share, while holding only 11% in San Francisco — proof that delivery software success is won city by city, not nationally.
- Uber Eats’ revenue rose dramatically from $1.1 billion in 2017 to $17.1 billion in 2025, an illustration of just how much the category has matured commercially.
- Uber One, Uber’s subscription bundle, has surpassed 40 million members globally and now contributes nearly 40% of total Uber Eats gross bookings.
- DoorDash processed 761 million orders in a single quarter in 2025, a scale few competitors can match.
- DoorDash reported 32% year-over-year order growth in recent quarters, signalling continued momentum despite its already-dominant position.
- Delivery Hero recorded €49.2 billion in gross merchandise value in 2025, reinforcing its status as a major global player outside the U.S.
- iFood committed a $3.1 billion investment plan for 2025-2026, underscoring the scale of capital still flowing into regional delivery platforms.
- As of June 2025, 78% of DoorDash’s global app downloads came from its home U.S. market, showing how concentrated its user base remains domestically.
- By contrast, only 25% of Uber Eats’ total global downloads came from the U.S., reflecting its far broader international footprint.
- Uber Eats holds the #1 market position in Japan, France, Australia, and Mexico, making it the more globally diversified of the two U.S.-based giants.
- China led total food delivery revenue among all countries at $40.2 billion in 2024, reflecting the maturity of platforms like Meituan and Ele.me.
- Uber Eats now operates across more than 45 countries worldwide, one of the widest geographic footprints in the industry.
4. Cloud Kitchens, Dark Kitchens & Ghost Kitchens
- The global cloud kitchen market is projected to grow from $44.78 billion in 2026 to $90.51 billion by 2031, a 15.11% CAGR reflecting rapid infrastructure investment.
- Asia-Pacific commanded 41.22% of global cloud kitchen revenue in 2025 and is set to grow at an even faster 18.24% CAGR through 2031.
- Third-party aggregators held 62.24% share of cloud kitchen ordering models in 2025, though that dominance is beginning to erode.
- Subscription meal plans are the fastest-growing cloud kitchen ordering model, expanding at 17.09% CAGR through 2031 as operators seek more predictable revenue.
- Asian cuisine accounted for 48.41% of cloud kitchen market share in 2025, reflecting both regional demand density and lower entry barriers for delivery-only formats.
- A separate estimate places the global cloud kitchen market at $80.52 billion in 2026, projected to reach $127.7 billion by 2030 — again illustrating how widely forecasts vary by research methodology.
- The U.S. dark kitchen segment alone is estimated at US$159.71 billion in 2026 and is projected to reach an extraordinary US$4,778.51 billion by 2033, a 62.5% CAGR that stands out even by food-tech standards.
- China’s dark kitchen market is estimated at US$8.53 billion in 2026, growing to US$43.70 billion by 2033 at a 26.3% CAGR.
- Dark kitchens are expected to account for more than 41% of all new restaurant launches in China by 2026, a striking shift in how new food businesses choose to enter the market.
- Europe’s dark kitchen market is estimated at US$7.40 billion in 2026, projected to reach US$25.31 billion by 2033 at a 19.2% CAGR.
- Independent operators led the global cloud kitchen market with 61.7% revenue share in 2025, outpacing branded chains thanks to their flexibility in adapting menus quickly.
- UAE-based cloud kitchen network Kitopi secured USD 50 million in growth funding in February 2026 to expand across the Middle East, a sign investor appetite for the format remains strong.
- In the UK specifically, 15% of delivery businesses were already operating as dark kitchens in 2026, illustrating how mainstream the format has become even in mature Western markets.
5. Restaurant Online Ordering Systems
- The restaurant online ordering system market was valued at USD 26.8 billion in 2024, projected to reach USD 55.3 billion by 2033 at an 8.5% CAGR.
- An alternate estimate values the same market at $14.7 billion in 2026, forecasting growth to $38.84 billion by 2035 at 11.40% CAGR — again reflecting how differently analysts scope the category.
- 56% of restaurant operators used online ordering systems in 2024, making digital ordering the new operational baseline rather than a competitive differentiator.
- 47% of restaurant operators had adopted QR code menus by 2024, a lasting legacy of pandemic-era contactless dining trends.
- Delivery and food service platforms are projected to capture 4.6% of global restaurant food sales by 2027, up from roughly 3.7% in 2023.
- 37% of U.S. consumers planning to order takeout used a digital ordering app or website in the past month, according to a 2024 survey.
- 29% of U.S. consumers planning to order delivery used a delivery app or website in the same period.
- 42% of restaurant operators cited improving personalization as the single most important use case for AI in their operations.
- Restaurants that operate native, self-owned online ordering systems see profit margins 10-15% higher than those relying solely on third-party apps.
- 48% of consumers say they would order more frequently from a restaurant if it offered its own direct delivery service, a clear signal in favour of first-party ordering investment.
- Personalized, app-based marketing drives a 25% higher email open rate for restaurants compared to generic campaigns.
- 37% of diners say they want to pay via mobile wallet when ordering, reinforcing the need for flexible, modern checkout options.
- Integrated restaurant software saves managers an average of 4 hours per week on administrative tasks — time that can be redirected toward service and growth.
- The global restaurant management software market was valued at USD 4.55 billion in 2022 and is expanding at a 15.8% CAGR through 2030.
- Online ordering volume is growing roughly 300% faster than in-house dining volume, underlining just how decisively consumer behaviour has shifted toward off-premise consumption.
- 75% of quick-service restaurant (QSR) sales are now generated through online and phone orders, making digital channels the dominant revenue source for the format.
- Full-service restaurants have seen a 237% increase in digital orders since 2020, showing that even traditional dine-in establishments have been forced to embrace delivery software.
- 78% of adults downloaded at least one food-related app in 2025, up sharply from 51% during the pandemic era.
- 62% of consumers now have three or more food delivery apps installed on their phones, reflecting how normalized multi-platform usage has become.
- The average digital order value is 23% higher than the average in-person transaction, giving restaurants a clear financial incentive to prioritize online channels.
- 67% of consumers say they prefer ordering directly through a restaurant’s own website or app rather than through a third-party platform.
- Of those consumers, 61% cite wanting to directly support the restaurant as their primary motivation for ordering direct.
- Restaurants using independent online ordering solutions report 10% sales increases and 35% cost savings per order compared to third-party delivery fees.
- Still, 31% of consumers use third-party delivery services at least twice a week, showing aggregators remain deeply embedded in everyday habits despite the direct-ordering trend.
- In a typical month, roughly 70% of U.S. consumers order food for delivery, and an equal 70% order takeout, demonstrating how mainstream both fulfillment methods have become.
- 60% of U.S. consumers order delivery or takeout at least once a week, making weekly ordering the new norm rather than the exception.
- 21% of consumers say they ordered restaurant delivery more frequently in 2025 than the year before, indicating continued adoption growth even in a maturing market.
6. Consumer Behavior & Ordering Patterns
- 42% of U.S. consumers order food delivery on a weekly basis, reinforcing delivery’s shift from occasional treat to routine habit.
- Millennials represent 45% of food delivery app users globally, the single largest generational segment in the category.
- 68% of Gen Z consumers say they prefer food delivery over dine-in in the post-pandemic era, a notable generational divergence in dining preference.
- Women account for 55% of food delivery orders in urban areas, a majority share worth noting for platform marketing and menu strategy.
- The average food delivery order value in the U.S. rose 15% to $35, reflecting both inflation and larger basket sizes as delivery becomes a primary meal source.
- Solo diners make up 40% of food delivery orders worldwide, highlighting delivery’s role as a convenience solution for individual consumption.
- Hispanic consumers in the U.S. order delivery 20% more frequently than the general population, an important demographic signal for platform targeting.
- Evening peak hours between 6 PM and 9 PM account for 60% of all food delivery order volume, concentrating demand into a narrow operational window.
- 75% of urban consumers aged 18-34 use delivery apps on a monthly basis, cementing the format’s dominance among younger, city-based consumers.
- GPS-based real-time order tracking is now present in 90% of food delivery orders, making live tracking a baseline software expectation rather than a premium feature.
- Repeat customers account for a striking 80% of total food delivery order volume, underscoring the outsized value of retention over acquisition.
- 45% of consumers abandon their cart once delivery fees climb too high, making transparent, competitive fee structures a critical retention lever.
- 63% of consumers say they order delivery specifically after a long or stressful work week, linking the category directly to convenience-driven emotional relief.
- 48% of consumers use delivery for quick weekday meals, reflecting its role in everyday meal planning rather than just weekend indulgence.
- 51% of U.S. consumers turn to a third-party platform like DoorDash when deciding where to order from, making platform discovery tools a key driver of restaurant visibility.
- 6 PM is the single most common hour for food delivery orders in the United States, anchoring the evening dinner rush as the industry’s defining demand window.
- Breakfast orders placed between 5-11 AM grew 29% year-over-year in the U.S. in 2024, signalling delivery’s expansion beyond its traditional lunch-and-dinner focus.
- The average delivery window across major platforms is approximately 35 minutes, the benchmark most consumers now measure service quality against.
- 27% of consumers say they would pay extra for faster delivery, opening the door for premium speed tiers as a monetization lever.
- 95% of restaurant owners say technology improves the overall efficiency of their operations, near-universal validation of continued software investment.
- Food delivery costs the average American an estimated $1,850 annually, a figure that puts the category’s household economic footprint into sharp relief.
- Americans order food delivery roughly once every 6.7 days — about 1.1 times per week — reflecting how deeply embedded the habit has become.
- The average last-mile delivery handoff takes approximately 12 minutes, a tight operational window platforms continue to optimize around.
- 61% of customers say they prefer home delivery over other fulfillment methods such as pickup or dine-in.
- 58% of consumers expect their delivery to arrive within 40 minutes or less, setting a firm expectation ceiling for platform logistics.
- 70% of delivery customers report satisfaction with the most affordable delivery option offered, suggesting cost-conscious tiers still deliver acceptable experiences.
- 23% of consumers say they would pay a premium specifically for same-day or faster delivery, validating continued investment in expedited logistics options.
Conclusion
The Top 105 Food Delivery Software Statistics, Data & Trends in 2026 reveal an industry experiencing substantial growth, technological innovation, and fundamental changes in consumer behavior. As restaurants, food delivery platforms, and cloud kitchen operators increasingly embrace digital transformation, food delivery software has evolved from a convenient ordering solution into a critical business infrastructure supporting customer engagement, operational efficiency, revenue growth, and long-term competitiveness.
With the global online food delivery market projected to reach USD 284.73 billion in 2026 and USD 468.51 billion by 2031, the commercial opportunities surrounding digital food ordering remain significant. Meanwhile, forecasts for the food delivery software segment suggest growth from USD 142.25 billion in 2026 to USD 528.5 billion by 2035, highlighting the expanding role of technology in restaurant operations and delivery management. Although these market projections reflect different industry definitions and research methodologies, they demonstrate the considerable investment and innovation expected across the broader food delivery ecosystem.
One of the most important food delivery software trends in 2026 is the continued dominance of mobile-first ordering experiences. With mobile and tablet applications accounting for 82.76% of food delivery orders in 2025, businesses must prioritize intuitive mobile interfaces, seamless payment processing, personalized recommendations, and reliable real-time order tracking. The growing adoption of digital payments, which represented 67.45% of food delivery transactions in 2025, further reinforces the importance of integrated, secure, and convenient checkout experiences.
At the same time, cloud kitchen technology and restaurant online ordering software are creating new opportunities for food businesses to expand without relying exclusively on traditional dine-in operations. The global cloud kitchen market is forecast to reach USD 90.51 billion by 2031, while consumer preferences increasingly favor restaurant-owned ordering platforms. With 67% of consumers expressing a preference for ordering directly through restaurant websites or applications, businesses have compelling reasons to invest in first-party ordering systems that strengthen customer relationships, provide greater control over customer data, and reduce dependence on third-party delivery marketplaces.
However, the statistics also highlight significant challenges facing the food delivery industry. Delivery fees, customer retention, operational costs, and fulfillment speed remain critical considerations. Research indicates that 45% of consumers abandon orders when delivery fees become too expensive, while 58% expect their food to arrive within 40 minutes. These expectations make efficient delivery management software, route optimization, transparent pricing, automated dispatch, and accurate delivery tracking increasingly valuable for maintaining customer satisfaction and protecting profit margins.
Looking ahead, artificial intelligence, predictive analytics, delivery automation, customer personalization, and integrated restaurant management systems are likely to play increasingly important roles in the evolution of food delivery technology. With 42% of restaurant operators identifying personalization as their most important AI application, businesses that effectively leverage customer insights and intelligent automation may gain meaningful advantages in customer acquisition, repeat purchases, and operational performance.
The rapid expansion of food delivery services across Asia-Pacific, combined with continued competition among established platforms such as DoorDash and Uber Eats, also suggests that the industry will become increasingly dynamic and geographically diverse. Software providers and restaurant operators will need to adapt their technologies, pricing strategies, and service models to different consumer expectations, regulatory environments, and market conditions.
Ultimately, the 105 food delivery software statistics for 2026 demonstrate that the future of the industry will be shaped not simply by the number of orders processed, but by how effectively businesses use technology to deliver faster, more affordable, personalized, and reliable customer experiences.
For restaurant owners, food delivery entrepreneurs, SaaS developers, technology investors, and industry professionals, the key takeaway is clear: investing in scalable, integrated, and customer-centric food delivery software is becoming essential for sustainable growth and long-term competitiveness. Organizations that combine operational efficiency with digital innovation, data-driven decision-making, and strong customer relationships will be better positioned to capitalize on the expanding opportunities in the global food delivery market throughout 2026 and beyond.
If you find this article useful, why not share it with your hiring manager and C-level suite friends and also leave a nice comment below?
We, at the 9cv9 Research Team, strive to bring the latest and most meaningful data, guides, and statistics to your doorstep.
To get access to top-quality guides, click over to 9cv9 Blog.
To hire top talents using our modern AI-powered recruitment agency, find out more at 9cv9 Modern AI-Powered Recruitment Agency.
People Also Ask
What is the global food delivery software market size in 2026?
One market forecast estimates the global food delivery software segment at USD 142.25 billion in 2026, with projected growth to USD 528.5 billion by 2035 at a 15.71% CAGR.
How fast is the global online food delivery market growing in 2026?
The global online food delivery market is projected to grow from USD 257.74 billion in 2025 to USD 284.73 billion in 2026, reaching USD 468.51 billion by 2031 at a 10.47% CAGR.
What are the biggest food delivery software trends in 2026?
Major trends include AI-powered personalization, mobile-first ordering, cloud kitchen expansion, real-time delivery tracking, digital payments, automated dispatch, and restaurant-owned ordering platforms.
What percentage of food delivery orders are placed through mobile apps?
Mobile and tablet applications accounted for 82.76% of food delivery orders in 2025, demonstrating the importance of mobile-first software development and convenient digital ordering experiences.
How many people use food delivery apps worldwide in 2026?
Global meal delivery user penetration is projected to reach 29.2% in 2026, while the number of meal delivery users worldwide is expected to reach approximately 2.6 billion by 2031.
Which food delivery company has the largest market share in the United States?
DoorDash leads the U.S. food delivery market with an estimated 56%–67% market share, followed by Uber Eats at approximately 23%–25% and Grubhub at around 6%–16%, depending on the measurement period.
What is DoorDash’s market share in 2026?
DoorDash holds an estimated 56%–67% share of the U.S. food delivery market. Its market dominance varies geographically, with approximately 74% market share in San Francisco.
How much market share does Uber Eats have in the United States?
Uber Eats holds approximately 23%–25% of the U.S. food delivery market, making it the second-largest platform nationally. Its market share varies significantly between individual cities.
How big is the global cloud kitchen market in 2026?
The global cloud kitchen market is projected to reach USD 44.78 billion in 2026 and USD 90.51 billion by 2031, representing a compound annual growth rate of approximately 15.11%.
What is the fastest-growing region for food delivery software?
Asia-Pacific is projected to be the fastest-growing food delivery region, expanding at a 12.53% CAGR through 2031, supported by smartphone adoption, internet connectivity, and increasing demand for digital ordering.
How is artificial intelligence transforming food delivery software in 2026?
AI supports personalized recommendations, demand forecasting, delivery optimization, and customer analytics. Approximately 42% of restaurant operators identify personalization as their most important AI application.
What percentage of restaurants use online ordering software?
Approximately 56% of restaurant operators used online ordering systems in 2024, highlighting the growing importance of digital ordering technology for restaurant operations and customer convenience.
What is the restaurant online ordering software market forecast?
The restaurant online ordering system market was valued at USD 26.8 billion in 2024 and is projected to reach USD 55.3 billion by 2033, representing an estimated 8.5% CAGR.
What percentage of food delivery transactions use online payments?
Online payments accounted for approximately 67.45% of food delivery transactions in 2025, reflecting growing consumer adoption of digital wallets, online banking, and cashless checkout solutions.
Are cash-on-delivery payments still growing in food delivery?
Yes. Cash-on-delivery transactions are projected to grow at a 12.75% CAGR, particularly in emerging markets where cash remains important despite increasing digital payment adoption.
Why are restaurants investing in their own food delivery software?
Restaurant-owned ordering platforms provide greater control over customer relationships, pricing, and order management. Approximately 67% of consumers prefer ordering directly through restaurant websites or applications.
How much can restaurants save with independent online ordering systems?
Restaurants using independent online ordering solutions report approximately 35% cost savings per order compared with third-party delivery fees, alongside reported sales increases of around 10%.
What percentage of consumers prefer ordering directly from restaurants?
Approximately 67% of consumers prefer ordering through restaurant-owned websites or applications, while 61% of these consumers identify directly supporting restaurants as their primary motivation.
How often do consumers order food delivery in 2026?
Approximately 42% of U.S. consumers order food delivery weekly, while broader research indicates that 60% order delivery or takeout at least once per week.
What is the average food delivery order value in the United States?
The average U.S. food delivery order value is approximately USD 35, reflecting a reported 15% increase associated with inflation, larger order sizes, and changing consumer purchasing habits.
What percentage of consumers abandon food delivery orders because of high fees?
Approximately 45% of consumers abandon their food delivery carts when delivery fees become too expensive, highlighting the importance of transparent pricing and affordable delivery options.
How quickly do consumers expect food delivery orders to arrive?
Approximately 58% of consumers expect food delivery within 40 minutes or less. The average delivery window across major platforms is estimated at approximately 35 minutes.
How important is real-time tracking in food delivery software?
GPS-based real-time tracking is reportedly available for approximately 90% of food delivery orders, making delivery visibility and accurate order updates important features of modern delivery platforms.
What percentage of food delivery orders come from repeat customers?
Repeat customers account for approximately 80% of total food delivery order volume, emphasizing the importance of customer retention, loyalty programs, personalized offers, and consistent delivery experiences.
Which generation uses food delivery apps the most?
Millennials represent approximately 45% of global food delivery app users, making them the largest generational segment and an important audience for digital marketing and customer engagement.
What are the busiest hours for food delivery orders?
Evening hours between 6 PM and 9 PM account for approximately 60% of food delivery order volume, with 6 PM identified as the most common ordering hour in the United States.
How is cloud kitchen software changing the restaurant industry?
Cloud kitchen software enables delivery-only restaurants to manage online orders, menus, inventory, and fulfillment without traditional dining spaces. Independent operators held 61.7% of cloud kitchen revenue in 2025.
What are the benefits of integrated restaurant management software?
Integrated restaurant software can streamline ordering, inventory management, payments, and administration. Research cited in the report suggests managers save approximately four hours weekly on administrative tasks.
How important is customer personalization in food delivery software?
Customer personalization is increasingly important, with 42% of restaurant operators identifying it as their leading AI use case. Personalized app-based marketing is also associated with 25% higher email open rates.
What is the future outlook for food delivery software beyond 2026?
Food delivery software is expected to evolve through AI, automation, mobile ordering, cloud kitchens, and integrated restaurant systems. One forecast projects the software segment will reach USD 528.5 billion by 2035.