Key Takeaways
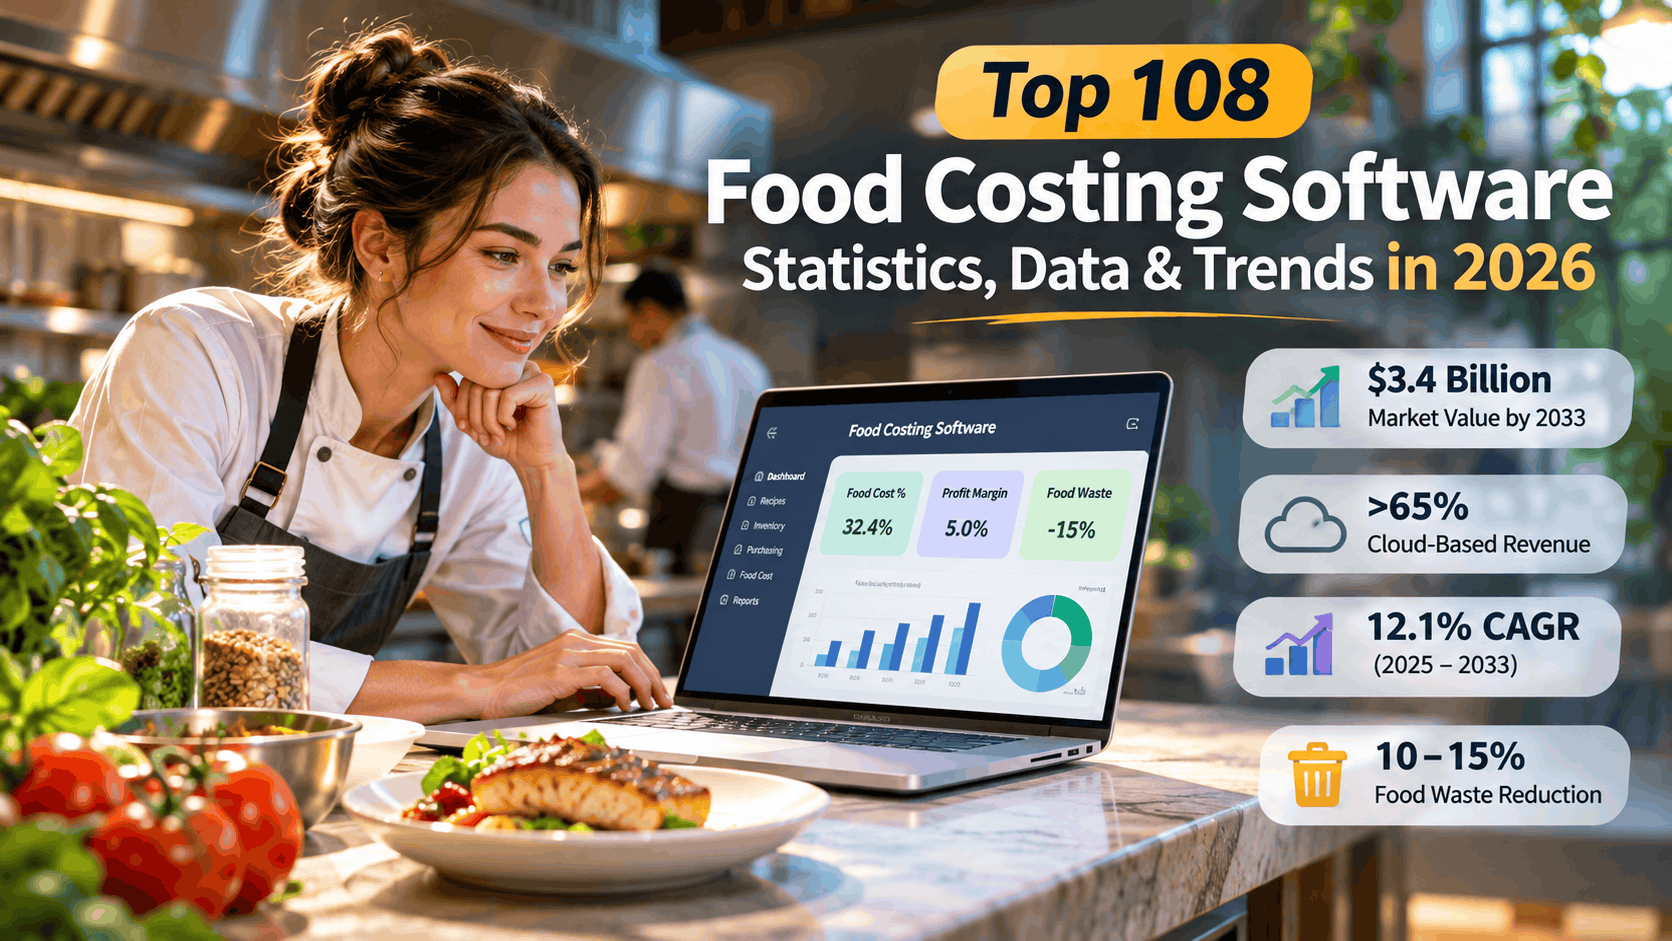
- Food Costing Software Market Growth: The global food costing software market is projected to reach $3.4 billion by 2033, growing at a 12.1% CAGR, driven by increasing demand for automated recipe costing, inventory management, and cloud-based restaurant software.
- Restaurant Profitability and Food Waste Reduction: With restaurant food costs averaging 28%–35% of revenue and profit margins typically ranging from 3%–5%, food costing software helps businesses optimize ingredient expenses, reduce food waste by 10%–15%, and improve operational efficiency.
- AI Adoption and Food Cost Management Trends: Cloud-based solutions account for over 65% of food costing software revenue, while AI-powered forecasting, automated inventory tracking, predictive analytics, and real-time recipe costing are transforming restaurant operations in 2026.
Food costing software helps restaurants control ingredient expenses, reduce food waste, and improve profitability. In 2026, the global market is projected to grow at a 12.1% CAGR, reaching $3.4 billion by 2033. Cloud-based solutions account for over 65% of market revenue, reflecting rising demand for automated recipe costing, inventory tracking, and AI-powered analytics.
The global foodservice industry is undergoing a significant digital transformation as restaurants, catering businesses, commercial kitchens, and food manufacturers increasingly adopt food costing software to manage rising ingredient prices, reduce food waste, optimize menu profitability, and improve operational efficiency. In 2026, accurate food cost management has become essential for maintaining competitive margins, particularly as inflation, labor expenses, and supply chain volatility continue to challenge foodservice operators worldwide.
Also, read our article on the Top 10 Best Food Costing Software To Know.

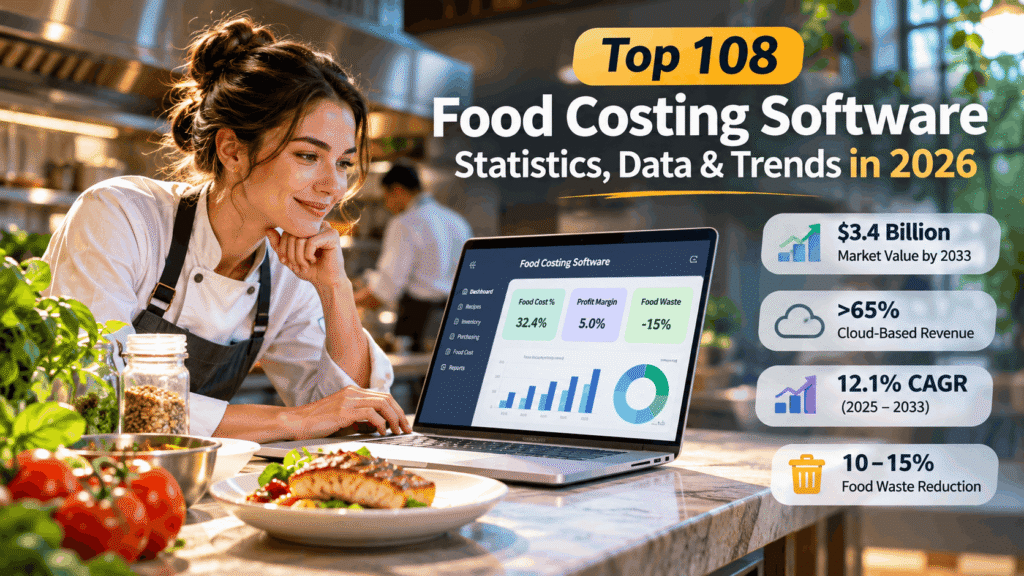
According to industry market estimates, the global food costing software market was valued at approximately $1.2 billion in 2024 and is projected to reach $3.4 billion by 2033, representing a compound annual growth rate (CAGR) of 12.1% between 2025 and 2033. Alternative market estimates suggest even greater market potential, reflecting differences in how food costing, recipe management, restaurant inventory management, and related software categories are defined. Meanwhile, cloud-based solutions account for more than 65% of food costing software revenue, highlighting the growing preference for scalable, subscription-based platforms that provide real-time financial visibility.
The importance of food costing software extends beyond market growth. Food costs typically account for 28% to 35% of restaurant revenue, while average restaurant net profit margins often remain between just 3% and 5%. Even minor fluctuations in ingredient expenses can significantly affect profitability. For example, a one-percentage-point increase in food costs translates into approximately $20,000 in additional annual expenses for a restaurant generating $2 million in revenue. These financial pressures are encouraging businesses to replace manual spreadsheets with automated recipe costing software, inventory tracking systems, purchasing management platforms, and integrated restaurant management solutions.
Food waste reduction is another major driver of software adoption. Restaurants are estimated to waste between 4% and 10% of the food they purchase, while digital inventory tracking can help reduce food waste by approximately 10% to 15%. Research estimates also suggest that every dollar invested in food waste reduction initiatives can generate between $7 and $14 in savings. These figures demonstrate why food costing and inventory management technologies are increasingly viewed as strategic investments rather than optional administrative tools.
Artificial intelligence, predictive analytics, and automation are further reshaping the food costing software landscape in 2026. Approximately 39% of surveyed restaurant executives are already investing in AI and machine learning, while another 48% are planning adoption. Modern food costing platforms increasingly incorporate AI-powered invoice processing, automated ingredient price updates, real-time inventory monitoring, demand forecasting, recipe profitability analysis, and supplier cost comparisons. These capabilities help restaurant operators make faster, data-driven decisions while reducing administrative workloads and improving cost accuracy.
At the same time, the broader restaurant technology ecosystem continues to expand. The global restaurant inventory management and purchasing software market is estimated to reach $5.26 billion in 2026, with projections indicating growth to $12.69 billion by 2032. This expansion reflects the increasing integration of food costing capabilities with point-of-sale (POS) systems, enterprise resource planning (ERP) platforms, procurement software, and restaurant analytics solutions.
This comprehensive guide to the Top 108 Food Costing Software Statistics, Data & Trends in 2026 examines the latest market size estimates, growth forecasts, restaurant food cost benchmarks, software adoption trends, food waste statistics, cloud deployment patterns, AI innovations, and emerging industry developments. It also explores the financial and operational challenges driving demand for food costing technology across restaurants, hospitality businesses, institutional kitchens, and food manufacturers.
Whether readers are restaurant owners, foodservice executives, hospitality technology providers, software developers, investors, or industry analysts, these 108 food costing software statistics provide valuable insights into how digital cost management solutions are transforming restaurant profitability, inventory efficiency, menu engineering, and the future of foodservice operations in 2026 and beyond.
Before we venture further into this article, we would like to share who we are and what we do.
About 9cv9
9cv9 is a business tech startup based in Singapore and Asia, with a strong presence all over the world.
With over ten years of startup and business experience, and being highly involved in connecting with thousands of companies and startups, the 9cv9 team has listed some of the top and best companies/tools in this review.
If you like to get your company listed in our top B2B software reviews, check out our world-class 9cv9 Media and PR service and pricing plans here.
Top 108 Food Costing Software Statistics, Data & Trends in 2026
Section 1: Food Costing Software Market Size & Growth
- $1.2 billion (2024) global food costing software market value. The food costing software category was valued at roughly $1.2 billion in 2024, underscoring its emergence as a distinct, investable software niche within the broader food-tech ecosystem.
- $3.4 billion projected market value by 2033. Analysts forecast the global food costing software market will nearly triple to $3.4 billion by 2033, signaling sustained long-term demand from restaurants, caterers, and food manufacturers.
- 12.1% CAGR (2025–2033) for food costing software. A compound annual growth rate of 12.1% places food costing software among the faster-growing verticals within foodservice technology, outpacing many broader software categories.
- $4 billion market size cited by an alternate 2023 estimate. A separate market analysis pegged the food costing software market at $4 billion in 2023, illustrating how estimates vary depending on scope and segment definitions used by different research firms.
- $6.02 billion projected market size by 2031 (alternate estimate). Under a broader market definition, food costing software is expected to reach $6.02 billion by 2031, growing at a 9.94% CAGR, reflecting continued digitization of kitchen cost management.
- Cloud-based deployment exceeds 65% of food costing software revenue. Cloud-based solutions account for more than 65% of total food costing software revenue in 2024, driven by lower upfront costs, automatic updates, and remote accessibility for multi-location operators.
- Restaurants represent the largest end-user segment. Restaurants make up the single largest application segment for recipe and food costing software, commanding a substantial share of category revenue ahead of bakeries, catering services, and food manufacturers.
- North America leads regional adoption. North America dominates the food costing and recipe costing software market due to mature foodservice infrastructure, high digital adoption rates, and dense concentration of multi-unit restaurant chains.
Section 2: Recipe Costing Software (Adjacent Submarket)
- $842 million recipe costing software market size (2024, conservative estimate). One research estimate places the standalone recipe costing software market at $842 million in 2024, reflecting rapid digital transformation specifically within culinary cost-management tools.
- $1.12 billion recipe costing software market (alternate 2024 estimate). A separate estimate values the recipe costing software market at $1.12 billion for the same year, projected to grow to $3.34 billion by 2033 at a 12.7% CAGR.
- Cloud deployment captures ~65% of recipe costing software share. Roughly 65% of recipe costing software revenue in 2024 came from cloud-based deployments, confirming a clear industry-wide shift away from on-premise installations.
- Restaurants account for over 45% of recipe costing software revenue. Restaurants alone generate more than 45% of recipe costing software market revenue, ahead of bakeries, catering services, and institutional kitchens combined.
- On-premise share is gradually declining among SMEs. Small and medium enterprises are steadily moving away from on-premise recipe costing deployments in favor of lower total-cost-of-ownership cloud subscriptions.
- Hybrid deployment models are gaining traction. A growing share of food businesses are adopting hybrid cloud/on-premise recipe costing setups to balance data control with scalability and remote access.
Section 3: Restaurant Inventory Management & Purchasing Software
- $4.55 billion restaurant inventory & purchasing software market (2025). The global restaurant inventory management and purchasing software market — a close adjacent category to food costing tools — reached an estimated $4.55 billion in 2025.
- $5.26 billion projected market size for 2026. This market is expected to expand to $5.26 billion in 2026, reflecting accelerating demand for tighter supply-chain and procurement control among foodservice operators.
- 15.75% CAGR through 2032. The restaurant inventory and purchasing software segment is forecast to grow at a 15.75% compound annual rate, reaching an estimated $12.69 billion by 2032.
- $9.18 billion market size projected by 2030 (alternate forecast). A separate forecast estimates this market will hit $9.18 billion by 2030, growing from $3.95 billion in 2024 at roughly 15% CAGR.
- Digital inventory tracking cuts food waste by 10–15%. Restaurants using digital inventory tracking tools report a 10% to 15% reduction in food waste compared to manual, spreadsheet-based tracking methods.
- Real-time inventory alerts reduce overstocking by 20%. Automated, real-time inventory alerts help operators cut overstocking by approximately 20%, directly protecting working capital tied up in perishable ingredients.
Section 4: Broader Restaurant Management & Food Software Market
- $12.5 billion food software market size (2024). The broader food software market — encompassing costing, inventory, and operations tools — was valued at approximately $12.5 billion in 2024.
- $30 billion projected food software market by 2033. This wider category is forecast to more than double to $30 billion by 2033, growing at a 10.2% CAGR as digital adoption spreads across the food supply chain.
- Restaurant management software market to exceed $13 billion by 2030. The global restaurant management software (RMS) market — which frequently bundles food costing modules — is projected to surpass $13 billion by 2030 at roughly 15% CAGR.
- Cloud-based RMS deployment held over 60% share in 2022. Cloud-based restaurant management software already accounted for more than 60% of category revenue by 2022, a share that has continued climbing through 2026.
- Automation can cut labor costs by up to 30%. Industry analysts observe that RMS-driven automation, including costing and scheduling modules, can reduce labor costs by as much as 30% for adopting operators.
- Full-service restaurant (FSR) segment holds 36.5% of RMS market share. Full-service restaurants represent the largest end-use segment of the restaurant management software market, commanding a 36.5% share in 2024.
Section 5: Deployment Mode — Cloud vs. On-Premise
- Cloud captures 55% of food & beverage industry software share. Across the wider food and beverage software category, cloud-based deployment is projected to hold approximately 55% market share in 2025, the leading deployment type.
- Large enterprises command 62% of F&B software applications. Large enterprises account for 62% of the food and beverage industry software market by application, though SME adoption is accelerating fast.
- On-premise RMS segment still growing at 13.8% CAGR. Despite cloud dominance, the on-premise restaurant management software segment continues growing at a 13.8% CAGR, driven by large operators with strict data-compliance needs.
- Cloud POS systems cost 50% less upfront than legacy systems. Cloud-based point-of-sale systems, often bundled with costing modules, carry roughly 50% lower upfront costs than legacy on-premise installations.
- Remote-location operators still favor on-premise systems. Restaurants in areas with limited or unreliable internet connectivity continue to rely on on-premise food costing and management software for operational continuity.
- Data privacy concerns sustain on-premise demand among large enterprises. Large food manufacturers and enterprises with stringent data-security requirements continue to favor on-premise costing deployments despite higher maintenance costs.
Section 6: Food Cost Percentage Benchmarks by Restaurant Type
- Industry-average food cost sits at 32.4% of revenue. The current U.S. industry average food cost for full-service restaurants stands at 32.4% of revenue, according to National Restaurant Association 2026 data.
- 28–35% is the widely cited optimal food cost range. Most restaurant operators aim to keep food and beverage costs between 28% and 35% of sales, regardless of concept type.
- Quick-service restaurants target 25–30% food cost. Quick-service restaurants (QSRs) typically run food costs in the 25% to 30% range due to standardized menus and higher purchasing volume.
- Casual dining runs 30–34% food cost. Casual dining concepts generally operate with food costs between 30% and 34%, balancing ingredient quality against price-sensitive guest expectations.
- Fine dining ranges from 34–40% food cost. Fine dining establishments often accept higher food costs of 34% to 40% because premium menu pricing offsets the elevated ingredient expense.
- Bar-heavy concepts achieve 18–24% blended food cost. Restaurants with strong beverage programs can push blended food cost percentages down to 18–24%, since beverage cost of goods runs far lower than food.
- Prime cost benchmark sits at 55–65% of revenue. A healthy restaurant’s combined prime cost — food plus labor — should fall between 55% and 65% of total revenue to sustain profitability.
- A 1-point food cost swing equals $20,000 annually on $2M revenue. On a restaurant generating $2 million in revenue, a single percentage-point increase in food cost translates to roughly $20,000 in lost profit per year.
- Only 42% of U.S. restaurants were profitable in 2024. Fewer than half of U.S. restaurants — just 42% — reported profitability in 2024, highlighting the urgency of precise cost-control tools like food costing software.
- Food costs run more than 35% above pre-pandemic levels. Restaurant food costs remain over 35% higher than pre-pandemic benchmarks, intensifying the need for real-time recipe and ingredient cost tracking.
Section 7: Labor Cost, Prime Cost & Profitability
- Full-service labor costs hit a 36.5% median of sales. Labor costs at full-service restaurants reached a median of 36.5% of sales, exceeding the traditional 30–35% target range.
- Profitable operators hold labor at 34.2% of sales. Restaurants that remain profitable tend to hold labor costs closer to 34.2% of revenue, roughly 2.3 points below the broader industry median.
- Total restaurant expenses rose 36% between 2019 and 2026. Average total operating expenses for U.S. restaurants climbed 36% between 2019 and 2026, driven by food, labor, occupancy, and card-processing cost increases.
- Credit card processing fees rose more than 30% since 2019. Often-overlooked operational costs like credit card processing fees have increased over 30% since 2019, quietly compressing margins alongside food costs.
- Restaurant profit margins average just 3–5%. Typical restaurant net profit margins hover in a thin 3% to 5% range, leaving little room for error in food cost management.
- Capital expenditure reserves should equal 3–5% of revenue. Financial advisors recommend restaurants reserve 3% to 5% of annual revenue for equipment and technology upgrades, including costing and inventory software.
Section 8: Restaurant Industry Size & Macro Context
- $1.55 trillion projected U.S. restaurant and foodservice sales in 2026. The National Restaurant Association forecasts total U.S. restaurant and foodservice sales will reach $1.55 trillion in 2026, a 4.8% nominal increase over 2025.
- 1.3% real (inflation-adjusted) sales growth forecast for 2026. After adjusting for inflation, actual restaurant sales growth is projected at just 1.3% in 2026, meaning much of the nominal gain reflects higher menu prices rather than more guest traffic.
- 15.8 million projected restaurant and foodservice jobs in 2026. The restaurant and foodservice sector is expected to employ 15.8 million workers in 2026, making it one of the largest private employers in the United States.
- More than 100,000 net new restaurant jobs forecast for 2026. Operators plan to add over 100,000 net new jobs in 2026 despite a cooling broader labor market.
- Eating and drinking places generate ~$1.2 trillion of total sales. Eating and drinking establishments alone are projected to account for nearly $1.2 trillion of the industry’s total $1.55 trillion in 2026 sales.
- Restaurants represent 53% of the American household food dollar. More than half of every dollar U.S. households spend on food — 53% — now goes toward restaurant and foodservice purchases rather than groceries.
- 60% of operators reported decreased traffic in the prior year. A majority of restaurant operators, 60%, reported declining customer traffic, reinforcing why cost-side controls like food costing software matter more when top-line growth is uncertain.
- 99% of U.S. restaurant companies are small, family-owned businesses. An estimated 99% of companies in the U.S. restaurant industry are family-owned small businesses with fewer than 50 employees, making affordable costing software especially valuable for this segment.
Section 9: Food & Ingredient Price Inflation
- Restaurant menu prices rose 3.5% year-over-year (May 2026). Menu prices at U.S. restaurants increased 3.5% year-over-year as of May 2026, marking the slowest pace of growth in 16 months.
- Restaurant CPI peaked at 8.8% in March 2023. The fastest restaurant price inflation in more than two decades occurred in March 2023, when the restaurant Consumer Price Index hit 8.8% year-over-year.
- Food-away-from-home prices forecast to rise 3.6% in 2026. The USDA projects food-away-from-home prices — meals eaten at restaurants — will climb 3.6% for the full year 2026, outpacing grocery inflation.
- Food-at-home prices forecast to rise 2.8% in 2026. Grocery (food-at-home) prices are forecast to increase a more moderate 2.8% in 2026, according to USDA Economic Research Service projections.
- Beef and veal prices projected up 7.5% in 2026. Beef and veal prices are forecast to rise 7.5% at the midpoint for 2026, making protein-heavy menus a particular cost-management challenge for operators.
- Egg prices forecast to fall roughly 30% in 2026. In contrast to beef, USDA forecasts egg prices will decline approximately 30.4% in 2026, illustrating the volatility food costing software must track across ingredient categories.
- U.S. consumers, businesses, and government spent $2.6 trillion on food and beverages (2023). Total food and beverage spending across the U.S. economy reached $2.6 trillion in 2023, underscoring the scale of the market that costing software ultimately serves.
- All-food CPI rose an average 2.6% annually in 2024–2025. The overall food Consumer Price Index increased at an average annual rate of 2.6% across 2024 and 2025, a slightly slower pace than the broader all-items CPI.
Section 10: Food Waste — Volume & Financial Impact
- Food waste costs the U.S. restaurant industry an estimated $162 billion annually. Restaurant food waste is estimated to cost the industry $162 billion every year, representing a massive and often underestimated drain on profitability.
- Restaurants waste 4–10% of all food purchased. On average, restaurants waste between 4% and 10% of the food they purchase, due to spoilage, over-preparation, and plate waste.
- U.S. restaurants generate 22–33 billion pounds of food waste annually. American restaurants collectively generate somewhere between 22 and 33 billion pounds of food waste each year.
- Roughly 15% of landfill food waste originates from restaurants. Restaurants contribute approximately 15% of all food waste that ends up in landfills nationwide.
- Nearly 70% of restaurant food waste comes from customer plates. A Georgetown University-affiliated report found that close to 70% of restaurant food waste originates from food left uneaten on customers’ plates rather than kitchen prep.
- Pre-consumer prep waste accounts for 58% of total restaurant food waste. Kitchen-side prep waste — trimming, spoilage, and over-production before food reaches the table — makes up an estimated 58% of total restaurant food waste.
- Over-production drives 45% of professional kitchen food waste. Overproduction alone is responsible for roughly 45% of total food waste generated inside professional kitchens.
- Restaurants that track waste cut waste costs by 15% in year one. Restaurants that actively track and measure food waste reduce their associated costs by an average of 15% within the first year of implementation.
- Every $1 invested in waste reduction returns $7–$14 in savings. Food waste reduction initiatives generate a strong return on investment, with studies estimating $7 to $14 in savings for every $1 invested.
- Buffet-style operations generate higher-than-average waste rates. Buffet-format restaurants show elevated food waste generation compared to a la carte or fixed-menu formats, due to overproduction built into the service model.
- Global economic cost of food waste projected at $540 billion for 2026. Across the global retail and foodservice supply chain, the economic cost of food waste is forecast to reach $540 billion in 2026, up from $526 billion the prior year.
- Meat waste alone projected to cost $94 billion globally in 2026. Meat is the single most costly food-waste category, projected to account for $94 billion in lost value globally in 2026 — nearly a fifth of total losses.
Section 11: Food Cost Variance, Portion Control & Loss Prevention
- Well-run restaurants keep food cost variance under 2%. Restaurants with disciplined costing systems typically maintain actual-versus-theoretical food cost variance below 2%, a key benchmark food costing software helps operators hit.
- Variance above 5% signals systemic problems. A food cost variance exceeding 5% is generally considered a red flag pointing to over-portioning, spoilage, theft, or inaccurate recipe data.
- Employee theft accounts for 4–7% of restaurant revenue losses. Studies estimate that internal theft — from over-pouring drinks to pocketing inventory — accounts for 4% to 7% of total restaurant revenue losses annually.
- A 5% human error rate is typical in manual inventory tracking. Manual, spreadsheet-based inventory processes carry an estimated 5% human error rate, translating into hundreds or thousands of dollars in unnoticed monthly losses.
- Weekly food cost tracking catches problems roughly 3x faster than monthly. Operators who track food cost weekly rather than monthly identify cost-control issues approximately three times faster, limiting cumulative losses.
- Chicken breast trim loss can run 20–25%. Failing to account for yield loss — such as 20% to 25% trim waste on raw chicken breast — is a common source of understated theoretical food costs in costing software setups.
- Fruits and vegetables see 40–50% waste rates in foodservice. Produce is among the highest-waste ingredient categories in foodservice operations, with an estimated 40% to 50% of fruits and vegetables purchased ultimately wasted.
- Europe’s foodservice sector accounts for 14% of total supply-chain food waste. In Europe specifically, the foodservice sector is responsible for roughly 14% of all food waste generated across the entire food supply chain.
Section 12: Restaurant Technology, AI & Automation Adoption
- 39% of restaurant executives already invest in AI and machine learning. Nearly 39% of surveyed restaurant executives report actively investing in AI and machine learning tools as of 2026, with another 48% planning adoption soon.
- 74% of operators view technology as augmenting labor, not replacing it. Nearly three-quarters of restaurant operators, 74%, now see technology — including costing and forecasting tools — as a labor-augmenting force rather than a replacement.
- Integrated software saves managers an average of 4 hours weekly. Restaurant managers using integrated management software, including costing modules, save an average of 4 hours per week on administrative tasks.
- 80% of restaurateurs use sales data to adjust menus. Roughly 80% of restaurant operators now use sales data analytics — often integrated with costing tools — to inform menu adjustments and pricing decisions.
- 52% of diners have already used AI-powered ordering tools. More than half of consumers, 52%, report having already interacted with AI-powered restaurant ordering systems, reflecting broader digital transformation across the dining experience.
- 60% of consumers more likely to try a restaurant offering mobile ordering. Consumer research shows 60% of diners are more likely to visit a restaurant that offers mobile ordering capabilities.
- Global restaurant POS and payment market expected to reach $18.6 billion by 2030. The broader restaurant POS and payment solutions market, which increasingly integrates food costing features, is projected to hit $18.6 billion by 2030.
- AI-driven demand forecasting helps minimize food waste and improve profitability. Machine-learning-based demand forecasting, now embedded in many food costing and inventory platforms, is credited with reducing waste while improving overall kitchen profitability.
Section 13: Food Safety & HACCP Compliance Software (Adjacent Category)
- FoodDocs AI generates a full HACCP plan in under one hour. AI-powered food safety platforms can now generate a complete HACCP compliance plan in under 60 minutes, down from what once took days of manual documentation.
- HACCP software pricing starts around $169/month. Entry-level HACCP compliance software pricing begins at approximately $169 per month, positioning it as an accessible complement to food costing tools for small and mid-size operators.
- Monitoring tasks can go live within 15 minutes of setup. Modern HACCP platforms allow restaurants to have their first food-safety monitoring task running within just 15 minutes of onboarding.
- HACCP software supports ISO 22000:2018 compliance. Leading food safety software platforms now support ISO 22000:2018 international food safety management standards, broadening their appeal beyond U.S.-only compliance needs.
- 200+ free food safety templates offered by leading platforms. Some HACCP software vendors provide libraries of over 200 pre-built compliance templates, reducing setup friction for smaller food businesses.
- Paper-based HACCP systems face rising audit failure risk. Restaurants still relying on paper-based food safety logs face increasing audit and inspection risk as regulators expect faster, digitally verifiable compliance records.
Section 14: SaaS Spending & IT Budget Context
- SMBs typically spend $50,000–$500,000 annually on SaaS. Small and mid-size businesses, including multi-unit restaurant groups, typically spend between $50,000 and $500,000 annually on SaaS subscriptions collectively.
- SaaS now represents 35–45% of total IT budgets. Software-as-a-service spending accounts for 35% to 45% of total IT budgets in 2026, up from roughly 25% in 2020, reflecting the broader shift toward cloud-based tools like food costing platforms.
- Small businesses allocate 4–6% of revenue to IT. Small businesses typically dedicate 4% to 6% of annual revenue to information technology, a benchmark relevant to restaurants budgeting for costing and inventory software.
- Global SaaS market on track to hit $465 billion in 2026. The global SaaS market — the category food costing software belongs to — is projected to reach $465 billion in 2026, growing roughly 18% year-over-year.
Section 15: Capterra Directory & Vendor Landscape
- Recipe costing software pricing starts as low as $25/month on Capterra. Entry-level recipe costing software listed on Capterra’s directory starts at approximately $25 per feature, per month, making the category accessible to independent operators.
- Free trials are commonly available across food costing vendors. The majority of food costing software vendors listed on Capterra offer free trial periods, lowering the barrier to evaluation for small food businesses.
- Key features consistently include cost management and recipe management. Across the Capterra food costing software directory, the most consistently listed core features are cost management, recipe management, inventory tracking, and reporting/analytics.
- Vendors span cloud, Android, and Windows platforms. Leading food costing software solutions on Capterra typically support cloud, Android, and Windows deployment, giving operators flexibility in how staff access the system.
- AI-powered invoice reading is an emerging differentiator. Newer entrants in the food costing space now use AI to automatically read supplier invoices and reconcile them against delivery receipts, flagging discrepancies without manual data entry.
- Sub-recipe costing is a widely requested feature. The ability to cost sub-recipes — such as sauces and stocks — once and apply them across multiple dishes is among the most commonly cited must-have features in vendor reviews.
Conclusion
The Top 108 Food Costing Software Statistics, Data & Trends in 2026 highlight the growing importance of digital cost management solutions in an increasingly competitive, technology-driven foodservice industry. As restaurants, catering businesses, commercial kitchens, and food manufacturers face rising ingredient costs, labor shortages, supply chain disruptions, and tightening profit margins, food costing software is becoming an essential tool for improving financial visibility, operational efficiency, and long-term business sustainability.
With the global food costing software market projected to grow from approximately $1.2 billion in 2024 to $3.4 billion by 2033, at a compound annual growth rate (CAGR) of 12.1%, the industry presents significant opportunities for software providers, restaurant operators, and technology investors. The growing adoption of cloud-based platforms, which account for more than 65% of food costing software revenue, further demonstrates the shift toward accessible, scalable, and integrated solutions that support real-time cost monitoring and data-driven decision-making.
One of the most important findings from these 2026 food costing software statistics is the direct relationship between effective cost management and restaurant profitability. With food costs typically representing 28% to 35% of restaurant revenue and average net profit margins ranging from just 3% to 5%, even small improvements in ingredient purchasing, portion control, recipe costing, and inventory management can have a meaningful financial impact. For a restaurant generating $2 million in annual revenue, reducing food costs by just one percentage point could translate into approximately $20,000 in annual savings, assuming other operating conditions remain unchanged.
Food waste management is another critical area where technology can deliver measurable value. Restaurants are estimated to waste between 4% and 10% of purchased food, while digital inventory tracking systems can help reduce waste by approximately 10% to 15%. These findings reinforce the importance of automated inventory management, accurate demand forecasting, real-time stock monitoring, and recipe standardization in reducing unnecessary expenses and supporting more sustainable foodservice operations.
The integration of artificial intelligence (AI), machine learning, predictive analytics, and automation is also transforming the capabilities of modern food costing software. With approximately 39% of surveyed restaurant executives already investing in AI and machine learning technologies, the industry is moving toward more intelligent platforms capable of automating supplier invoice processing, identifying food cost variances, forecasting ingredient demand, optimizing menu pricing, and detecting inventory discrepancies. These advancements are expected to make food costing solutions increasingly proactive rather than purely administrative.
Furthermore, the projected expansion of the restaurant inventory management and purchasing software market to $12.69 billion by 2032 reflects the growing demand for interconnected restaurant technology ecosystems. Businesses are increasingly seeking software solutions that integrate food costing, inventory management, procurement, point-of-sale (POS) systems, accounting, and business intelligence into unified platforms. This trend creates opportunities for software developers to deliver comprehensive solutions that simplify restaurant operations while improving cost transparency and profitability.
However, successful food costing software adoption requires more than purchasing a digital platform. Restaurant operators must also prioritize accurate ingredient data, consistent recipe standardization, employee training, supplier price monitoring, and regular food cost analysis. Businesses that combine reliable software with disciplined operational practices are better positioned to identify inefficiencies, control expenses, and respond quickly to changing market conditions.
Looking ahead, the future of food costing software beyond 2026 will likely be shaped by greater AI adoption, cloud-based collaboration, automated purchasing workflows, predictive inventory analytics, and increasingly sophisticated menu engineering capabilities. As foodservice businesses place greater emphasis on profitability, sustainability, and operational resilience, demand for affordable, user-friendly, and intelligent food cost management solutions is expected to continue growing.
Ultimately, these 108 food costing software statistics and trends for 2026 demonstrate that effective food cost management is no longer simply a back-office accounting function. It has become a strategic business capability that directly influences restaurant profitability, pricing competitiveness, waste reduction, and long-term growth. For restaurant owners, hospitality professionals, food manufacturers, and technology providers, understanding these market developments and adopting appropriate digital tools will be essential for navigating the evolving foodservice landscape and building more efficient, profitable, and sustainable operations in 2026 and beyond.
If you find this article useful, why not share it with your hiring manager and C-level suite friends and also leave a nice comment below?
We, at the 9cv9 Research Team, strive to bring the latest and most meaningful data, guides, and statistics to your doorstep.
To get access to top-quality guides, click over to 9cv9 Blog.
To hire top talents using our modern AI-powered recruitment agency, find out more at 9cv9 Modern AI-Powered Recruitment Agency.
People Also Ask
What is food costing software?
Food costing software is a digital tool that helps restaurants calculate ingredient costs, manage recipes, track inventory, and analyze menu profitability. It enables foodservice businesses to control expenses, reduce waste, and make informed pricing decisions.
How big is the global food costing software market in 2026?
The global food costing software market was valued at approximately $1.2 billion in 2024 and is projected to reach $3.4 billion by 2033. With a forecast CAGR of 12.1%, the market continues expanding as restaurants adopt digital cost management solutions.
What is the projected growth rate of the food costing software market?
The global food costing software market is projected to grow at a compound annual growth rate (CAGR) of 12.1% between 2025 and 2033, driven by increasing demand for automated recipe costing, inventory tracking, and cloud-based restaurant management platforms.
Why is food costing software important for restaurants in 2026?
Food costing software helps restaurants manage rising ingredient prices, monitor inventory, reduce food waste, and protect profit margins. With restaurant net profit margins typically ranging from 3% to 5%, accurate food cost management is essential for financial sustainability.
What percentage of restaurant revenue goes toward food costs?
Restaurant food costs typically represent 28% to 35% of total revenue. Quick-service restaurants generally target 25% to 30%, while casual dining establishments average 30% to 34% and fine dining restaurants often operate between 34% and 40%.
What is the average restaurant food cost percentage in 2026?
The dataset reports an average food cost percentage of approximately 32.4% for U.S. full-service restaurants. Actual percentages vary depending on restaurant type, ingredient prices, menu structure, purchasing efficiency, and operational practices.
How does food costing software improve restaurant profitability?
Food costing software improves profitability by identifying expensive ingredients, tracking recipe costs, monitoring food cost variances, and supporting menu pricing decisions. Reducing food costs by one percentage point can save a restaurant generating $2 million annually approximately $20,000.
What are the main features of food costing software?
Common features include recipe costing, ingredient price tracking, inventory management, portion control, supplier management, menu engineering, purchasing automation, food waste monitoring, profitability reporting, and integration with point-of-sale systems.
How much does food costing software cost in 2026?
Entry-level recipe costing software can start at approximately $25 per month, depending on features and pricing structure. More advanced platforms with inventory management, automated purchasing, analytics, and multiple-location support may cost significantly more.
What is the difference between food costing software and recipe costing software?
Food costing software covers broader financial and operational expenses, including inventory, purchasing, and food cost analysis. Recipe costing software focuses specifically on calculating ingredient quantities, portion expenses, and the total cost of preparing individual menu items.
How large is the recipe costing software market?
Research estimates place the global recipe costing software market between $842 million and $1.12 billion in 2024. One forecast projects the market will reach $3.34 billion by 2033, reflecting growing demand for automated recipe management and ingredient cost analysis.
What percentage of food costing software is cloud-based?
Cloud-based platforms account for more than 65% of global food costing software revenue. Restaurants increasingly prefer cloud solutions because they offer remote accessibility, automatic updates, scalable subscriptions, and integration with other restaurant management systems.
What are the benefits of cloud-based food costing software?
Cloud-based food costing software enables real-time ingredient cost monitoring, centralized inventory management, remote access, automated updates, and collaboration across restaurant locations. It also reduces the need for expensive on-premise infrastructure.
How does AI improve food costing software in 2026?
AI-powered food costing software automates supplier invoice processing, forecasts ingredient demand, identifies pricing discrepancies, and analyzes inventory trends. Machine learning also supports menu optimization, purchasing decisions, and food waste reduction.
What percentage of restaurants are adopting AI technology?
Approximately 39% of surveyed restaurant executives report investing in artificial intelligence and machine learning, while another 48% are planning adoption. AI applications increasingly include demand forecasting, inventory optimization, and automated restaurant operations.
Can food costing software reduce restaurant food waste?
Yes. Digital inventory tracking tools can help restaurants reduce food waste by approximately 10% to 15%. Automated stock monitoring, demand forecasting, recipe standardization, and expiration tracking help prevent overordering, spoilage, and unnecessary ingredient losses.
How much food do restaurants waste annually?
Restaurants typically waste between 4% and 10% of purchased food. In the United States, restaurants are estimated to generate approximately 22 billion to 33 billion pounds of food waste annually, creating substantial financial and environmental challenges.
What is the return on investment from food waste reduction?
Research estimates suggest that every $1 invested in food waste reduction initiatives can generate between $7 and $14 in savings. Restaurants benefit through improved purchasing accuracy, reduced spoilage, better portion control, and more efficient inventory management.
How does food costing software help with inventory management?
Food costing software tracks ingredient quantities, purchase prices, stock movements, and inventory consumption. Automated alerts can help restaurants reduce overstocking by approximately 20%, while real-time monitoring supports better purchasing decisions and waste prevention.
What is the restaurant inventory management software market size in 2026?
The global restaurant inventory management and purchasing software market is estimated at $5.26 billion in 2026. Industry forecasts project growth to approximately $12.69 billion by 2032, representing a compound annual growth rate of 15.75%.
What is food cost variance in restaurant management?
Food cost variance measures the difference between theoretical ingredient costs and actual food expenses. Well-managed restaurants typically aim for variance below 2%, while discrepancies exceeding 5% may indicate waste, overportioning, inventory errors, or theft.
How does food costing software support menu engineering?
Food costing software calculates ingredient expenses and profit margins for individual menu items. Restaurants can use this information alongside sales data to identify profitable dishes, adjust menu prices, improve portion sizes, and optimize their product offerings.
What is the ideal prime cost percentage for restaurants?
Restaurant prime cost combines food costs and labor expenses. A commonly cited benchmark is 55% to 65% of total revenue. Maintaining prime costs within an appropriate range helps restaurants protect profitability and manage operational expenses.
What is the average restaurant profit margin in 2026?
Restaurant net profit margins commonly range from 3% to 5%, depending on business model, location, and operating efficiency. Rising ingredient prices, labor expenses, and food waste make accurate food costing and financial monitoring increasingly important.
How does food costing software help control ingredient inflation?
Food costing software monitors supplier prices, updates recipe expenses, and identifies changes in ingredient costs. These capabilities help restaurants adjust menu pricing, compare purchasing options, and maintain profitability during periods of food price inflation.
Can food costing software integrate with POS systems?
Many modern food costing platforms integrate with point-of-sale systems to connect sales transactions with recipe costs and inventory consumption. This integration supports automated stock deductions, menu profitability analysis, and more accurate financial reporting.
What types of businesses use food costing software?
Food costing software is used by restaurants, cafes, bakeries, catering companies, hotels, commercial kitchens, institutional foodservice providers, and food manufacturers. Businesses use these platforms to manage ingredient expenses, inventory, recipes, and profitability.
What are the biggest food costing software trends in 2026?
Major trends include cloud-based deployment, AI-powered demand forecasting, automated invoice processing, real-time inventory tracking, predictive analytics, integrated POS systems, supplier price monitoring, and data-driven menu engineering.
How can small restaurants benefit from food costing software?
Small restaurants can use food costing software to replace manual spreadsheets, calculate accurate recipe costs, monitor ingredient spending, and reduce inventory waste. Affordable cloud subscriptions make digital food cost management increasingly accessible to independent operators.
What is the future of food costing software beyond 2026?
The future of food costing software will likely involve greater AI automation, predictive inventory management, real-time supplier integrations, advanced menu analytics, and unified restaurant technology platforms. These innovations are expected to improve cost accuracy, efficiency, and profitability.