


Key Takeaways
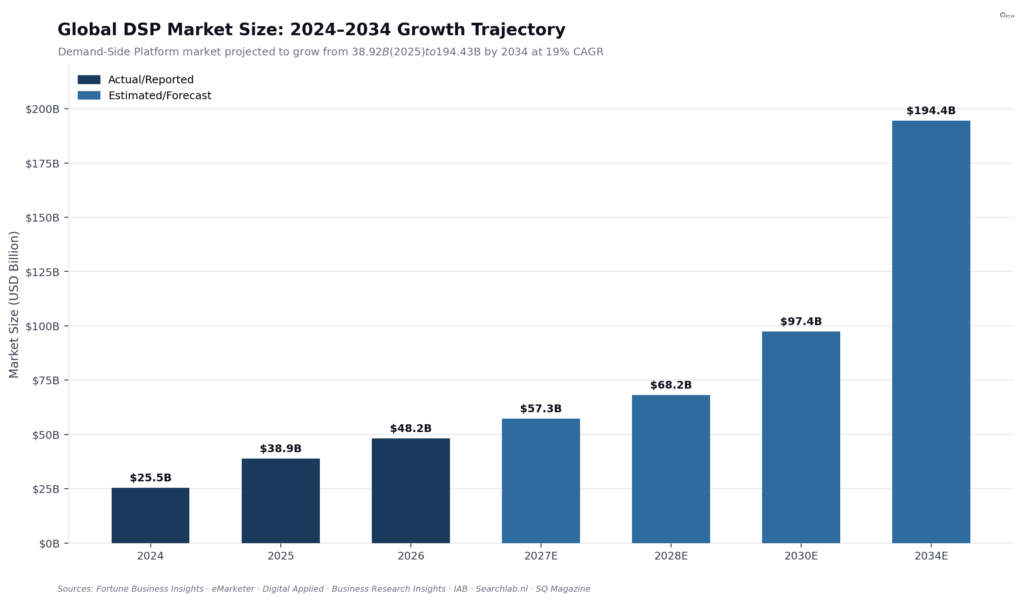
- The global Demand-Side Platform (DSP) market is estimated at $48.19 billion in 2026, with a projected 19% CAGR through 2034, highlighting sustained growth in programmatic advertising technology.
- Programmatic advertising dominates digital media buying in 2026, with $821 billion in global spend and 91.5% of digital display ads transacted programmatically.
- AI, CTV, retail media and first-party data are shaping DSP trends in 2026, as 54% of campaigns use AI-led bid optimization and 72% of advertisers rely primarily on first-party data for programmatic targeting.
Demand-Side Platform (DSP) software powers programmatic advertising in 2026, with the global DSP market estimated at $48.19 billion and programmatic ad spend reaching $821 billion. AI optimization, connected TV, retail media and first-party data are driving adoption as advertisers seek more efficient, automated and measurable digital advertising.
The demand-side platform (DSP) software market is entering a pivotal stage in 2026 as programmatic advertising, artificial intelligence, connected TV (CTV), retail media, and first-party data reshape how advertisers buy and optimize digital media. According to the statistics compiled in this report, one major estimate places the global DSP market at $48.19 billion in 2026, up from $38.92 billion in 2025, with a projected 19% compound annual growth rate through 2034.
Also, read our article on the Top 10 Demand Side Platform (DSP) Software.


The wider programmatic ecosystem is expanding at an even greater scale. Global programmatic advertising spend is estimated to reach $821 billion in 2026, while 91.5% of digital display advertising is expected to be transacted programmatically. Meanwhile, approximately 84% of digital video inventory and 71% of CTV inventory are accessible through programmatic channels, demonstrating how DSP technology is moving beyond traditional display advertising into video, streaming television, retail media, audio, and other emerging formats.
Competition among leading DSP software providers is also intensifying. The dataset estimates that Google Display & Video 360 accounts for 32% of global DSP spend, followed by The Trade Desk at 19% and Amazon DSP at 16%. Amazon DSP’s estimated share has doubled from 8% within three years, highlighting the growing importance of commerce and purchase-intent data in programmatic advertising.


Artificial intelligence, privacy and first-party data are simultaneously changing how these platforms operate. In 2026, 54% of DSP campaigns use AI-led bid optimization, while AI-driven programmatic workflows are associated with revenue uplifts of 20–30% compared with rule-based optimization. At the same time, 72% of advertisers rely on first-party data as their primary programmatic targeting signal, and 64% of brands have increased investment in identity resolution and clean-room solutions.

However, rapid adoption does not eliminate the industry’s challenges. The compiled statistics estimate $84 billion in global ad fraud losses in 2026, while 78% of brands identify brand safety as a major concern when making programmatic buying decisions. These risks are pushing advertisers toward stronger fraud detection, supply-path optimization, private marketplaces and more transparent DSP infrastructure.
This collection of the top 105 Demand-Side Platform (DSP) software statistics, data and trends in 2026 examines the market from multiple angles, including market size and growth, regional adoption, DSP market share, programmatic spending, CTV and retail media, AI-powered optimization, privacy and identity, first-party data, ad fraud, campaign performance and enterprise adoption. Together, these figures provide a data-driven view of where DSP software stands in 2026 and where the programmatic advertising industry may be heading next.
Before we venture further into this article, we would like to share who we are and what we do.
About 9cv9
9cv9 is a business tech startup based in Singapore and Asia, with a strong presence all over the world.
With over ten years of startup and business experience, and being highly involved in connecting with thousands of companies and startups, the 9cv9 team has listed some important and crucial software tools in this review.
If you like to get your company listed in our top B2B software reviews, check out our world-class 9cv9 Media and PR service and pricing plans here.
Top 105 Demand-Side Platform (DSP) Software Statistics, Data & Trends in 2026
🏦 Market Size & Growth
- $48.19 billion — Global DSP market size in 2026, projected to grow to $194.43 billion by 2034 at a 19% CAGR. This sustained trajectory confirms that programmatic infrastructure is now a foundational enterprise technology category, not a niche ad-tech tool.
- $38.92 billion — DSP market value in 2025, establishing a strong baseline for the 24% year-over-year leap into 2026. The near-$10B annual increase signals that budget migration from traditional media is accelerating rather than stabilising.
- $52.55 billion — Alternative 2026 DSP market estimate from Business Research Insights, projecting growth to $382.36 billion by 2035 at a 24.67% CAGR. Variance across estimates reflects differing market scope definitions, but every credible forecast points unanimously upward.
- 31.3% CAGR (2025–2035) — The most bullish DSP growth forecast projects the market hitting $804 billion by 2035. If AI-driven automation and cross-channel convergence play out as modelled, this would make DSP software one of the fastest-growing enterprise SaaS categories in history.
- $133.39 billion — Projected DSP market size by 2031 at a 23% CAGR, per Verified Market Research. Even the most conservative major forecasts see a near-5x market expansion within five years, underscoring the irreversibility of the programmatic shift.
- $12 billion — Conservative DSP systems market estimate for 2026 using a 3.4% CAGR model, focused on mature enterprise segments. This narrow estimate captures only established platform revenue, excluding fast-growing managed-service and self-serve DSP tiers.
- 19% CAGR (2026–2034) — Fortune Business Insights’ projected compound annual growth rate for the global DSP market through 2034. At 19% sustained CAGR, the DSP market will double roughly every four years — a pace that justifies significant platform R&D investment.
- $25.46 billion — DSP market value in 2024, establishing a two-year growth baseline showing a near-doubling in just 24 months to reach $48.19B by 2026. Few enterprise software segments achieve this growth velocity at scale, making DSPs a critical watch category for investors and CMOs alike.
- $46,929.9 million — Projected U.S.-only DSP market value by 2032, reflecting the country’s enduring dominance as the world’s most sophisticated programmatic ad ecosystem. The U.S. market alone will exceed the current entire global DSP market within six years.
- 3.4% CAGR — Slower-growth DSP segment projection from 2026 to 2035, reflecting mature players in large-enterprise managed-service buying. Not all DSP segments are equal — self-serve and AI-native platforms far outpace the legacy managed-service segment.
🌐 Regional Market Distribution
- 38.9% — North America’s share of the global DSP market in 2025, the highest of any region. North America’s lead reflects a decade-long head start in programmatic adoption, sophisticated agency ecosystems, and the highest concentration of major DSP vendors.
- 26.5% — Europe’s share of global DSP revenue in 2025, valued at $10.32 billion. Europe’s growth is constrained by GDPR compliance costs and slower CTV monetisation, yet remains the second-largest and fastest-institutionalising market.
- $12.86 billion — Projected European DSP market value in 2026, growing from $10.32B in 2025. European advertisers are catching up in programmatic sophistication, with France, Germany, and the UK leading adoption velocity.
- $2.96 billion — UK DSP market projected value for 2026, the single largest European DSP sub-market. The UK’s mature agency ecosystem, English-language content premium, and post-Brexit data flexibility make it a disproportionate programmatic contributor.
- $2.53 billion — Germany’s projected DSP market size in 2026, reflecting strong automotive and financial sector adoption. Germany’s industrial base — heavy in automotive, manufacturing, and finance — is driving above-average enterprise DSP uptake.
- 20% — Asia-Pacific’s share of the global DSP market, with China ($13.6B) leading the region. APAC’s 20% share understates its growth potential — rising internet penetration, mobile-first consumer behaviour, and e-commerce dominance are structural tailwinds.
- $13.6 billion — China’s DSP market size in 2025, making it the second-largest national DSP market globally. China’s programmatic ecosystem is largely domestic (Alibaba, Baidu, Tencent), but cross-border DSP players are gaining ground as Chinese brands expand globally.
- 7.6% — Middle East & Africa’s share of global DSP revenue, valued at $2.97 billion in 2025. MEA represents the highest-growth frontier — low current penetration combined with rapidly digitising media markets creates an asymmetric opportunity.
- $3.69 billion — Projected MEA DSP market in 2026, growing from $2.97B — a 24% single-year expansion. The Gulf states, led by Saudi Arabia and UAE, are anchoring MEA’s programmatic growth through mega-infrastructure and gaming/entertainment investment.
- 5.6% — Latin America’s share of global DSP revenue, generating $2.17 billion in 2025, rising to $2.67B in 2026. Brazil and Argentina are the programmatic powerhouses of Latin America, but regulatory fragmentation and currency volatility create operational headwinds.
📡 Programmatic Ecosystem
- $821 billion — Global programmatic advertising spend in 2026, up 9% year-over-year from $755 billion in 2025. The programmatic market has effectively become the entirety of digital display — reaching $821B means the open exchange is no longer a supplement to direct buying; it IS the market.
- 91.5% — Share of all digital display ads transacted programmatically in 2026. With only 8.5% of display remaining direct-sold, programmatic has achieved near-total market saturation in display — future growth must come from new channels like CTV, DOOH, and audio.
- 14.2 trillion — Daily real-time bid requests across major SSPs and exchanges as of Q1 2026, up 11% year-over-year. Processing 14.2 trillion bid requests daily demands extraordinary infrastructure — this volume is the invisible backbone of every digital ad impression served globally.
- $318 billion — U.S. programmatic ad spend in 2026, representing ~89% of all U.S. digital advertising expenditure. The U.S. remains the world’s largest single programmatic market — its $318B represents more than the entire global programmatic market of just five years ago.
- $740 billion — Total global digital advertising spend in 2026, with programmatic commanding 73% of total global media spend. Digital advertising has formally displaced traditional media as the primary global advertising channel, with programmatic as its dominant transaction mechanism.
- 11.4% YoY — Digital ad spend growth rate in 2026, driven by CTV, retail media, and AI search. Double-digit sustained growth at this scale is remarkable — it implies a $75B+ annual increment of new digital ad spend entering the ecosystem.
- 84% — Share of digital video inventory purchased programmatically in 2026. Video’s programmatic maturation means agencies can now plan and execute premium video campaigns at display-like efficiency — collapsing the CPM premium gap between video and display.
- 71% — Share of CTV inventory now accessible programmatically, dramatically up from 45% in 2025. This 58% single-year increase in CTV programmatic access is the most dramatic channel transformation in the 2026 programmatic landscape.
- 85%+ — U.S. digital display ad dollars flowing through programmatic channels in 2025. The U.S. has achieved near-complete programmatic coverage of display — the battleground has shifted to CTV, where the measurement and targeting wars are just beginning.
- $200 billion — Threshold surpassed by global programmatic ad spend, a milestone that validates the channel’s transition from experiment to critical infrastructure. Crossing $200B permanently ended the era of programmatic being treated as a “digital supplement” to traditional media planning.
🖥️ DSP Platform Competitive Landscape
- 32% — Google DV360’s share of global DSP spend, the highest of any single platform. DV360’s dominance is structurally reinforced by YouTube exclusivity and bundled Google ecosystem buying — a competitive moat that rivals cannot replicate without a $300B media network.
- 19% — The Trade Desk’s global DSP spend share, with +34% YoY revenue growth — the strongest growth among large platforms. TTD’s growth outpacing its market share gain signals it is taking the highest-value inventory — premium CTV and retail media — rather than growing through volume alone.
- 16% — Amazon DSP’s estimated market share in 2026, up from 8% just three years ago — a doubling in market share. No other DSP has gained share as rapidly as Amazon — its proprietary purchase-intent data creates a targeting advantage that pure-play ad-tech companies structurally cannot replicate.
- +24% YoY — Amazon DSP’s growth rate, making it the fastest-growing top-five DSP globally. Amazon’s growth is particularly notable because it is occurring simultaneously with major advertising budget consolidation — it is taking share, not just riding market tailwinds.
- 60% — Share of global DSP market controlled by the top platforms combined, creating a concentrated oligopoly. The top-three DSP concentration mirrors the broader digital advertising duopoly dynamic — independent DSPs must specialise to survive in a world where the top platforms control the majority of premium inventory.
- $50,000+/month — Practical minimum spend threshold for cost-effective DV360 use, limiting access to enterprise advertisers. DV360’s high minimum spend creates a clear market segmentation — enterprises get Google’s data advantage; mid-market advertisers need alternative platforms.
- ~20% — The Trade Desk’s typical platform fee as a percentage of media spend, structured for transparency. TTD’s transparent fee model is a deliberate competitive differentiator — in a market plagued by hidden fees, fee clarity is increasingly a procurement criterion.
- 10–15% — DV360’s upper-funnel open-auction fee structure as a percentage of media spend. Google’s layered fee complexity — different rates for open auction, YouTube, and programmatic guaranteed — makes apples-to-apples DSP cost comparison difficult for buyers.
- $300K–$1M/month minimum — The Trade Desk’s typical minimum monthly spend requirement, restricting access to large advertisers. TTD’s high minimums mean that 80%+ of the advertiser universe cannot access the platform directly — driving a large managed-services intermediary market.
- 33–34% — Leading independent DSP’s approximate share of non-Google/Amazon programmatic spend, per fragmented competitive data. The “independent DSP” market outside the Big Three is highly fragmented — no single alternative has achieved platform-level scale, creating risk for buyers relying on non-primary DSPs.
📺 CTV & Emerging Channels
- $36 billion — Global CTV programmatic ad spend in 2026, up 28% YoY from $28 billion in 2025. CTV’s 28% growth in a year when total programmatic grew just 9% confirms it is the structural growth engine of the entire programmatic ecosystem.
- $29.3 billion — U.S.-only programmatic CTV ad spend in 2026, a 34% increase over 2025 levels. The U.S. CTV market alone is now larger than the entire global programmatic market was a decade ago — scale is no longer a barrier to CTV adoption.
- 3.4x — CTV CPM premium over open-web display in 2026, justified by superior engagement metrics. At 3.4x the CPM, CTV is not cheap — but with 95% completion rates versus single-digit engagement on open web, the cost-per-attention calculation often favours CTV.
- 95%+ — Average completion rate for CTV programmatic ads in 2026, versus ~60% for standard video. Unskippable, full-screen CTV ads in premium content environments are fundamentally different from web video — the 95% completion floor redefines what “video delivery” means.
- 92%+ — Average viewability rate for CTV programmatic ads, the highest of any digital channel. CTV’s near-perfect viewability is a direct result of the controlled, TV-like environment — it eliminates the banner blindness and below-the-fold inventory problems that plague web display.
- 50% — Share of CTV/OTT advertising expected to be purchased programmatically in 2026. With half of CTV now programmatic, the channel has crossed the tipping point — the question is no longer whether CTV will be programmatic, but how fast the remaining 50% transitions.
- 70% — Share of CTV advertisers planning to boost spending in 2026. When seven in ten active CTV advertisers plan to increase spend, the channel’s future investment trajectory is effectively locked in — demand is structural, not cyclical.
- +14% YoY — Rise in unique advertisers leveraging programmatic CTV delivery in 2026. New-to-CTV advertisers are entering the channel at an accelerating pace, suggesting the addressable market is still in early-majority adoption rather than saturated.
- $38.7 billion — Global retail media network programmatic spending in 2026, with Amazon accounting for $19.2B. Retail media has matured from an experimental budget line to a core performance channel — at $38.7B, it rivals the entire CTV market in scale.
- +42% YoY — Retail media programmatic growth rate in 2026, the fastest-growing programmatic sub-channel. Retail media’s 42% growth rate far outpaces the broader programmatic market’s 9% — it is absorbing the largest share of incremental programmatic budget in 2026.
- $62 billion — Total retail media ad spend globally in 2026, now the “third wave” of digital advertising. Retail media’s rise mirrors the earlier search and social waves — brands that establish measurement frameworks now will hold a compounding advantage over those who wait.
- +28% YoY — Programmatic audio ad spend growth in 2026, with the channel now at 4–7% of total programmatic budgets. Audio’s 28% growth from a small base is a reliable indicator of an emerging channel that is still early in its monetisation cycle — a potential alpha opportunity for forward-leaning media planners.
- 200%+ — Growth in programmatic audio ad spending since 2020, driven by podcast and streaming audio expansion. Six years of 200%+ cumulative growth confirms that audio is not a trend — it is a structural shift in how consumers engage with content during commutes, workouts, and multitasking.
- +100% — CTV ad spend growth from 2022 to 2024 as measured by programmatic impressions, a doubling in two years. This 100% two-year growth rate establishes CTV as one of the fastest-scaling channels in the history of digital advertising, outpacing mobile’s early-growth trajectory.
- $69.33 billion — U.S. retail media ad spend expected in 2026, underscoring the channel’s role as a top-three digital advertising category. The U.S. retail media market alone is approaching the size of the entire programmatic market of just five years ago, signalling a permanent reallocation of ad budgets.
🤖 AI, Technology & Performance
- 54% — Share of DSP campaigns using AI-led bid optimisation in 2026. With more than half of campaigns now AI-optimised, the burden on human traders to manually tune bids is collapsing — the competitive advantage is shifting to data quality and strategy rather than execution speed.
- 20–30% — Revenue uplift achieved by publishers and advertisers using AI-driven programmatic workflows versus rule-based optimisers. A 20–30% performance premium from AI optimisation is large enough to represent a decisive competitive advantage — teams not adopting AI bidding are systematically overpaying for equivalent outcomes.
- +40% — Stronger conversion efficiency for advertisers combining first-party data activation with real-time contextual AI, per 2026 case studies. The multiplier effect of first-party data plus AI optimisation is not additive — it is compounding, creating a winner-takes-more dynamic in performance programmatic.
- +28% — Higher click-through rate for AI-optimised programmatic ads on average, alongside a 17% better ROI. A 28% CTR lift and 17% ROI improvement are conservative AI performance benchmarks — platforms reporting 40%+ gains are increasingly common in retail and automotive verticals.
- $6.5 billion — Annual advertiser savings from AI-based fraud detection blocking invalid traffic before bids are placed. $6.5B in fraud savings represents the measurable ROI of AI investment in DSP infrastructure — making the case that AI is not a cost centre but a revenue protection mechanism.
- 69% — Cloud-native DSP deployment adoption rate in 2026, enabling faster latency control and multi-region scaling. Cloud-native DSP architecture is becoming the default standard — on-premise deployments are increasingly a liability, creating upgrade urgency for legacy enterprise ad-tech stacks.
- 87% — Share of programmatic publishers globally now using header bidding, with average wrappers carrying 14 SSP partners. Header bidding has become so ubiquitous that it is no longer a differentiator for publishers — the battleground has shifted to server-side implementation quality and latency optimisation.
- 14 SSPs per header bidding wrapper — Average SSP partner count per publisher wrapper in 2026, up from 11 in 2024. The increase from 11 to 14 SSP partners reflects publishers’ relentless yield optimisation — but the law of diminishing returns means further expansion may introduce more latency than revenue.
- 21% — Average floor uplift publishers achieve through header bidding versus waterfall setups. A 21% revenue premium is substantial enough to drive universal publisher adoption — header bidding is now a table-stakes capability rather than a competitive advantage.
- 41% — Latency reduction on mobile web achieved by server-side header bidding via Prebid Server versus client-side implementation. Cutting latency by 41% on mobile has direct consumer experience benefits — faster page loads improve both user retention and ad viewability rates simultaneously.
- 58% — Share of all DSP bid requests originating from mobile devices in 2026. Mobile remains the dominant inventory source for DSPs — any platform strategy that under-indexes on mobile identity and targeting quality is structurally disadvantaged.
- +32% — ROAS improvement from retail media DSP integrations that leverage commerce signals for benchmark targeting. Retail media’s commerce-signal advantage translates directly to measurable ROAS gains — making the case for retail media DSP integration as a performance, not just a reach, strategy.
- 48% — Identity-free targeting deployment rate across large B2B advertisers in 2026. Nearly half of enterprise advertisers have already adopted ID-free targeting approaches — privacy-first is no longer a future-state scenario but an operational present reality.
- +19% — Targeting efficiency improvement from privacy-first ID-free targeting integrations in 2025. Counterintuitively, ID-free targeting is outperforming cookie-based methods in controlled tests — contextual AI signals appear to be capturing user intent more accurately than behavioural tracking.
- 14% — CPM wastage reduction achieved by ID-free targeting integrations, simultaneously improving efficiency while maintaining reach. Reducing CPM waste by 14% while improving targeting accuracy inverts the traditional privacy-performance trade-off narrative — and accelerates the industry’s transition away from tracking.
🔐 Privacy, Identity & First-Party Data
- 72% — Advertisers relying on first-party data as their primary programmatic targeting signal in 2026. The shift from third-party to first-party data is complete as a strategic intent — the gap between ambition and execution capability remains the primary barrier for most advertisers.
- 64% — Brands that increased investment in identity resolution and clean room solutions in 2026. Clean room adoption is accelerating because it is the only privacy-compliant way to combine first-party data across walled gardens — it is becoming the new standard for cross-platform measurement.
- 67% — Advertisers using alternative IDs (UID2, RampID, etc.) to reach non-addressable audiences. Alternative ID adoption at 67% signals that the industry has moved past the “wait and see” phase — two-thirds of advertisers are now operationally committed to post-cookie infrastructure.
- 55%+ — Brand and agency experts highlighting increased first-party data adoption following major privacy shifts. More than half of industry practitioners have fundamentally changed their data strategy — first-party data infrastructure has become a core marketing technology investment, not just an ad-tech consideration.
- 58% — Marketers citing data privacy compliance as the top criterion in choosing programmatic partners. Privacy compliance has surpassed price and reach as the primary DSP selection factor — this represents a fundamental shift in the procurement dynamics of programmatic platform buying.
- 84% — Companies already using or planning to test identity graphs for cross-device matching. With 84% adoption intent, identity graphs are transitioning from emerging technology to standard infrastructure — platforms without native identity graph support will face growing buyer rejection.
- 50%+ — Advertisers actively testing contextual AI tools as a cookieless targeting strategy. Contextual AI has re-emerged as a serious targeting methodology, not just a fallback — in brand-safe environments, it often outperforms behavioural targeting on attention and recall metrics.
- 40–70% — Increase in first-party data usage since cookie deprecation announcements were made public. The cookie deprecation announcement, even without full implementation, permanently altered industry data strategy — advertisers accelerated first-party data investment rather than waiting for formal cookie elimination.
⚠️ Ad Fraud, Brand Safety & Risk
- $84 billion — Estimated global ad fraud losses in 2026, a 15% increase over 2025’s $73 billion. At $84B, ad fraud is now one of the largest financial crimes globally — its growth despite improved detection technologies reflects the increasing sophistication of bot networks and CTV fraud operations.
- 8.7% — SIVT-adjusted fraud rate across programmatic channels in 2026, representing ~$71B in wasted spend. Losing 8.7 cents of every programmatic dollar to sophisticated invalid traffic is a persistent structural failure of open internet advertising — one that private marketplaces and AI detection are slowly addressing.
- 14–18% — Ad fraud rate on open exchanges, versus just 3–5% on Private Marketplace deals. The 3–5x fraud differential between open exchanges and PMPs is the strongest statistical argument for private marketplace prioritisation — brands paying open-exchange CPMs are effectively subsidising fraudulent inventory.
- +110% YoY — Spike in CTV fraud/SIVT violation rates in 2026, driven by bad actors following premium CPM dollars into streaming. CTV’s fraud explosion mirrors what happened in mobile video five years ago — premium CPMs attract sophisticated fraudsters before measurement infrastructure catches up.
- 15% — Share of all programmatic ad spend lost to non-transparent fees in the supply chain. One in six programmatic dollars disappears into non-transparent supply chain fees — SPO (Supply Path Optimisation) has emerged as the primary operational response to recapture this waste.
- 35% — Share of DSP adoption limited by ad fraud concerns in enterprise surveys. Ad fraud anxiety is a significant barrier to DSP budget increases — platforms that can credibly demonstrate sub-5% fraud rates have a measurable sales advantage in enterprise procurement processes.
- $71 billion — Programmatic fraud loss estimate for 2026 on a SIVT-adjusted basis. $71B in annual fraud losses means the programmatic industry effectively has an invisible 8.7% “fraud tax” baked into every open-auction campaign — the ROI case for fraud prevention investment has never been stronger.
- 78% — Brands listing brand safety as a top concern in programmatic buying decisions. Brand safety anxiety has not diminished despite years of industry effort — sophisticated fraudsters and brand-unsafe content continue to appear in programmatic supply chains, keeping brand safety at the top of CMO agendas.
- 35–60% — Fraud exposure reduction achieved by using Private Marketplaces instead of open exchanges. PMP’s fraud reduction benefit is so significant that for brand-safety-sensitive categories (pharma, finance, luxury), the CPM premium of PMP inventory is effectively self-funded through waste elimination.
- 20.64% — Share of ad traffic that was invalid in a dataset of 105.7 billion impressions, putting ~$37B of U.S. programmatic spend at risk. One in five ad impressions being invalid is a staggering finding — it means current ROAS benchmarks are systematically overstated by fraud inflation.
📈 Performance Benchmarks
- 25–45% — Lower CPMs with programmatic compared to direct-buy display, on average. The 25–45% CPM efficiency of programmatic versus direct buying is the foundational economic argument for DSP adoption — it means brands can maintain reach while dramatically reducing media cost.
- 25% — Higher conversion rates for programmatic CTV ads compared to traditional linear TV. CTV’s conversion superiority over linear TV validates the shift of TV budgets toward streaming — it combines television’s reach and brand-building with digital’s measurability and performance.
- +26% — Increase in website return visits from retargeting programmatic ads, a key lower-funnel metric. Retargeting remains one of programmatic’s highest-ROI tactics — a 26% lift in return visits from a cost-efficient channel makes DSP retargeting a near-universal enterprise campaign strategy.
- 0.48% — Average click-through rate for programmatic video ads, significantly higher than display benchmarks. A 0.48% video CTR outperforms display’s 0.05–0.12% range by 4–10x, reinforcing video’s growing share of programmatic budget allocation.
- 8.8x — Higher CTR for programmatic native ads compared to standard display ads. Native ads’ 8.8x CTR advantage is a compelling performance case that explains why native programmatic budgets are growing faster than standard display — the format works because it doesn’t feel like advertising.
- 12% — Lower cost-per-lead for lead generation campaigns using programmatic versus paid search. When programmatic delivers leads 12% cheaper than search, it challenges the assumption that search always wins on efficiency for lead generation — DSP retargeting and contextual targeting can outperform.
- 3x — Higher video completion rates for social programmatic campaigns compared to open-web video. Social programmatic’s 3x completion advantage reinforces why brands are allocating growing shares of programmatic video budgets to social channels rather than open-exchange video inventory.
- 15% — Increase in ROAS for campaigns using frequency capping across multiple DSPs simultaneously. Cross-DSP frequency management is an under-utilised optimisation lever — the 15% ROAS lift from frequency control represents pure efficiency gain with no additional media spend.
- 40% — Average increase in publisher yields achieved through header bidding adoption versus waterfall setups. A 40% yield increase is the single most important statistic driving universal publisher header bidding adoption — it transformed the supply side of programmatic as profoundly as RTB transformed the demand side.
- 3.2% — Mobile interstitial programmatic engagement rate — the highest of any programmatic ad format. Mobile interstitials’ 3.2% engagement rate reflects the format’s unavoidable, full-screen nature — but frequency management is critical as overexposure quickly converts engagement into brand irritation.
🏢 Industry Adoption & Segmentation
- 64% — Enterprise advertisers managing at least one DSP in-house in 2026, up from 41% in 2023. The 23-percentage-point swing toward in-housing in just three years signals a structural shift — brands are internalising programmatic expertise rather than outsourcing it, fundamentally changing the agency relationship.
- 31% — Enterprise campaigns now activated through retail media-linked DSP integrations. Retail media’s 31% share of enterprise campaign activation is remarkable given the channel barely existed five years ago — its penetration reflects how powerful commerce-signal targeting has proven in driving measurable ROI.
- $12B by 2026 — DSP systems market projection, confirming “significant market momentum” and “increasing value placed on data-driven programmatic advertising.” The consensus $12B DSP systems estimate validates that the platform layer of programmatic — not just media spend — has become a billion-dollar enterprise software category.
- 25% — Projected growth of the Programmatic Premium Buying (PPB) segment, the fastest-growing DSP transaction segment. PPB’s rapid growth reflects a maturation of the market — buyers are willing to pay CPM premiums for guaranteed, brand-safe, viewable inventory as performance standards rise.
- $12.95 billion — U.S. DSP system market size in 2025, by far the single largest national sub-market for DSP platforms. The U.S. market’s $12.95B DSP system spend dwarfs the next largest national market, reflecting the country’s structural advantages in programmatic infrastructure, talent, and innovation density.
- 85%+ — Share of digital display ads now transacted programmatically globally as of 2025 (industry consensus). This figure has become the benchmark that signals “mission accomplished” for the first programmatic era — the next growth phase must come from new formats, not display penetration increases.
- $46.89 billion — Projected CTV advertising spend by 2028, the year CTV will surpass traditional TV spending entirely. When CTV overtakes linear TV ad spend in 2028, it will represent the most dramatic power shift in the history of television advertising — an event that makes 2026 DSP investment decisions enormously consequential.
Conclusion
The top 105 Demand-Side Platform (DSP) software statistics, data and trends in 2026 reveal an advertising technology market that is becoming larger, more automated and increasingly central to digital media buying. One major estimate places the global DSP market at $48.19 billion in 2026, with a projected 19% CAGR through 2034, while other forecasts point to even faster long-term expansion.
Programmatic advertising has already reached extraordinary scale. Global programmatic ad spend is estimated at $821 billion in 2026, while 91.5% of digital display ads are transacted programmatically. Growth is increasingly shifting beyond conventional display advertising, with 84% of digital video inventory and 71% of CTV inventory now accessible through programmatic channels.
CTV and retail media stand out as important growth engines. Global programmatic CTV spending is estimated at $36 billion in 2026, growing 28% year over year, while retail media network programmatic spending reaches $38.7 billion and is growing at 42%. These trends indicate that DSP software is evolving into a broader cross-channel infrastructure layer connecting advertisers with streaming television, commerce environments, audio, video, mobile and traditional open-web inventory.
Artificial intelligence is accelerating this transformation. 54% of DSP campaigns use AI-led bid optimization, while the compiled data associates AI-driven programmatic workflows with 20–30% revenue uplift compared with rule-based optimization. At the same time, privacy is reshaping targeting strategies: 72% of advertisers rely on first-party data as their primary programmatic targeting signal, while 67% use alternative identity solutions.
The opportunity nevertheless comes with substantial risks. Estimated global ad fraud losses reach $84 billion in 2026, open exchanges show higher reported fraud exposure than private marketplaces, and 78% of brands identify brand safety as a leading concern. DSP providers will therefore need to compete not only on reach and campaign performance, but also on transparency, fraud prevention, privacy compliance, inventory quality and measurement.
Overall, the 2026 DSP software statistics point toward a market moving from traditional automated media buying toward intelligent, data-driven and increasingly omnichannel advertising infrastructure. AI optimization, CTV, retail media, first-party data and privacy-first targeting are emerging as defining forces, while advertisers are bringing more programmatic capabilities in-house. With 64% of enterprise advertisers managing at least one DSP internally in 2026, demand-side platforms are becoming an increasingly strategic part of the modern advertising technology stack.
If you find this article useful, why not share it with your hiring manager and C-level suite friends and also leave a nice comment below?
We, at the 9cv9 Research Team, strive to bring the latest and most meaningful data, guides, and statistics to your doorstep.
To get access to top-quality guides, click over to 9cv9 Blog.
To hire top talents using our modern AI-powered recruitment agency, find out more at 9cv9 Modern AI-Powered Recruitment Agency.
People Also Ask
What is Demand-Side Platform (DSP) software?
Demand-Side Platform software enables advertisers to buy, manage and optimize digital advertising inventory programmatically across display, video, mobile, CTV and other channels.
How big is the global DSP market in 2026?
The global DSP market is estimated at $48.19 billion in 2026, up from $38.92 billion in 2025, according to one major market estimate.
How fast is the DSP software market growing?
One forecast projects the global DSP market to grow at a 19% CAGR from 2026 through 2034, potentially reaching $194.43 billion.
How much will advertisers spend on programmatic advertising in 2026?
Global programmatic advertising spend is estimated to reach $821 billion in 2026, representing approximately 9% year-over-year growth.
What percentage of digital display ads are programmatic in 2026?
Approximately 91.5% of digital display advertising is estimated to be transacted programmatically in 2026, indicating that automated media buying now dominates display advertising.
Which DSP has the largest market share in 2026?
The compiled data estimates Google Display & Video 360 at 32% of global DSP spend, ahead of The Trade Desk at 19% and Amazon DSP at 16%.
What is Google DV360’s DSP market share in 2026?
Google Display & Video 360 is estimated to account for 32% of global DSP spend, making it the largest individual platform in the dataset.
What is The Trade Desk’s market share in 2026?
The Trade Desk is estimated to account for 19% of global DSP spend, with the dataset also reporting 34% year-over-year revenue growth.
What is Amazon DSP’s market share in 2026?
Amazon DSP is estimated to hold 16% of the DSP market in 2026, compared with 8% three years earlier, reflecting rapid growth in commerce-driven programmatic advertising.
How important is AI in DSP software in 2026?
AI is becoming central to DSP optimization, with 54% of campaigns using AI-led bid optimization in 2026 according to the compiled statistics.
How does AI improve programmatic advertising performance?
The dataset associates AI-driven programmatic workflows with 20–30% revenue uplift compared with rule-based optimization, while AI-optimized ads show higher CTR and ROI in reported benchmarks.
How large is programmatic CTV advertising in 2026?
Global programmatic CTV ad spend is estimated at $36 billion in 2026, representing 28% year-over-year growth from approximately $28 billion in 2025.
What percentage of CTV inventory is available programmatically?
The dataset estimates that 71% of CTV inventory is accessible programmatically in 2026, compared with 45% in 2025.
How effective are programmatic CTV ads?
Programmatic CTV ads have an average completion rate above 95% and an estimated viewability rate above 92%, among the strongest engagement benchmarks in digital advertising.
How fast is retail media programmatic advertising growing?
Retail media programmatic spending is estimated to grow 42% year over year in 2026, making it one of the fastest-growing programmatic advertising channels.
How much is spent on retail media programmatically in 2026?
Global retail media network programmatic spending is estimated at $38.7 billion in 2026, with Amazon accounting for approximately $19.2 billion.
How important is first-party data to DSP advertising in 2026?
First-party data is a major targeting resource, with 72% of advertisers relying on it as their primary programmatic targeting signal in 2026.
Are advertisers adopting alternative IDs for programmatic advertising?
Yes. The dataset reports that 67% of advertisers use alternative IDs such as UID2 and RampID as the programmatic ecosystem adapts to changing privacy requirements.
How important is privacy when choosing DSP software?
Privacy is a major DSP selection factor in 2026, with 58% of marketers citing data privacy compliance as their top criterion when choosing programmatic partners.
How common are identity graphs in programmatic advertising?
According to the dataset, 84% of companies are already using or planning to test identity graphs for cross-device matching and audience identification.
How large is ad fraud in 2026?
Global ad fraud losses are estimated at $84 billion in 2026, representing a 15% increase from the estimated $73 billion recorded in 2025.
What is the programmatic advertising fraud rate in 2026?
The dataset reports an 8.7% SIVT-adjusted fraud rate across programmatic channels in 2026, corresponding to approximately $71 billion in wasted advertising spend.
Are private marketplaces safer than open programmatic exchanges?
The statistics report fraud rates of 14–18% on open exchanges versus 3–5% for private marketplace deals, suggesting significantly lower fraud exposure through PMPs.
How important is brand safety in programmatic advertising?
Brand safety remains a major concern, with 78% of brands listing it among their top considerations when making programmatic advertising buying decisions.
Can DSP advertising reduce CPMs?
The compiled benchmarks indicate that programmatic advertising can produce CPMs approximately 25–45% lower than direct-buy display advertising on average.
Does programmatic advertising improve conversion rates?
The dataset reports that programmatic CTV advertising can generate 25% higher conversion rates than traditional linear TV, although performance varies by campaign and audience.
What is the average CTR for programmatic video advertising?
The compiled statistics place the average click-through rate for programmatic video ads at approximately 0.48%, above the cited 0.05–0.12% range for display advertising.
Are enterprises bringing DSP management in-house?
Yes. Approximately 64% of enterprise advertisers manage at least one DSP in-house in 2026, up from 41% in 2023.
Which trends are shaping DSP software in 2026?
Key DSP trends include AI-led bidding, CTV, retail media, first-party data, identity solutions, contextual targeting, cloud-native infrastructure, privacy compliance and programmatic in-housing.
What is the future outlook for Demand-Side Platform software?
DSP software is positioned for continued expansion as programmatic buying spreads across CTV, retail media, audio and other channels while AI and first-party data increasingly shape campaign optimization and targeting.
Sources
Fortune Business Insights Business Research Insights Market Report Analytics Valuates Reports Market Reports World Verified Market Research Digital Applied Search Lab NL Marketing LTB SQ Magazine Amra & Elma Apprupt WiFi Talents Xapads Blog Improvado Media Planning Tool Segwise Capterra




%20software%20statistics%20for%202026,%20covering%20market%20growth,%20AI,%20CTV,%20ad%20spend%20and%20key%20trends.)