

Key Takeaways
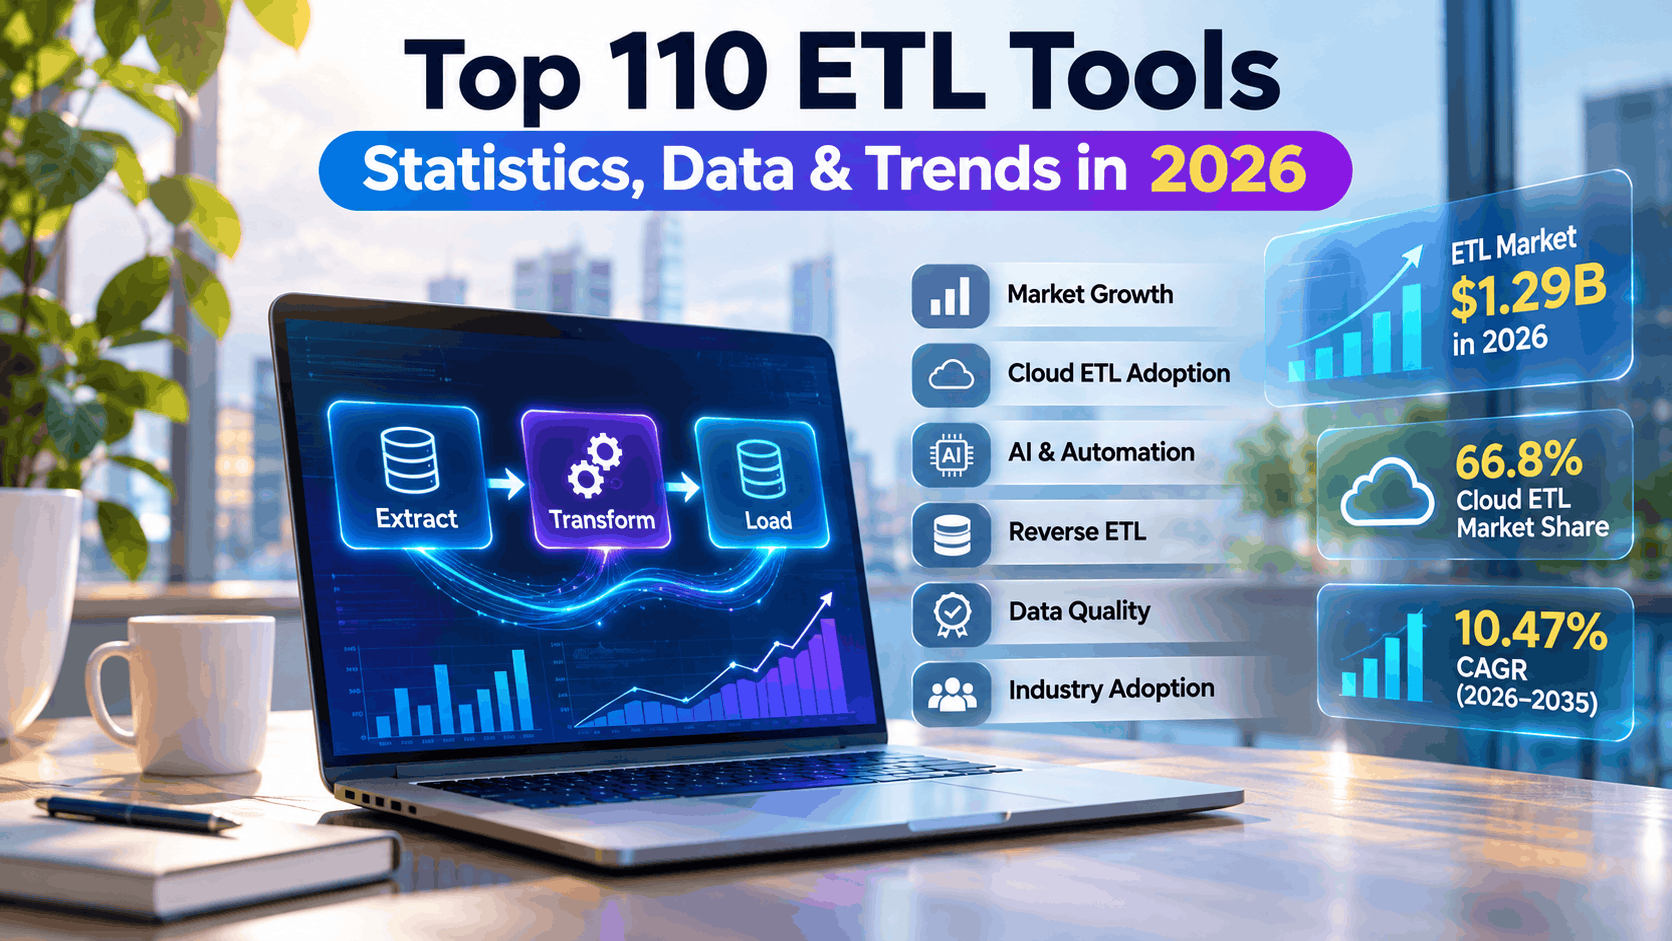
- ETL Tools Market Growth: The global ETL tools market is estimated at $1.29 billion in 2026 and projected to reach $3.16 billion by 2035, growing at a 10.47% CAGR.
- Cloud ETL and AI Automation Adoption: Cloud-based ETL solutions account for an estimated 66.8% market share, while AI-powered data mapping, low-code ETL platforms, and real-time data pipelines are transforming enterprise data integration.
- Data Quality and Future ETL Trends: Poor data quality costs organizations an estimated $12.9 million annually, driving demand for automated ETL workflows, reverse ETL, cloud-native data integration, and scalable data management solutions.
ETL tools are essential for modern data integration, with the global ETL tools market estimated at $1.29 billion in 2026 and projected to reach $3.16 billion by 2035. These 110 ETL tools statistics reveal key trends in cloud adoption, AI automation, real-time data pipelines, data quality, and enterprise software growth.
The global demand for ETL (Extract, Transform, Load) tools is accelerating in 2026 as businesses increasingly rely on data integration, cloud computing, artificial intelligence (AI), and real-time analytics to drive digital transformation. With organizations managing unprecedented volumes of structured and unstructured data, ETL software has become an essential component of modern data infrastructure, enabling businesses to extract information from multiple sources, transform it into usable formats, and load it into data warehouses, databases, and analytics platforms.
Also, read our article on the Top 10 Extract, Transform and Load (ETL) Software.

According to industry estimates, the global ETL tools market is valued at approximately $1.29 billion in 2026 and is projected to reach $3.16 billion by 2035, representing a compound annual growth rate (CAGR) of 10.47%. Other market research estimates place the broader ETL software market at over $10 billion in 2026, highlighting differences in market definitions and the expanding scope of enterprise data integration technologies. Meanwhile, cloud-based ETL solutions are estimated to account for approximately 66.8% of the market, reflecting the growing preference for scalable, flexible, and cost-efficient data processing infrastructure.
The rise of AI-powered ETL tools, automated data pipelines, low-code integration platforms, and cloud-native data architectures is transforming how organizations manage their data. Industry estimates suggest that 67% of organizations are implementing AI-based data mapping, while 63% are adopting low-code ETL solutions to simplify complex integration workflows. Additionally, approximately 70% of organizations are prioritizing real-time data pipelines, demonstrating the shift from traditional batch processing toward faster, more responsive data integration capabilities.


Data quality and integration challenges are also driving investment in ETL technologies. Research cited in industry analyses estimates that poor data quality costs organizations an average of $12.9 million annually, while only 29% of enterprise applications are effectively integrated. These challenges underscore the importance of reliable ETL platforms for eliminating data silos, improving data accuracy, automating repetitive processes, and supporting data-driven decision-making.
Beyond technological advancements, ETL adoption continues to expand across industries such as banking, financial services, healthcare, retail, manufacturing, and telecommunications. Large enterprises are estimated to account for 62.7% of the ETL tools market, while small and medium-sized enterprises represent a rapidly growing segment, with projected annual growth of 18.7%. Regionally, North America remains the largest market, while Asia-Pacific is emerging as a major growth engine for data integration software.
This comprehensive guide to the Top 110 ETL Tools Statistics, Data & Trends in 2026 explores the latest market size estimates, ETL software adoption rates, cloud ETL trends, AI-driven data integration, reverse ETL developments, data quality challenges, workforce statistics, regional growth patterns, and competitive dynamics among leading ETL software providers.
Whether you are a data engineer, IT professional, business analyst, technology executive, or enterprise decision-maker, these 110 ETL statistics provide valuable insights into the evolving data integration landscape, helping organizations understand emerging opportunities, evaluate ETL technologies, and prepare for the future of enterprise data management in 2026 and beyond.
Before we venture further into this article, we would like to share who we are and what we do.
About 9cv9
9cv9 is a business tech startup based in Singapore and Asia, with a strong presence all over the world.
With over ten years of startup and business experience, and being highly involved in connecting with thousands of companies and startups, the 9cv9 team has listed some of the top and best companies/tools in this review.
If you like to get your company listed in our top B2B software reviews, check out our world-class 9cv9 Media and PR service and pricing plans here.
Top 110 ETL Tools Statistics, Data & Trends in 2026
Market Size & Growth
- $1.29 billion — The global ETL tools market is estimated at USD 1,289.92 million in 2026, reflecting steady enterprise investment in data integration infrastructure.
- $3.16 billion by 2035 — ETL tools spending is projected to reach USD 3,161.51 million by 2035 at a 10.47% CAGR, signaling sustained long-term demand for data pipeline software.
- 10.47% CAGR (2026–2035) — The ETL tools market’s compound annual growth rate underscores its role as a foundational layer of modern data architecture.
- 16.01% CAGR through 2029 — A separate market estimate places ETL tools growth at over 16% annually, driven by exploding data volumes across enterprises.
- $6.7 billion (2026), 13% CAGR to 2032 — Traditional ETL platforms alone are valued at $6.7 billion in 2026, proving that classic batch-style integration still commands major budget share despite newer ELT alternatives.
- $8.85 billion (2026) to $18.60 billion (2030) — Another market sizing model shows the ETL segment more than doubling within four years, reflecting accelerating digital transformation spend.
- $10.24 billion (2026) to $21.25 billion (2031), 15.72% CAGR — A broader ETL software market estimate confirms near-15% compound growth, making ETL one of the fastest-expanding enterprise software categories.
- $16.2 billion (2024) to $29.4 billion by 2033 — Longer-horizon forecasts value the ETL tools market at over $16 billion as of 2024, nearly doubling by the early 2030s.
- $5.75 billion (2025) to $6.71 billion (2026), 16.8% CAGR — Year-over-year ETL software growth of nearly 17% highlights how quickly organizations are scaling their data pipelines.
- Data pipeline tools market: $12.1 billion, 26% CAGR through 2030 — Data pipeline tooling (which includes ETL) is growing at almost double the rate of the broader data integration market.
- Data integration market: $14.33B–$19.21B (2026) — Depending on scope definition, the wider data integration market — which encompasses ETL — ranges between $14.33 billion and $19.21 billion in 2026.
- $30–33 billion data integration market by 2030 — Analysts expect the broader data integration space to roughly double by the end of the decade.
- 13.6% CAGR for data integration (2026–2030) — MarketsandMarkets projects the data integration ecosystem to compound at 13.6% annually, propelled by AI-driven automation needs.
- 39.46% — ETL’s share of the data pipeline tools market — ETL remains the single largest component of the broader data pipeline tooling category, even as newer patterns emerge.
- ETL Software Global Market Report: 14.1% CAGR to $11.39B by 2030 — A separate forecast pegs ETL software at $11.39 billion by 2030, fueled by AI/ML integration and hybrid cloud demand.
Cloud Deployment & Architecture
- 66.8% — Cloud ETL market share in 2026 — Roughly two-thirds of all ETL deployments now run on cloud infrastructure rather than on-premises servers.
- 60–65% cloud ETL share (2025–2026) — Multiple analysts converge on cloud deployments capturing 60–65% of the ETL market, confirming the decisive shift away from legacy on-prem tooling.
- Two-thirds of total ETL deployments are cloud-based — Organizations increasingly prioritize scalability and reduced infrastructure overhead by choosing cloud-native ETL platforms.
- 89% — Organizations adopting multi-cloud strategies — Nearly nine in ten enterprises now run multi-cloud environments, increasing the complexity ETL tools must manage.
- 69% — US organizations using cloud-native ETL solutions — Over two-thirds of American businesses have moved to cloud-native ETL to manage distributed workloads.
- 72% — US enterprises using cloud-based data architectures — Cloud-first data infrastructure has become the default standard for the majority of large US companies.
- 82% — Global enterprises adopting hybrid data architectures — The vast majority of enterprises now blend cloud and on-premises systems, requiring ETL tools with hybrid compatibility.
- 65% — Businesses adopting tools with multi-cloud compatibility — Nearly two in three ETL buyers now require multi-cloud support as a baseline procurement criterion.
- 63% — Cloud users citing ETL compatibility as a top vendor-selection factor — ETL integration capability has become a decisive criterion when choosing a cloud platform.
- 70% — Organizations prioritizing real-time data pipelines — A clear majority of businesses now demand near-instant data movement rather than traditional overnight batch jobs.
AI & Automation in ETL
- 61% — Analytics environments adopting AI-driven data orchestration — Over six in ten data environments now incorporate AI to automate orchestration tasks within ETL workflows.
- 67% — Organizations implementing AI-based data mapping — Automated schema and field mapping powered by AI is becoming the norm rather than the exception.
- 63% — Organizations adopting low-code ETL tools — A majority of businesses now favor visual, low-code ETL platforms to reduce engineering bottlenecks.
- 55% — Organizations shifting toward serverless ETL architectures — More than half of enterprises are moving toward serverless ETL to cut infrastructure management overhead.
- 59% — Enterprises accelerating AI investment over the past 24 months — Investment in AI-enabled data tooling has surged across the majority of organizations in just two years.
- 78% — Organizations using AI in at least one business function (2026) — Nearly four in five companies now apply AI somewhere in their operations, frequently touching data pipelines.
- 42% — Organizations that have actively deployed AI (vs. piloting) — Less than half of enterprises have moved past pilot stage into full AI deployment, leaving room for further ETL automation growth.
- 55% — Reduction in manual processing errors from automated ETL workflows — Automating ETL pipelines cuts manual data-handling errors by more than half on average.
- 47% — Data latency reduction from ETL modernization across large-scale systems — Modernized ETL pipelines nearly cut data latency in half compared to legacy batch systems.
- 68% — Enterprise data pipelines relying on automated ETL workflows — Over two-thirds of enterprise data movement is now handled by automated, rather than manually scripted, pipelines.
- 74% — Organizations using ETL tools for cloud migration and real-time analytics — The majority of ETL adoption is now directly tied to cloud migration and real-time analytics initiatives.
- 79% — IT departments prioritizing ETL modernization for multi-cloud support — Nearly four in five IT leaders rank ETL modernization as a top infrastructure priority.
- 96% — Data quality improvement reported from AI integration in pipelines — Organizations applying AI to data quality monitoring report near-complete improvement in accuracy outcomes.
- 80% — Data professionals using AI tools daily (up from 30%) — Daily AI usage among data professionals has nearly tripled in a short span, reshaping how ETL pipelines are built and maintained.
- $2.5 million — Average GenAI budget allocation — Organizations are committing multimillion-dollar budgets specifically to generative AI initiatives tied to data infrastructure.
Reverse ETL & Data Activation
- $12.1 billion — Data pipeline tools market including reverse ETL (2026) — Reverse ETL has become significant enough to be tracked as part of the broader $12.1 billion data pipeline tooling category.
- 26% CAGR — Reverse ETL and data pipeline tools growth through 2030 — Reverse ETL is growing nearly twice as fast as the broader data integration market.
- $48.3 billion projected reverse ETL/data pipeline market by 2030 — The reverse ETL segment is expected to roughly quadruple within the decade.
- 68% — Enterprise data sitting idle without activation — More than two-thirds of enterprise data remains unused for operational decision-making, the core problem reverse ETL aims to solve.
- $675 million — Standalone reverse ETL market size (2026) — Reverse ETL as a dedicated software category is valued at $675 million, separate from broader data pipeline tooling.
- $1.055 billion (2025) to $1.555 billion by 2032 — Reverse ETL software — Another vendor-tracking estimate shows reverse ETL software growing at a 5.7% CAGR.
- 15–30% — CAC reduction reported from reverse ETL adoption — Companies activating warehouse data into sales and marketing tools report meaningful reductions in customer acquisition cost.
- 25–45% — Higher conversion rates from reverse ETL-driven personalization — Activating warehouse data into customer-facing tools drives a substantial lift in conversion performance.
- 90%+ — Long-term success rate of reverse ETL implementations — The overwhelming majority of reverse ETL deployments are considered successful by the teams that implement them.
- 3 months — Typical time to positive ROI for reverse ETL — Organizations report breakeven on reverse ETL investment within a single quarter on average.
- AWS 32%, Azure 23%, GCP 10% — Cloud platform share in reverse ETL implementations — AWS remains the dominant cloud backend for reverse ETL deployments, followed by Azure and Google Cloud.
Data Quality & Cost of Poor Data
- $12.9 million — Average annual cost of poor data quality per organization — Gartner research shows bad data quality costs the typical organization nearly $13 million every year.
- $12.9–$15 million — Range of annual poor data quality costs — Estimates of the financial toll of poor data quality span $12.9–$15 million annually depending on organization size and industry.
- 25%+ of organizations lose more than $5 million/year to bad data — A quarter of enterprises face losses exceeding $5 million annually purely from data quality issues.
- 15–25% — Revenue lost annually due to poor data quality — MIT Sloan research found companies lose between 15% and 25% of total revenue because of unreliable data.
- 27% — Employee time spent correcting bad data — Workers spend more than a quarter of their working hours fixing data errors instead of producing value-adding work.
- 897 — Average number of applications used by an enterprise — The typical large organization juggles nearly 900 separate software applications that ETL tools must connect.
- 29% — Enterprise applications that are actually integrated — Less than a third of enterprise apps are properly connected, leaving the majority isolated in data silos.
- 71% — Enterprise apps left disconnected — The vast majority of enterprise software remains siloed, a key driver of ETL and integration tool demand.
- 53% — Enterprises citing integration complexity as a major restraint — More than half of organizations report complexity as the biggest barrier to effective ETL deployment.
- 49% — Enterprises reporting legacy system incompatibility — Nearly half of businesses struggle to connect modern ETL tools with aging legacy infrastructure.
- 61% — Organizations with legacy systems facing ETL integration difficulty — A majority of companies running legacy infrastructure report meaningful friction when adopting modern ETL platforms.
- 85–95% — Accuracy of modern deduplication algorithms in ETL pipelines — Today’s automated deduplication tools achieve near-95% accuracy in identifying true duplicate records.
- $6 billion (2026) to $12.5 billion by 2028 — Data deduplication tools market — The market for deduplication technology used within ETL pipelines is set to roughly double in just two years.
Big Data Volume & Infrastructure
- 221 zettabytes — Global data volume projected for 2026 — The world is expected to generate 221 zettabytes of data in 2026, intensifying the need for scalable ETL infrastructure.
- 22% year-over-year increase in global data creation — Annual data generation continues growing by more than a fifth, outpacing most organizations’ ability to process it manually.
- 0.4 ZB (≈402.7 million TB) of data generated daily — Roughly 400 million terabytes of new data are created across the globe every single day.
- 3.81 petabytes of data generated every second — At a per-second level, global data creation now exceeds 3.8 petabytes, a volume few legacy ETL systems can ingest in real time.
- 90% of global data is unstructured — The overwhelming majority of data organizations must process today is unstructured, demanding more flexible ETL transformation logic.
- 70% of all data is user-generated — Most of the world’s data originates from individual users rather than systems, adding variability that ETL pipelines must normalize.
- 97% — Businesses that have invested in big data initiatives — Nearly all surveyed enterprises report some level of investment in big data capabilities, of which ETL is a core enabler.
- $348.21 billion — Big data analytics market valuation — The big data analytics market, closely intertwined with ETL tooling, now exceeds $348 billion globally.
- 13.0% CAGR — Big data analytics market growth, reaching $924.39 billion by 2032 — Big data analytics is expected to nearly triple by the early 2030s.
- 149–181 zettabytes — Global datasphere range (2024–2025) — Independent estimates place the 2024–2025 global datasphere between 149 and 181 zettabytes, varying by methodology.
- 19+ billion — Active IoT devices contributing to data growth — Billions of connected devices continuously stream telemetry data that modern ETL pipelines must capture and process.
- 60% — Corporate data now stored in the cloud — A majority of enterprise data now resides in cloud storage rather than on-premises systems.
- 76% — Video’s share of global mobile data traffic — Video content alone accounts for roughly three-quarters of mobile data traffic, a major driver of unstructured data volume.
Workforce, Salaries & Talent
- $133,484 — Average annual US data engineer salary (2026) — The typical data engineer in the United States earns just over $133,000 per year as of mid-2026.
- $104,682–$171,980 — Typical US data engineer salary range (25th–75th percentile) — Most data engineers earn between roughly $105,000 and $172,000 annually depending on experience and location.
- $214,677 — 90th percentile data engineer salary — Top-earning data engineers in the US can command upward of $214,000 annually.
- $131,000–$151,000 — Average base pay for big data engineers (2026) — Specialized big data engineers earn a premium over general data engineering roles.
- $160,000–$215,000 — Senior data engineer base salary range (2026) — Senior-level data engineering talent commands six-figure base salaries well into the $200,000 range.
- $93,397 — Average salary for data engineers with 1–4 years of experience — Early-career data engineers earn under $100,000 on average before significant salary growth kicks in.
- $127,578–$134,082 — Average salary for data engineers with 10+ years of experience — Seasoned data engineering professionals see compensation climb significantly with tenure.
- 150,000+ — Data engineering professionals currently employed in the field — The data engineering profession now employs well over 150,000 people, with 20,000+ new roles added in the past year alone.
- 8% projected job growth for data-related occupations by 2032 — The US Bureau of Labor Statistics classifies data engineering-adjacent roles among the fastest-growing job categories.
- 29% — Snowflake’s appearance rate in data engineering job postings — Snowflake skills now appear in roughly three in ten data engineering job listings, reflecting its rise as a preferred ETL/ELT target warehouse.
- 17% — Databricks’ appearance rate in data engineering job postings — Databricks has rapidly climbed to feature in about one in six data engineering job postings.
Industry & Regional Adoption
- 87% — Fortune 1000 companies deploying ETL platforms (US) — Nearly nine in ten of America’s largest corporations have ETL platforms embedded in their data infrastructure.
- 73% — US enterprises implementing data pipeline automation — Roughly three-quarters of American businesses have automated their data pipeline operations.
- 64% — Financial institutions relying on ETL for regulatory reporting and fraud detection — A majority of banks and financial firms depend on ETL systems to meet compliance and fraud-prevention requirements.
- 28% — ETL market revenue contributed by the financial services sector — Financial services represents over a quarter of total ETL market revenue, the largest single-industry contributor.
- 58% — Healthcare adoption rate for clinical data integration via ETL — Just over half of healthcare organizations have adopted ETL systems for clinical data integration despite regulatory complexity.
- 20% — Annual growth in healthcare ETL adoption — Healthcare’s ETL adoption is expanding by a fifth each year even amid HIPAA-driven implementation hurdles.
- 71% — Retail enterprises using ETL for customer analytics and supply chain optimization — Retailers represent one of the heaviest-adopting sectors for ETL-driven analytics and logistics optimization.
- 62.7% — Large enterprise share of the ETL tools market — Large enterprises still account for the majority share of ETL spending, though smaller businesses are catching up fast.
- 18.7% CAGR — SME segment growth rate in the ETL market — Small and medium enterprises are now the fastest-growing customer segment in ETL, outpacing large enterprise growth.
- 17.3% CAGR — Asia-Pacific ETL market growth (to 2030) — The Asia-Pacific region is expanding its ETL footprint faster than any other geography, led by China and India.
- 38% — North America’s share of global ETL demand — North America remains the single largest regional market for ETL tools, representing over a third of global demand.
- 29% — Asia-Pacific’s share of global ETL demand — Asia-Pacific has grown into the second-largest regional ETL market, just behind North America.
- 24% — Europe’s share of global ETL demand — Europe accounts for roughly a quarter of global ETL tool demand, driven heavily by GDPR-related data governance needs.
Vendor Landscape & Competitive Dynamics
- Informatica — Leader in Gartner’s Magic Quadrant for the 11th consecutive year — Informatica has held the top “Ability to Execute” position in Gartner’s ETL/data integration rankings for eleven straight years.
- Microsoft Fabric — Leader for the 4th consecutive year — Microsoft has maintained Magic Quadrant leadership status with Fabric for four years running.
- IBM — 19 consecutive years as a Magic Quadrant Leader — IBM’s data integration tools have held Leader status in Gartner’s rankings for nearly two decades.
- AWS — Newly promoted to Leader quadrant (from Challenger) — Amazon Web Services has moved up from Challenger to Leader status in the latest Gartner evaluation, reflecting growing enterprise trust in its data integration stack.
- 93% — G2 users likely to recommend Databricks for ETL workflows — An overwhelming majority of verified Databricks users say they would recommend the platform for ETL-driven data engineering.
- 32% — ETL deployments led by top-tier vendors — Roughly a third of all ETL implementations are run on major branded platforms rather than niche or open-source alternatives.
- 27% — ETL deployments using open-source tools — Over a quarter of organizations rely on open-source ETL frameworks, reflecting continued demand for cost-flexible alternatives.
- 22% — Hybrid ETL solution deployments — Nearly a quarter of ETL implementations combine multiple platforms or deployment models rather than a single vendor solution.
- 19% — Niche cloud-native ETL platform deployments — Specialized, cloud-native ETL vendors now account for close to a fifth of total deployments, indicating room for challenger brands.
Conclusion
The Top 110 ETL Tools Statistics, Data & Trends in 2026 highlight the growing importance of Extract, Transform, Load (ETL) technologies in modern enterprise data management. As organizations generate and process increasingly large volumes of information, ETL software has become essential for integrating disparate data sources, improving data quality, automating workflows, and enabling faster, more accurate business intelligence and analytics.
The global ETL tools market continues to demonstrate strong growth potential, with one industry estimate valuing the market at $1.29 billion in 2026 and projecting it to reach $3.16 billion by 2035, representing a compound annual growth rate (CAGR) of 10.47%. Broader ETL software market forecasts suggest even greater market opportunities, reflecting differences in market coverage and the increasing demand for enterprise data integration solutions. These projections reinforce the strategic importance of ETL technologies as businesses modernize their data infrastructure and accelerate digital transformation initiatives.
One of the most significant ETL tools trends in 2026 is the transition toward cloud-native data integration, AI-powered automation, and real-time data processing. With cloud-based ETL solutions estimated to represent approximately 66.8% of the market, organizations are increasingly adopting scalable platforms that reduce infrastructure complexity and support distributed data environments. Meanwhile, the growing adoption of AI-driven data mapping, low-code ETL platforms, and automated data pipelines is helping businesses streamline data engineering operations and improve operational efficiency.
Data quality remains another critical driver of ETL software adoption. With poor data quality estimated to cost organizations an average of $12.9 million annually and a substantial proportion of enterprise applications remaining disconnected, businesses face increasing pressure to eliminate data silos and improve information reliability. Modern ETL platforms address these challenges through automated data validation, transformation, deduplication, and integration capabilities, enabling organizations to make more informed decisions based on consistent and trustworthy information.
The emergence of reverse ETL, real-time data integration, and AI-enhanced data orchestration is also reshaping the competitive landscape. Rather than focusing exclusively on transferring information into centralized data warehouses, businesses are increasingly exploring ways to activate existing data across customer relationship management systems, marketing platforms, operational applications, and other business-critical environments. These developments demonstrate how ETL technologies are evolving from traditional data processing utilities into strategic components of enterprise digital infrastructure.
From an industry perspective, financial services, healthcare, retail, and other data-intensive sectors continue to drive demand for sophisticated ETL solutions. Large enterprises remain major contributors to market revenue, while small and medium-sized businesses represent an increasingly important growth opportunity. Geographically, North America maintains a leading position, while Asia-Pacific is projected to experience particularly strong growth as cloud adoption, digital transformation, and enterprise analytics investments expand.
Looking ahead, the future of ETL tools beyond 2026 will likely be shaped by greater integration of artificial intelligence, machine learning, serverless computing, hybrid cloud architectures, and automated data governance. Organizations that invest in flexible, secure, and scalable ETL platforms will be better positioned to manage expanding data ecosystems, reduce integration complexity, and support increasingly sophisticated analytics and AI applications.
Ultimately, these 110 ETL tools statistics, data points, and industry trends for 2026 demonstrate that effective data integration is no longer simply a technical requirement but a fundamental business capability. For data engineers, IT leaders, technology providers, and enterprise decision-makers, understanding the evolving ETL software market is essential for evaluating technology investments, improving data infrastructure, and maintaining competitiveness in an increasingly data-driven global economy.
As businesses continue to prioritize automation, cloud modernization, and real-time intelligence, ETL tools will remain a critical foundation for transforming fragmented enterprise data into reliable, actionable insights and sustainable business value.
If you find this article useful, why not share it with your hiring manager and C-level suite friends and also leave a nice comment below?
We, at the 9cv9 Research Team, strive to bring the latest and most meaningful data, guides, and statistics to your doorstep.
To get access to top-quality guides, click over to 9cv9 Blog.
To hire top talents using our modern AI-powered recruitment agency, find out more at 9cv9 Modern AI-Powered Recruitment Agency.
People Also Ask
What are ETL tools, and why are they important in 2026?
ETL (Extract, Transform, Load) tools extract data from multiple sources, transform it into usable formats, and load it into databases or data warehouses. In 2026, they support cloud computing, AI analytics, business intelligence, and enterprise data integration.
What is the global ETL tools market size in 2026?
The global ETL tools market is estimated at approximately $1.29 billion in 2026, according to one market forecast. Broader ETL software market estimates exceed $10 billion, reflecting differences in market definitions and coverage.
How fast is the ETL tools market growing in 2026?
The ETL tools market is projected to grow at a compound annual growth rate (CAGR) of 10.47% between 2026 and 2035. Other industry forecasts estimate annual growth rates between 14% and 16%, depending on market scope.
What is the projected ETL tools market size by 2035?
The global ETL tools market is forecast to reach approximately $3.16 billion by 2035, up from $1.29 billion in 2026. This projection represents a 10.47% CAGR, driven by cloud adoption, AI automation, and enterprise data integration demand.
What percentage of ETL tools are cloud-based in 2026?
Cloud-based ETL solutions account for an estimated 66.8% of the global ETL tools market in 2026. Organizations increasingly prefer cloud ETL platforms for scalability, flexible deployment, lower infrastructure overhead, and real-time data processing.
What are the biggest ETL tools trends in 2026?
Major ETL trends in 2026 include AI-powered data integration, cloud-native ETL platforms, automated data pipelines, low-code ETL development, real-time processing, reverse ETL, serverless computing, and improved data governance.
How is artificial intelligence transforming ETL tools in 2026?
AI is transforming ETL software through automated data mapping, anomaly detection, intelligent transformations, and workflow optimization. Industry estimates suggest 67% of organizations are implementing AI-based data mapping technologies.
What percentage of organizations use AI-powered ETL automation?
Industry estimates indicate that 61% of analytics environments incorporate AI-driven data orchestration, while 67% of organizations implement AI-based data mapping. These figures highlight increasing interest in intelligent data integration.
What is the difference between ETL and ELT in 2026?
ETL transforms data before loading it into a destination system, while ELT (Extract, Load, Transform) loads raw data first and performs transformations afterward. ELT is common in cloud data warehouses, while ETL remains important for controlled data processing.
What is reverse ETL, and why is it growing in 2026?
Reverse ETL transfers processed data from data warehouses into operational applications such as CRM, sales, and marketing platforms. It helps businesses activate customer information, improve personalization, and support data-driven workflows.
What is the reverse ETL market size in 2026?
The standalone reverse ETL market is estimated at approximately $675 million in 2026. Demand is supported by businesses seeking to activate warehouse data across customer engagement, marketing automation, and operational systems.
How much does poor data quality cost businesses annually?
Research cited in industry analyses estimates that poor data quality costs organizations an average of $12.9 million annually. Data errors, disconnected systems, and inconsistent information can increase operational expenses and reduce decision-making accuracy.
How do ETL tools improve enterprise data quality?
ETL tools improve data quality by cleaning, validating, standardizing, transforming, and deduplicating information. Automated ETL workflows help reduce manual processing errors and improve consistency across databases, analytics systems, and business applications.
What percentage of enterprise applications are integrated in 2026?
Industry estimates suggest that only 29% of enterprise applications are integrated, leaving approximately 71% disconnected. This integration gap creates demand for ETL software that connects fragmented applications and eliminates enterprise data silos.
How many applications does the average enterprise use?
The average enterprise uses approximately 897 software applications, according to the industry data compiled for 2026. Managing information across these systems creates significant demand for automated ETL pipelines and enterprise integration platforms.
What percentage of organizations prioritize real-time data pipelines?
Approximately 70% of organizations prioritize real-time data pipelines, according to industry estimates. This reflects growing demand for faster data processing, operational analytics, automated decision-making, and near-instant information availability.
What are the benefits of automated ETL pipelines?
Automated ETL pipelines reduce manual processing, improve data consistency, accelerate information delivery, and support scalable analytics. The compiled industry statistics suggest automation can reduce manual data-processing errors by approximately 55%.
How popular are low-code ETL tools in 2026?
Approximately 63% of organizations are estimated to adopt low-code ETL tools. These platforms provide visual interfaces, reusable connectors, and automated workflows that simplify data integration and reduce dependence on manual programming.
What is the adoption rate of serverless ETL architectures in 2026?
Industry estimates suggest 55% of organizations are shifting toward serverless ETL architectures. Serverless platforms reduce infrastructure management requirements and allow businesses to scale data processing resources according to workload demand.
How much data is generated globally in 2026?
Global data creation is projected to reach approximately 221 zettabytes in 2026. This expanding volume of structured and unstructured information increases demand for scalable ETL platforms, cloud storage, and automated data processing.
Which industries use ETL tools the most in 2026?
Financial services, healthcare, retail, manufacturing, and telecommunications are major ETL software users. Financial services is estimated to contribute approximately 28% of ETL market revenue, reflecting extensive regulatory and analytics requirements.
What percentage of financial institutions use ETL tools?
Approximately 64% of financial institutions are estimated to rely on ETL technologies for regulatory reporting, fraud detection, risk management, and financial analytics. ETL platforms help consolidate information from multiple banking and financial systems.
How widely are ETL tools adopted in healthcare?
Healthcare ETL adoption for clinical data integration is estimated at 58%, with annual adoption growth of approximately 20%. Healthcare organizations use ETL software to integrate patient records, clinical systems, and operational information.
What is the ETL tools market share of large enterprises?
Large enterprises account for an estimated 62.7% of the global ETL tools market. Their demand is driven by complex IT infrastructure, large data volumes, regulatory requirements, and the need to integrate numerous business applications.
How fast is ETL software adoption growing among small businesses?
The small and medium-sized enterprise segment is projected to grow at approximately 18.7% annually. Affordable cloud ETL platforms, low-code integration tools, and automated data pipelines are making enterprise-grade data integration more accessible.
Which region has the largest ETL tools market share in 2026?
North America leads the global ETL tools market with an estimated 38% share. Asia-Pacific follows with approximately 29%, while Europe accounts for around 24%, reflecting regional differences in enterprise technology investment.
How fast is the Asia-Pacific ETL tools market growing?
The Asia-Pacific ETL tools market is projected to grow at approximately 17.3% annually through 2030. Cloud migration, digital transformation, enterprise analytics adoption, and expanding technology investments support regional demand.
What is the average data engineer salary in 2026?
The average annual salary for a data engineer in the United States is estimated at $133,484 in 2026. Compensation varies by experience, technical specialization, location, and expertise in ETL platforms, cloud infrastructure, and data engineering.
Which companies are leading the ETL tools market in 2026?
Major ETL and data integration technology providers include Informatica, Microsoft, IBM, AWS, Databricks, and Snowflake. These companies offer enterprise data integration, cloud analytics, data transformation, and pipeline management capabilities.
What is the future of ETL tools beyond 2026?
The future of ETL tools will be shaped by AI-powered automation, real-time data integration, cloud-native architectures, reverse ETL, and improved data governance. Businesses are expected to prioritize scalable, secure, and intelligent data integration platforms.
Sources
- Integrate.io
- Mordor Intelligence
- MarketsandMarkets
- Grand View Research
- KingPin Market Research
- Cognitive Market Research
- Global Growth Insights
- Business Research Insights
- Verified Market Reports
- GII Research
- The Business Research Company
- G2
- Peliqan
- Glassdoor
- PayScale
- Indeed
- Coursera
- KORE1
- 365 Data Science
- Motion Recruitment
- Recruiting from Scratch
- DemandSage
- Statista
- TheBestVPN
- Rivery
- DesignRush
- Studio Network Solutions


