
Key Takeaways
- Croatia’s Labour Market Shows Strong Employment Growth: Croatia’s unemployment rate declined to 4.9% in Q2 2025, while GDP growth is projected at 2.9% in 2026, creating new recruitment opportunities despite persistent skills shortages.
- Rising Salaries and Labour Shortages Reshape Recruitment Trends: Croatia’s average monthly net salary reached €1,527 in February 2026, while demand for skilled workers in construction, tourism, healthcare, manufacturing, and IT continues to intensify hiring competition.
- Foreign Workers and Demographic Changes Drive Croatia’s Hiring Future: Croatia issued 206,529 residence and work permits in 2024, highlighting its growing reliance on international recruitment as population ageing, emigration, and workforce shortages reshape hiring strategies in 2026.
Croatia’s recruitment market in 2026 reflects declining unemployment, rising salaries, persistent labour shortages, and growing demand for foreign workers. With unemployment at 4.9% in Q2 2025 and average monthly net salaries reaching €1,527 in February 2026, explore 103 recruitment statistics covering hiring trends, employment opportunities, workforce challenges, and future labour market projections.
Croatia’s recruitment landscape is undergoing a significant transformation in 2026, driven by declining unemployment, rising salaries, persistent labour shortages, demographic challenges, and increasing reliance on foreign workers. As the country continues to strengthen its position within the European Union, employers, recruiters, HR professionals, and job seekers must adapt to a rapidly evolving labour market shaped by economic growth, technological advancements, and changing workforce expectations.
Also, read some of our top articles here:
Top 10 Best Recruitment Agencies in Croatia

According to recent labour market statistics, Croatia’s unemployment rate declined to 4.9% in the second quarter of 2025, marking a remarkable recovery from its peak of 17.5% in 2013. Meanwhile, the country’s employment rate reached 68.8%, reflecting sustained improvements in job creation and workforce participation. With real GDP growth projected at 2.9% in 2026, Croatia’s economic outlook remains positive, although businesses continue to face significant challenges in attracting and retaining qualified employees.
One of the most notable recruitment trends in Croatia in 2026 is the growing competition for skilled talent. Industries such as construction, tourism, hospitality, information technology, manufacturing, and healthcare are experiencing persistent workforce shortages. According to World Bank estimates, Croatia could require more than 300,000 additional workers by 2035 to support its green and digital economic transformation. These challenges are further intensified by an ageing population, continued emigration, and a shrinking domestic working-age population.

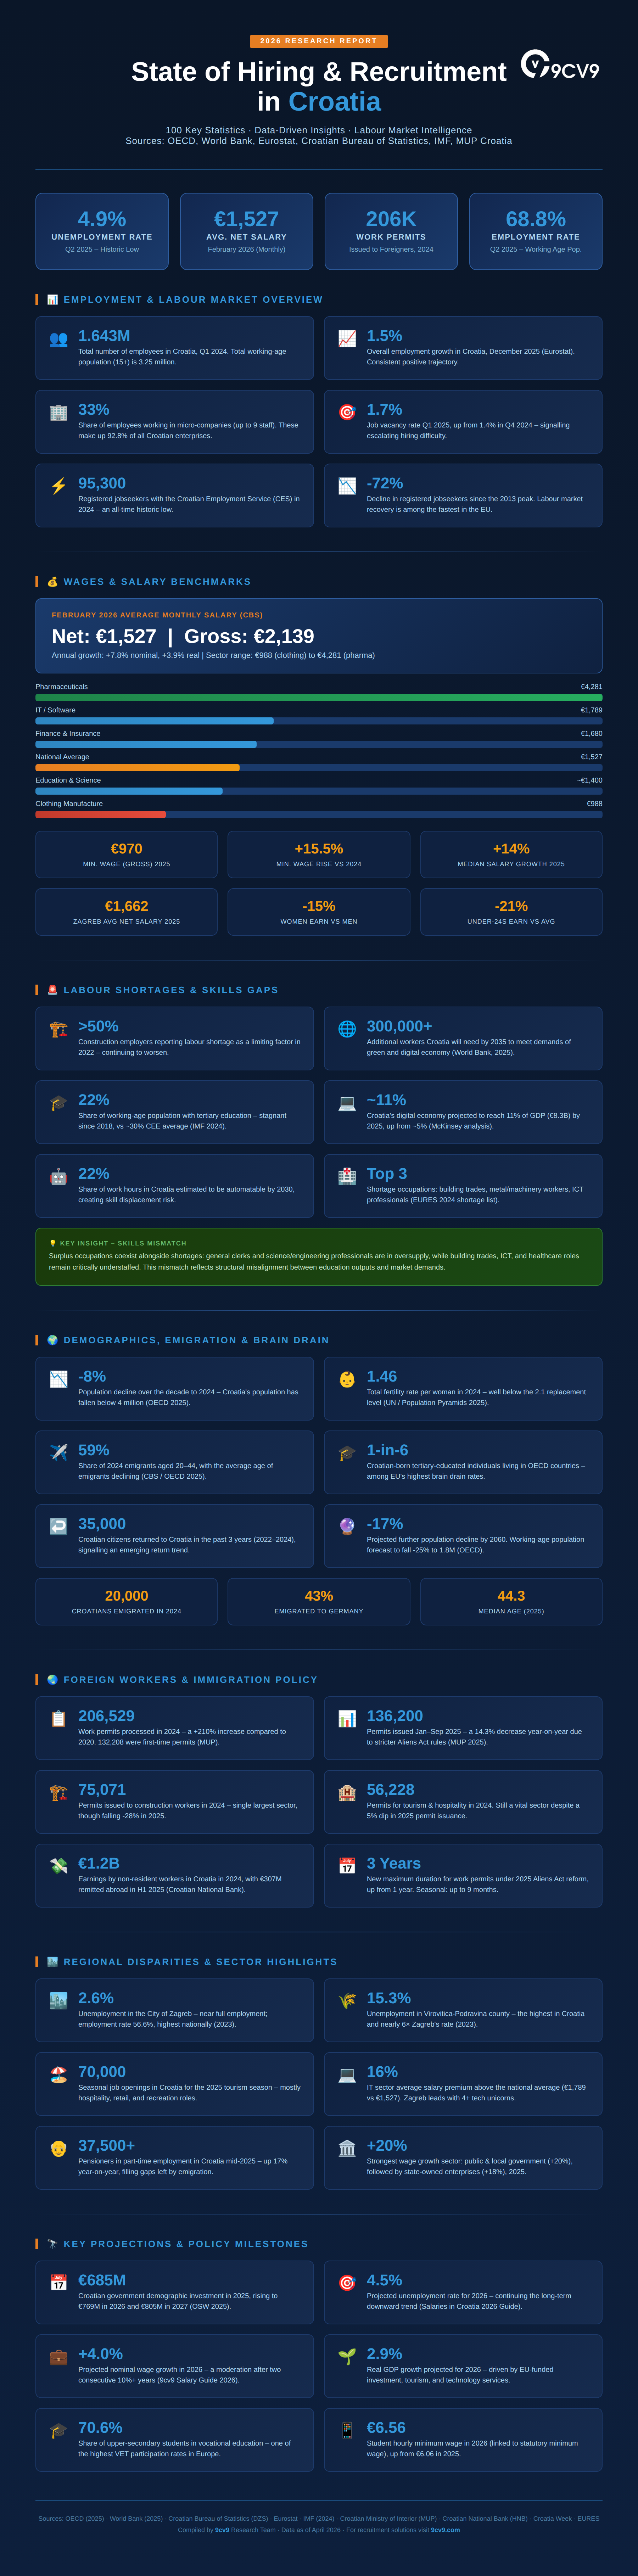
Salary growth is another important factor influencing Croatia’s hiring market. The average monthly net salary reached €1,527 in February 2026, while the average gross salary stood at €2,139. Rising wages are reshaping employer compensation strategies, particularly in competitive sectors such as technology, pharmaceuticals, and professional services. At the same time, regional salary disparities and differences in employment opportunities continue to influence talent mobility across the country.
Foreign labour recruitment has also become increasingly important to Croatia’s economic development. In 2024, the country issued 206,529 residence and work permits, highlighting its growing dependence on international talent. Workers from Bosnia and Herzegovina, Nepal, Serbia, India, and the Philippines have become important contributors to Croatia’s workforce. Recent immigration policy reforms, including extended work permit validity and stronger employer compliance requirements, are changing how businesses recruit and manage international employees.
Beyond traditional recruitment challenges, Croatia’s labour market is being reshaped by digital transformation, artificial intelligence, automation, and evolving workforce skills. Employers are increasingly prioritising technical expertise, digital competencies, employee retention, and workforce development to remain competitive. Meanwhile, demographic pressures and regional employment disparities are encouraging businesses to explore alternative recruitment strategies, including international hiring, vocational training, and the re-engagement of older workers.
Understanding these developments is essential for organisations seeking to build effective hiring strategies, optimise recruitment costs, improve employee retention, and identify emerging talent opportunities in Croatia.
In this comprehensive guide, we explore the Top 103 Recruitment Statistics, Data & Trends in Croatia in 2026, covering employment and unemployment rates, salary benchmarks, labour shortages, foreign worker recruitment, demographic shifts, regional workforce differences, industry-specific hiring trends, and future employment projections.
Whether you are an employer planning workforce expansion, a recruitment agency sourcing qualified candidates, an HR professional developing talent acquisition strategies, or a job seeker exploring career opportunities, these Croatia recruitment statistics for 2026 provide valuable insights into the country’s evolving employment landscape and the key trends shaping its future.
Before we venture further into this article, we would like to share who we are and what we do.
About 9cv9
9cv9 is a business tech startup based in Singapore and in Asia, with a strong presence all over the world.
With over ten years of startup and business experience, and being highly involved in connecting with thousands of companies and startups, the 9cv9 team has access to some of the best talents in the world.
If your company needs recruitment and headhunting services to hire top-quality employees, you can use 9cv9 headhunting and recruitment services to hire top talents and candidates. Email us at hello@9cv9.com.
Top 103 Recruitment Statistics, Data & Trends in Croatia in 2026
📊 MACROECONOMIC & LABOUR MARKET FOUNDATIONS
1. Croatia’s unemployment rate stood at 4.9% in Q2 2025, its lowest level ever recorded — down from a devastating 17.5% peak in 2013, representing one of the most remarkable labour market recoveries in the EU.
2. The employment rate reached 68.8% in Q2 2025, rising over 15 percentage points since the 2013 crisis, though still lagging Hungary (74.9%), Slovenia (72.5%), and the OECD average of 70.5%.
3. More than 1.643 million people were employed in Croatia in Q1 2024, out of a working-age population (aged 15+) of approximately 3.25 million.
4. Croatia’s labour force exceeded 1.7 million active participants in 2023, reflecting a gradual but sustained increase in labour market participation driven by economic recovery.
5. Real GDP growth was approximately 3.8% in 2024, continuing a strong post-pandemic recovery trend driven by EU funds, tourism, and domestic consumption.
6. GDP growth is projected at 3.2% for 2025 and 2.9% for 2026, indicating a gradual deceleration toward sustainable, medium-term growth after years of overperformance.
7. Croatia’s GDP per capita was €17,400 in 2022, representing 50.8% of the EU27 average of €35,400 — a gap that has narrowed significantly given the 35% GDP per capita increase between 2018 and 2022.
8. Overall employment growth in Croatia was 1.5% in December 2025 (Eurostat), sustaining the positive momentum that has characterized the post-2013 recovery period.
9. The number of registered jobseekers at the Croatian Employment Service (CES) fell to an all-time low of 95,300 in 2024, down a staggering 72% from the peak reached in 2013.
10. The job vacancy rate climbed to 1.70% in Q1 2025, up from 1.40% in Q4 2024, confirming accelerating recruitment difficulty across multiple sectors.
💰 WAGES, SALARIES & COMPENSATION
11. The average monthly net salary in Croatia reached €1,527 in February 2026, according to the Croatian Bureau of Statistics (DZS), up 7.8% nominally and 3.9% in real terms year-on-year.
12. The average monthly gross salary stood at €2,139 in February 2026, representing a 1.2% nominal increase from January 2026 and an 8.9% rise compared to February 2025.
13. In 2025, the average monthly net salary including bonuses reached €1,538, a significant 14% increase compared to the previous year (MojaPlaća / Alma Career Croatia).
14. The median salary in 2025 stood at €1,430, meaning more than half of Croatian workers earn below the national average — though the average-median gap is now at its narrowest in five years.
15. In Q4 2025, the average wage rose further to €1,578 net, with the median reaching €1,483, confirming sustained upward pressure on pay across the economy.
16. The gross minimum wage in Croatia rose to €970 per month from January 2025, a 15.5% increase versus 2024 and representing approximately 50% of the average gross wage.
17. Approximately 51,000 Croatian workers earn the minimum wage, which after taxes leaves a net income of approximately €760 per month.
18. Over the past five years, Croatia’s minimum wage has grown by €431, from roughly €539 to €970 gross — one of the fastest minimum wage growth rates among Central and Eastern European (CEE) nations.
19. The IT sector leads salary rankings with an average of €1,789 net per month, approximately 16% above the national average, according to MojaPlaća 2025 data.
20. The highest recorded average net salary by sector in February 2026 was in pharmaceutical manufacturing at €4,281, while the lowest was clothing manufacturing at €988.
21. Zagreb records the highest average net salary among all regions at €1,662 in 2025, while several eastern counties average below €1,300, reflecting deep geographic wage inequality.
22. Men earn on average 15% more than women nationally (MojaPlaća 2025), with the gender pay gap improving slowly from 12.4% (MojaPlaća survey) to 11.06% depending on methodology.
23. Workers under age 24 earn on average 21% less than the national average, creating a significant earnings penalty for new labour market entrants.
24. Nominal wage growth in Croatia averaged 10.0% in 2024 and 10.1% in 2025, before a projected moderation to 4.0% in 2026, reflecting normalization after post-pandemic catch-up.
25. Gross average earnings in Croatia increased by 36.3% between 2018 and 2023, more than double the EU27 average increase of 19.8% over the same period.
26. Net wages increased by 34.6% between 2018 and 2023 in Croatia, compared to a 22.1% increase in the EU27 average — confirming Croatia’s fast-convergence trajectory.
27. The gross average earnings of a single person stood at €1,476 in 2023, compared to the EU27 average of €3,417 — a wage gap of €1,941 per month.
28. The student hourly minimum wage rises to €6.56 in 2026, up from €6.06 in 2025, directly linked to the statutory minimum wage — important for tourism and retail seasonal employers.
29. The strongest wage growth in 2025 occurred in public and local government (+20%) and state-owned enterprises (+18%), though the highest absolute salaries remain in private foreign-owned firms.
30. Education and science remain among the lowest-paid sectors, with wages approximately 8% below the national average, creating a recruitment challenge for public institutions.
🚨 LABOUR SHORTAGES & SKILLS GAPS
31. More than half of construction sector employers reported labour shortage as a limiting factor in 2022, with the situation worsening as post-earthquake Zagreb reconstruction winds down (OECD 2025).
32. Croatia will need more than 300,000 additional workers by 2035 to meet demands of the green and digital economy, according to the World Bank (April 2025).
33. By 2050, the proportion of elderly above 65 could reach 30% of the population, creating a structural long-term compression of the workforce (World Bank 2025).
34. Approximately 22% of work hours in Croatia are estimated to be automatable by 2030 (McKinsey analysis), posing a major reskilling challenge for the predominantly lower-skilled workforce.
35. The share of the working-age population with tertiary education has stagnated at around 22% since 2018, compared to a CEE average that has grown to approximately 30% (IMF 2024).
36. In 2023, 70.6% of Croatian upper-secondary students were enrolled in vocational education, one of the highest VET participation rates in Europe — though curriculum alignment with labour market needs remains a challenge.
37. The top three shortage occupations in 2024 were building and related trades workers, metal and machinery workers, and ICT professionals (EURES Croatia 2024 Shortage Occupations list).
38. Surplus occupations include general and keyboard clerks, science and engineering professionals, and business and administration roles — reflecting a structural mismatch between graduate supply and market demand.
39. Croatia’s digital economy accounted for approximately 5% of GDP (~€2.4B) historically and is projected to reach 11% (€8.3B) by 2025 — placing ICT recruitment at the very centre of economic strategy.
40. Approximately 54% of current work time in Croatia consists of repetitive activities highly susceptible to automation (McKinsey Future of Work analysis), signalling an urgent need for large-scale reskilling.
41. A new adult learning voucher system launched in April 2022 allows workers to access training through accredited institutions, with the CES administering applications digitally via mobile app — a critical tool against skill shortages.
42. By 2030, an estimated 240,000 new jobs could be created through macro-economic trends and policy measures, which would offset automation-related job losses — but only if skills development keeps pace.
👥 DEMOGRAPHICS, POPULATION & EMIGRATION
43. Croatia’s population has declined by approximately 8% over the decade to 2024, falling below 4 million inhabitants for the first time since independence — from a peak of 4.4 million.
44. Croatia’s population is projected to shrink by a further 17% by 2060, reaching approximately 3.1 million, one of the steepest projected declines among OECD countries.
45. The working-age population (aged 15–64) is forecast to fall by -25% between 2025 and 2060, dropping from 2.4 million to 1.8 million (OECD 2025).
46. Croatia’s total fertility rate was 1.46 children per woman in 2024, well below the 2.1 replacement level, contributing to long-term workforce contraction.
47. The median age of Croatia’s population reached 44.3 years in 2025, up from 31.7 in 1960 — making Croatia one of Europe’s most rapidly ageing nations.
48. Among emigrants in 2024, 59% were aged 20–44, with the average age of emigrants declining year-on-year, meaning Croatia is losing its most economically productive cohort (CBS / OECD 2025).
49. More than 1-in-6 of all Croatian-born tertiary-educated individuals currently reside in OECD countries — one of the highest brain drain rates in the European Union (OECD estimate 2025).
50. In 2023, emigration of Croatians to OECD countries decreased by 15%, to approximately 30,000, signalling a potential inflection in the emigration cycle (OECD International Migration Outlook 2025).
51. Of Croatians emigrating to OECD countries in 2023, approximately 43% went to Germany, 27% to Austria, and 9% to Switzerland — reflecting established Croatian diaspora communities in the DACH region.
52. Approximately 35,000 Croatian citizens returned to Croatia over the past three years (2022–2024), a promising trend though emigration still outnumbers returns.
53. In 2024, approximately 20,000 Croatians emigrated, down significantly from the 2022 apex — if this trend continues, returns may soon outnumber departures (Croatia Week, April 2026).
54. In 2024, total immigration to Croatia was 70,391 persons while emigration was 38,997, yielding a positive net migration of +31,394 — the first consistent positive net migration in over 15 years.
55. The Croatian government plans demographic investment of €685M in 2025, €769M in 2026, and €805M in 2027, targeting parenthood support, depopulated area revitalization, and diaspora return (OSW 2025).
56. Key demographic incentives include doubling the one-off birth grant from €309 to €618, extending paternity leave from 10 to 20 days, and raising the parental allowance ceiling to €3,000.
57. The “Choose Croatia” return subsidy (2022) attracted fewer than 500 applicants against an expected 4,500 — illustrating the difficulty of reversing deep emigration trends through financial incentives alone.
58. Croatia’s population has declined by 16% since 1990, losing approximately 760,000 people due to the war of independence, sustained emigration, and persistently low birth rates.
🌏 FOREIGN WORKERS & IMMIGRATION POLICY
59. Croatia processed 206,529 work permits in 2024, a 20% increase from 2023 and a stunning 210% increase compared to 2020 — reflecting a structural shift toward a more immigration-dependent labour market.
60. In 2024, authorities received 286,000 applications for residence and work permits, a 22% increase from the previous year, overwhelming the administrative system (Croatia Week Feb 2025).
61. Of the 206,529 permits in 2024, 132,208 were new permits, approximately 57,000 were renewals, and 17,500 were for seasonal workers — primarily in tourism and hospitality.
62. As of 31 January 2025, 113,504 foreign nationals held active work permits in Croatia, mostly in construction, tourism, industry, transport, and trade.
63. The top source country for work permits in 2024 was Bosnia and Herzegovina (38,100), followed by Nepal (35,635), Serbia (28,000), India (20,000), and the Philippines (14,600).
64. The share of work permits issued to Asian workers (Nepal, Bangladesh, India, Philippines) rose from 4% in 2017 to 40% in 2024, representing a dramatic and rapid diversification of Croatia’s foreign labour supply.
65. Conversely, the share of Bosnian nationals in Croatian work permits fell from 65% in 2017 to around 18% in 2024, reflecting the depletion of traditional Balkan labour supply pools.
66. In the first nine months of 2025, work permit issuance fell 14.3% year-on-year to approximately 136,200, as the stricter 2025 Aliens Act reforms and declining post-earthquake construction reduced demand.
67. Construction-related work permits fell nearly 28% in the first nine months of 2025, while retail was the only major sector to record permit growth — a sector-level shift in foreign labour demand.
68. Permit renewals rose 20% in 2025 while new permits fell, signalling a market shift from constant new hiring toward retaining existing foreign workers — a maturing of the foreign labour market.
69. Seasonal work authorizations rose 14% to approximately 19,000 in the first nine months of 2025, reflecting strong, sustained demand for tourism and agriculture seasonal staff.
70. Non-resident workers earned approximately €1.2 billion in Croatia in 2024, with remittances sent abroad reaching €307 million in H1 2025 alone — up from €285 million in H1 2024 (Croatian National Bank).
71. Under the March 2025 Aliens Act amendments, work permits are now valid for up to 3 years (previously 1 year), providing greater stability for workers and reducing administrative burden for employers.
72. Foreign workers can now change employers without a new permit after one year in the same occupation, a major reform enabling labour mobility and reducing exploitation risks.
73. From January 2026, employers who have violated labour law face penalties that bar them from hiring foreign workers, creating compliance pressure that is reshaping recruitment agency practices.
74. Employers must now pay foreign workers the same wages as Croatian workers in equivalent roles — an equal pay mandate embedded in the 2025 Aliens Act amendments.
75. Over 37,500 Croatian pensioners were employed part-time in mid-2025, up 17% year-on-year — an emerging workforce segment filling gaps left by emigration in services and administration.
🏙️ REGIONAL LABOUR MARKET DISPARITIES
76. The City of Zagreb recorded an unemployment rate of just 2.6% in 2023, approaching full employment with the highest employment rate nationally at 56.6% of the working-age population.
77. Varaždin County recorded an unemployment rate of 3.1% in 2023, the second lowest in Croatia — proximity to Slovenia and strong manufacturing reflect its tight labour market.
78. Virovitica-Podravina county had an unemployment rate of 15.3% in 2023, nearly six times higher than Zagreb’s — the single highest rate in the country, reflecting stark east-west inequality.
79. Sisak-Moslavina county recorded 13.6% unemployment in 2023, just two hours from Zagreb — highlighting how dramatic regional disparities persist even at short geographic distances.
80. Pannonian Croatia’s employment rate was just 43% in 2023, 6.5 percentage points below the national average, with women’s employment rate at only 37%.
81. Northern Croatia’s employment rate of 52.4% in 2023 was 2.9 pp above the national average, with a youth employment rate of 31.2% — the highest of any Croatian region.
82. Adriatic Croatia had an employment rate of 48.6% in 2023, with women’s employment at 45% — slightly above the national average for women, aided by tourism-sector opportunities.
83. Zagreb’s regional GDP per capita stands at 118% of the EU average, while eastern Croatian counties are at just 36% — among the widest intra-country regional GDP disparities in the EU.
84. In 2023, more than 51.5% of Zagreb’s labour force had tertiary education, compared to just 20.1% in Pannonian Croatia — a stark education gap that deepens regional skill divides.
85. In Pannonian Croatia, the unemployment rate in Q3 2023 was 9.2%, more than double the rate in Zagreb and Northern Croatia — reflecting persistent structural economic underdevelopment.
💻 SECTORAL HIRING & DIGITAL ECONOMY
86. Croatia has produced four technology unicorns — Infobip, Rimac Automobili, Nanobit, and Photomath — establishing Zagreb as a recognized regional tech hub attracting international recruitment talent.
87. Approximately 70% of all Croatian startups are located in Zagreb, reinforcing the capital’s role as the dominant hiring market for technology, finance, and knowledge-economy roles.
88. Data Scientist/AI Specialist is the highest-paying job in Croatia in 2025, with monthly net salaries ranging from €3,500 to €6,000 depending on experience and specialization.
89. Cloud Engineers earn approximately €3,121 net per month, while surgeons earn €4,000–€8,000 net — the two most lucrative broad professions in the Croatian market.
90. There were an estimated 70,000 seasonal job openings in Croatia for the 2025 tourism season, spanning hospitality, recreation, food service, and retail roles.
91. Croatia’s tourism industry generates approximately 8,000+ new job postings per month during peak recruitment periods, making it one of the most active hiring markets in the country.
92. The highest-paid sector by average net salary in November 2025 was air transport at €2,315, while clothing manufacture recorded the lowest at €967 — a €1,348 gap within the same national economy.
93. The pharmaceutical manufacturing sector recorded the single highest average net salary in February 2026 at €4,281 — nearly three times the national average, reflecting the sector’s knowledge intensity.
94. Approximately 54% of current work time in Croatia consists of repetitive activities susceptible to automation (McKinsey), underscoring the urgency of upskilling investment.
95. The minimum gross wage for employing a foreign worker in Croatia in 2026 is €970 per month — equal to the national minimum wage, reinforcing the equal pay mandate.
🔭 POLICY, PROJECTIONS & OUTLOOK
96. The projected unemployment rate for Croatia in 2026 is 4.5%, continuing the long-term downward trend that began in 2013 (Salaries in Croatia 2026 Guide).
97. Nominal wage growth is projected at 4.0% for 2026, a significant deceleration from back-to-back 10%+ years in 2024 and 2025, as the catch-up phase normalizes.
98. Real GDP growth projected at 2.9% for 2026, with EU-funded green and digital transformation projects providing the primary investment impetus.
99. Croatia’s inflation rate (HICP) is forecast to fall from 4.3% in 2025 to 2.8% in 2026, improving real wage growth conditions for workers and households.
100. Croatia’s peak unemployment of 17.5% in 2013 has declined by over 12.6 percentage points by Q2 2025 — representing the steepest and most sustained labour market recovery among post-crisis European economies.
101. Immigration to Croatia first exceeded emigration in 2022 for the first time in 15 years, and the positive net migration trend continued in 2023 and 2024 — a structural milestone in the country’s demographic history.
102. Approximately 84,000 temporary and seasonal labour migration permits (excluding intra-EU movement) were issued in 2024, reflecting the scale of Croatia’s seasonal workforce dependency (OECD Migration Outlook 2025).
103. The Choose Croatia diaspora return scheme (2022–2024) attracted fewer than 500 applicants of a targeted 4,500, illustrating the structural depth of emigration incentives and the difficulty of policy-driven return.
Conclusion
The recruitment landscape in Croatia in 2026 reflects a labour market undergoing significant structural transformation. Declining unemployment, rising wages, persistent skills shortages, demographic pressures, and growing dependence on international workers are reshaping how businesses attract, hire, and retain talent. As Croatia continues its economic development and integration into the broader European labour market, employers and recruitment professionals must adopt more strategic, flexible, and data-driven approaches to workforce planning.
The Top 103 Recruitment Statistics, Data & Trends in Croatia in 2026 highlight several important developments. Croatia’s unemployment rate reached 4.9% in the second quarter of 2025, a substantial improvement from 17.5% in 2013. Meanwhile, the average monthly net salary increased to €1,527 in February 2026, reflecting continued wage growth and intensifying competition for qualified employees. With economic growth projected at 2.9% in 2026, the country’s employment outlook remains relatively positive, although significant recruitment challenges persist across multiple industries.
One of the most pressing issues facing Croatia’s labour market in 2026 is the widening gap between workforce supply and employer demand. Construction, tourism, hospitality, manufacturing, healthcare, and information technology continue to experience difficulties attracting skilled professionals. World Bank projections suggesting that Croatia could require more than 300,000 additional workers by 2035 demonstrate the scale of the country’s long-term workforce challenges. These pressures are compounded by population ageing, emigration, and a projected 25% decline in the working-age population between 2025 and 2060.
International recruitment is becoming an increasingly important component of Croatia’s employment strategy. With 206,529 residence and work permits issued in 2024, foreign workers have become essential to sustaining operations across labour-intensive industries. However, changes to immigration regulations, employment compliance requirements, and worker mobility rules mean that businesses must place greater emphasis on responsible recruitment practices, fair compensation, and effective employee integration.
At the same time, salary trends and technological transformation are redefining recruitment strategies in Croatia. Growing demand for digital skills, artificial intelligence expertise, cloud engineering, and specialised technical professionals is creating new employment opportunities. Employers that invest in competitive compensation, employee training, career development, and workforce retention will be better positioned to navigate an increasingly competitive hiring environment.
Regional labour market disparities also remain a significant consideration. While Zagreb continues to attract highly educated professionals and offers relatively strong employment opportunities, parts of eastern and rural Croatia face higher unemployment, lower wages, and greater demographic challenges. Addressing these inequalities through targeted investment, vocational education, regional development, and improved workforce mobility will be important for achieving sustainable employment growth.
Looking ahead, the future of recruitment in Croatia will depend on how effectively employers respond to labour shortages, demographic change, digitalisation, and evolving employee expectations. Businesses should prioritise long-term talent acquisition strategies, diversify recruitment channels, strengthen employer branding, and embrace technology to improve hiring efficiency. Recruitment agencies and HR professionals will also play an increasingly valuable role in connecting employers with domestic and international talent.
Ultimately, these 103 Croatia recruitment statistics and hiring trends for 2026 demonstrate that the country’s employment market presents both considerable opportunities and complex challenges. Organisations that understand these trends and translate labour market insights into practical workforce strategies will be better equipped to attract skilled employees, reduce recruitment difficulties, and achieve sustainable business growth.
As Croatia’s economy and workforce continue to evolve, staying informed about the latest employment statistics, salary trends, labour market developments, and recruitment opportunities in Croatia will be essential for employers, recruiters, policymakers, and job seekers seeking to succeed in 2026 and beyond.
If you find this article useful, why not share it with your hiring manager and C-level suite friends and also leave a nice comment below?
We, at the 9cv9 Research Team, strive to bring the latest and most meaningful data, guides, and statistics to your doorstep.
To get access to top-quality guides, click over to 9cv9 Blog.
To hire top talents using our modern AI-powered recruitment agency, find out more at 9cv9 Modern AI-Powered Recruitment Agency.
People Also Ask
What are the latest recruitment trends in Croatia in 2026?
Croatia’s recruitment trends in 2026 include declining unemployment, rising salaries, increasing demand for skilled workers, greater reliance on foreign employees, and growing investment in digital skills and workforce development.
What is the unemployment rate in Croatia in 2026?
Croatia’s unemployment rate stood at 4.9% in Q2 2025, down significantly from 17.5% in 2013. Labour market projections suggest unemployment could decline further to approximately 4.5% in 2026.
What is the employment rate in Croatia?
Croatia’s employment rate reached 68.8% in Q2 2025, reflecting substantial improvements in workforce participation and job creation. However, employment levels remain below those of several neighbouring European countries.
What is the average salary in Croatia in 2026?
Croatia’s average monthly net salary reached €1,527 in February 2026, while the average gross salary stood at €2,139. Salaries vary significantly depending on industry, occupation, experience, and geographic location.
What is the minimum wage in Croatia in 2026?
The supplied recruitment dataset reports a gross monthly minimum wage of €970 for 2025. It also references this amount for foreign workers in 2026, although the general statutory minimum wage for 2026 requires separate verification.
Which industries are hiring the most workers in Croatia in 2026?
Construction, tourism, hospitality, manufacturing, information technology, healthcare, and retail are important recruitment sectors in Croatia. Many employers face persistent difficulties finding qualified professionals and seasonal employees.
What are the biggest recruitment challenges in Croatia?
Croatia’s major recruitment challenges include skilled labour shortages, population ageing, emigration, rising salary expectations, regional employment disparities, and increasing competition for qualified domestic and international workers.
How many foreign workers are employed in Croatia?
Croatia issued 206,529 residence and work permits in 2024. As of January 31, 2025, approximately 113,504 foreign nationals held active work permits, particularly in construction, tourism, manufacturing, transport, and trade.
Which countries supply the most foreign workers to Croatia?
Bosnia and Herzegovina, Nepal, Serbia, India, and the Philippines were among Croatia’s leading sources of foreign workers in 2024, reflecting the country’s growing dependence on international recruitment.
Why is Croatia experiencing labour shortages?
Croatia faces labour shortages because of population decline, workforce ageing, emigration, skills mismatches, and increasing employer demand. Construction, tourism, manufacturing, and technology are particularly affected.
How many additional workers will Croatia need by 2035?
According to World Bank estimates cited in the dataset, Croatia could require more than 300,000 additional workers by 2035 to support economic development, digital transformation, and the transition toward a greener economy.
What are the highest-paying jobs in Croatia in 2026?
High-paying professions in Croatia include AI specialists, data scientists, cloud engineers, surgeons, and pharmaceutical professionals. The dataset reports monthly net salaries of €3,500–€6,000 for experienced AI and data specialists.
How much do IT professionals earn in Croatia?
The dataset reports an average monthly net IT salary of approximately €1,789, while specialised cloud engineers can earn around €3,121. Compensation varies considerably by technical expertise, experience, and employer.
Is Croatia a good country for employment opportunities in 2026?
Croatia offers employment opportunities in tourism, construction, technology, manufacturing, and healthcare. Declining unemployment and persistent skills shortages create opportunities, although salaries and job availability vary by region.
How is Croatia’s ageing population affecting recruitment?
Croatia’s ageing population is reducing the supply of working-age employees. Projections suggest its working-age population could decline by 25% between 2025 and 2060, increasing pressure on recruitment and workforce retention.
What is the impact of emigration on Croatia’s labour market?
Emigration has contributed to workforce shortages and the loss of skilled professionals. More than one in six Croatian-born tertiary-educated individuals are estimated to live in other OECD countries.
What are the latest foreign worker recruitment regulations in Croatia?
Croatia introduced immigration reforms in 2025, including work permits valid for up to three years, greater worker mobility, and stronger employer compliance requirements. Businesses must follow applicable employment and immigration regulations.
How many work permits did Croatia issue in 2024?
Croatia issued 206,529 residence and work permits in 2024, approximately 20% more than in 2023. These included new permits, renewals, and seasonal work authorisations.
What are the most in-demand skills in Croatia in 2026?
In-demand skills include construction trades, metalworking, machinery operation, ICT expertise, cloud computing, artificial intelligence, and hospitality services. Technical training and digital competencies are increasingly important.
What is the job vacancy rate in Croatia?
Croatia’s job vacancy rate reached approximately 1.70% in Q1 2025, increasing from 1.40% in Q4 2024. This indicates continued demand for workers across multiple industries.
Which Croatian regions have the lowest unemployment rates?
Zagreb recorded an unemployment rate of 2.6% in 2023, followed by Varaždin County at 3.1%. Both regions benefit from relatively strong economic activity and employment opportunities.
Which regions in Croatia have the highest unemployment rates?
Virovitica-Podravina County recorded unemployment of 15.3% in 2023, while Sisak-Moslavina County reached 13.6%. These figures highlight significant regional differences in Croatia’s employment market.
How important is tourism recruitment in Croatia?
Tourism is a major source of seasonal employment in Croatia. Approximately 70,000 seasonal job openings were estimated for the 2025 tourism season, spanning hospitality, food services, recreation, and retail.
How is artificial intelligence changing recruitment in Croatia?
Artificial intelligence and automation are increasing demand for digital skills and workforce reskilling. Employers may also adopt AI-supported recruitment tools to improve candidate screening, hiring efficiency, and talent management.
What is the gender pay gap in Croatia?
The dataset cites a gender pay gap of approximately 11%–15%, depending on the survey and calculation method. Differences in occupations, seniority, industry representation, and compensation contribute to unequal earnings.
How does Croatia’s salary growth compare with other EU countries?
Croatia’s gross average earnings increased by 36.3% between 2018 and 2023, compared with 19.8% across the EU27. This reflects relatively rapid wage growth, although Croatian salaries remain below many EU averages.
What are the recruitment opportunities for international workers in Croatia?
International workers can find opportunities in construction, tourism, hospitality, manufacturing, transport, and retail. Employers increasingly recruit from Asian countries and neighbouring Balkan economies to address labour shortages.
How is digital transformation affecting Croatia’s job market?
Digital transformation is increasing demand for ICT professionals, AI specialists, cloud engineers, and technically skilled employees. Automation also creates pressure for reskilling and vocational education.
What is the economic outlook for Croatia’s labour market in 2026?
Croatia’s real GDP growth is projected at 2.9% in 2026, with unemployment forecast at approximately 4.5%. Economic expansion should support employment, although demographic pressures and skills shortages remain challenges.
What should employers do to improve recruitment in Croatia in 2026?
Employers should offer competitive salaries, strengthen employer branding, invest in employee training, improve retention, expand recruitment channels, and consider compliant international hiring to address Croatia’s persistent talent shortages.