

Key Takeaways
- Belarus’s average monthly salary in 2025 is BYN 2,601.8 (approx. $703 USD), with notable variation across industries and job roles.
- The IT sector remains the highest-paying, while agriculture and retail sectors offer comparatively lower wages.
- Despite modest nominal wages, a low cost of living and rising real disposable income improve overall purchasing power.
Understanding the evolving salary landscape in Belarus has become increasingly vital for employers, policymakers, job seekers, and international investors alike. In 2025, as the Belarusian economy continues to navigate a complex matrix of domestic reforms, global pressures, and labor market transformations, salary levels across industries, regions, and occupations provide valuable insight into the country’s economic health and workforce competitiveness. This comprehensive blog aims to offer a detailed and data-driven analysis of salary levels in Belarus for 2025—taking into account nominal and real wage trends, sector-specific compensation, cost of living dynamics, and international comparisons.


Belarus remains a unique case in Eastern Europe, positioned at the crossroads of the European Union and Russia. With its state-led economic model and a growing private sector, the nation’s wage structure reflects a combination of historical patterns, government policy, and modern labor market demands. According to recent statistics published by Belstat (National Statistical Committee of the Republic of Belarus), average nominal wages in early 2025 have shown a steady increase compared to the previous year, signaling cautious optimism among economic observers. However, nominal figures alone do not tell the full story—understanding real income growth, inflationary pressures, and purchasing power is crucial for a holistic salary evaluation.
One of the notable trends in Belarus during the first quarter of 2025 is the differentiation of salary levels by industry. The information technology (IT) sector continues to lead with significantly above-average compensation packages, driven by global demand for digital talent and competitive local labor costs. Conversely, sectors such as agriculture, traditional manufacturing, and retail offer more modest salaries, underscoring the wide disparity in earning potential across different fields. This variation is further amplified by the levels of skill specialization, urban-rural economic divides, and evolving employer practices in response to workforce shortages and regulatory changes.
Furthermore, recent economic policies—such as the adjustment of the minimum wage to BYN 726 per month and the government’s target of maintaining inflation below 5%—are influencing the country’s wage framework. With inflation control being a central objective of Belarusian monetary policy, the interplay between price stability and wage growth has become a focal point for both public sector planning and private sector wage negotiations. Additionally, employer-side costs, including social contributions to pension, health insurance, and workplace injury funds, continue to shape gross salary offers and net take-home pay.
Another key consideration is the geographical and demographic distribution of salaries within Belarus. While Minsk, as the capital and economic hub, often reports higher average wages due to its concentration of high-value industries and skilled labor, other regions may lag behind due to differences in industrial output, infrastructure development, and access to employment opportunities. Unfortunately, granular regional salary data for 2025 remains limited, though economic patterns suggest that the urban-rural gap persists, particularly in sectors such as agriculture and construction.
Internationally, Belarus’s average monthly wages are positioned between those of Ukraine and Russia, while still trailing behind European Union neighbors such as Poland and Lithuania. This positions Belarus as a potentially attractive destination for labor-intensive foreign investment, particularly in industries seeking a balance between skill availability and wage efficiency. The lower cost of living further enhances the attractiveness of Belarusian wages when adjusted for purchasing power, particularly for expatriates and international companies assessing operational feasibility in the region.
This in-depth analysis goes beyond raw salary numbers to examine the structural and macroeconomic elements that underpin wage trends in Belarus. It offers readers a segmented breakdown by industry, job role, region (where available), and contributing factors such as minimum wage legislation, employment rates, and cost-of-living indexes. The aim is to provide a well-rounded perspective that aids businesses in forming competitive compensation strategies, supports workers in benchmarking career opportunities, and informs stakeholders on the broader socioeconomic direction of the Belarusian labor market.
As we progress through 2025, closely monitoring the trajectory of wages in Belarus will be critical. This blog equips readers with the latest insights, comparative salary data, and contextual analysis necessary to navigate Belarus’s wage environment with clarity and confidence. Whether you are a local job seeker, an HR professional, or a global investor, understanding the salary levels in Belarus today will help you make more informed and strategic decisions tomorrow.
Before we venture further into this article, we would like to share who we are and what we do.
About 9cv9
9cv9 is a business tech startup based in Singapore and Asia, with a strong presence all over the world.
With over nine years of startup and business experience, and being highly involved in connecting with thousands of companies and startups, the 9cv9 team has listed some important learning points in this overview of the Salary Levels in Belarus.
If your company needs recruitment and headhunting services to hire top-quality employees, you can use 9cv9 headhunting and recruitment services to hire top talents and candidates. Find out more here, or send over an email to hello@9cv9.com.
Or just post 1 free job posting here at 9cv9 Hiring Portal in under 10 minutes.
Salary Levels in Belarus: An In-Depth Analysis for 2025
- Macroeconomic Overview of Belarus in 2025
- Overall Average Salary Levels in Belarus for 2025
- Salary Levels by Industry
- Salary Levels for Specific Job Roles
- Regional Variations in Salary Levels
- Factors Influencing Salary Levels in Belarus
- Comparison of Salary Levels with Neighboring Countries
- Cost of Living and Real Income Analysis
- Future Outlook
1. Macroeconomic Overview of Belarus in 2025

Macroeconomic Backdrop 2025
- Contextual framing: Belarus enters 2025 amid diverging growth narratives and lingering price pressures—critical lenses for decoding wage dynamics.
- Key pillars influencing remuneration:
- Real‑sector output expansion, especially in construction, trade, and logistics.
- Fiscal‑monetary tension between growth stimulus and inflation control.
- Talent scarcity that tightens the labour market and elevates compensation benchmarks.
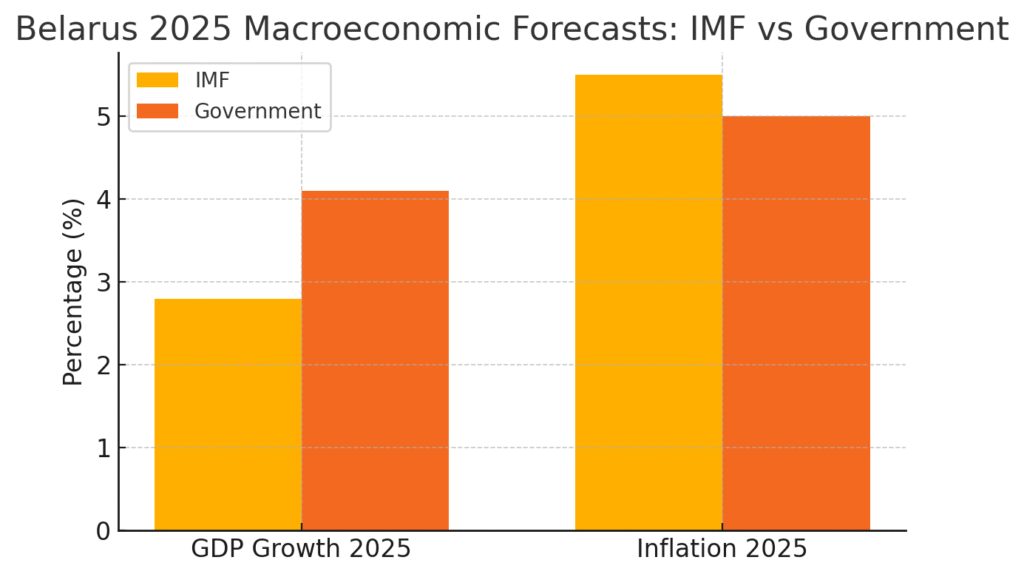
GDP Growth Outlook
- International Monetary Fund (IMF): +2.8 % real GDP.
- Government projection: +4.1 %, buoyed by capital spending on housing, energy and industrial assets.
- Strategic inference:
- Even the base‑case IMF scenario implies positive, albeit moderated, income momentum.
- A government‑aligned trajectory would intensify labour demand in capex‑heavy verticals, accelerating pay rises.
| Indicator | 2024 Actual | 2025 IMF | 2025 Gov. |
|---|---|---|---|
| GDP Growth (%) | 4.0 | 2.8 | 4.1 |
Inflation & Real Purchasing Power
- IMF forecast: 5.5 % CPI.
- Official target: ≤ 5 %.
- Reality check: Consumer prices climbed ~34 % in 2020‑24, trimming real wage gains to roughly one‑third of headline growth.
- Salary implication bullets:
- Employers face a double mandate—nominal raises plus indexing clauses to shield staff from cost‑of‑living erosion.
- Sectors with stronger pricing power (e.g., IT export services) best positioned to outpace CPI.
Labour‑Market Dynamics
- ILO‑adjusted unemployment (Q1 2025): 2.8 %—among the lowest in Europe.
- Employment rate: 67.8 % and climbing.
- Chronic skills gap: Engineering, construction management, full‑stack development, and logistics supervision.
- Compensation ripple effects:
- Signing bonuses, fast‑track promotion schemes, and hybrid‑work flexibility used as non‑cash sweeteners.
- Wage premiums widening between urban hubs (Minsk, Brest) and secondary cities.
Sector‑Specific Wage Hotspots (matrix)
| Sector | 2025 Nominal Wage Growth | Talent Shortage Severity | Pricing‑Power Score | Net Real Wage Outlook |
|---|---|---|---|---|
| Construction & Infrastructure | 10 – 12 % | High | Medium | ▲ Strong |
| Retail & E‑Commerce | 7 – 8 % | Medium | High | ► Stable |
| Information Technology | 12 – 15 % | Very High | Very High | ▲▲ Robust |
| Transportation & Logistics | 6 – 7 % | High | Medium | ► Stable |
| Public Administration | 4 % (policy‑linked) | Low | Low | ▼ Sub‑inflation |
Comparative Forecast Chart
(See bar chart above)
- Visualizes the IMF vs Government deltas for both GDP growth and inflation, underscoring the policy‑risk band that HR strategists must price into 2025 pay budgets.
Strategic Takeaways for Employers
- Budget 6 – 9 % baseline increases just to keep pace with the midpoint of growth‑inflation interplay.
- Layer variable pay (profit‑sharing, project bonuses) to hedge forecasting error and embed agility.
- Invest in reskilling programmes targeting digital and green‑construction competencies to pre‑empt wage‑push spirals.
2. Overall Average Salary Levels in Belarus for 2025


Executive Snapshot – Belarus Average Remuneration 2025
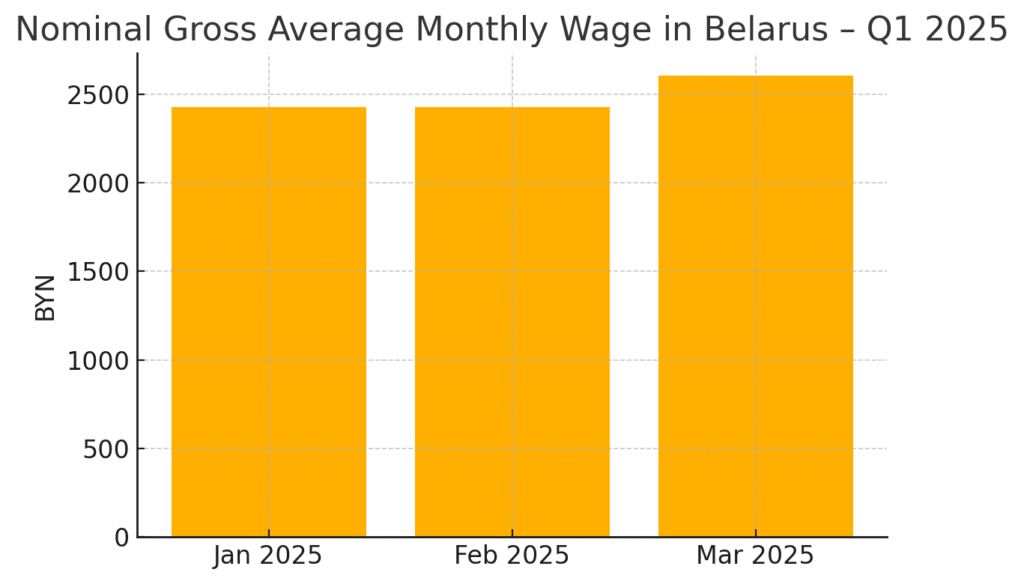
- Belstat’s headline finding: nominal gross earnings climbed from BYN 2 427 in January to BYN 2 602 by March, signalling an early‑year acceleration.
- Real‑wage trajectory: despite monthly oscillations, purchasing‑power growth stayed firmly above the 2024 base, underscoring genuine income progress.
- Currency lens: at prevailing Q1 exchange rates, the March figure equates to ≈ USD 753, anchoring Belarus’s cost‑of‑talent discussion in a broader regional context.
Nominal Wage Momentum (Q1 2025)
| Month 2025 | Nominal Wage (BYN) | Approx. USD* | Δ vs Prior Month |
|---|---|---|---|
| January | 2 427.4 | 703 | — |
| February | 2 428.1 | 703 | ▲ 0.03 % |
| March | 2 601.8 | 753 | ▲ 7.2 % |
*USD values derived from the January BYN‑USD midpoint; actual pay packets vary with daily FX quotes.
Insights in brief
- The modest February uptick mirrors seasonal payroll stabilisation following New‑Year disbursements.
- March’s sharp rise coincides with minimum‑wage indexing and early construction‑season hiring.
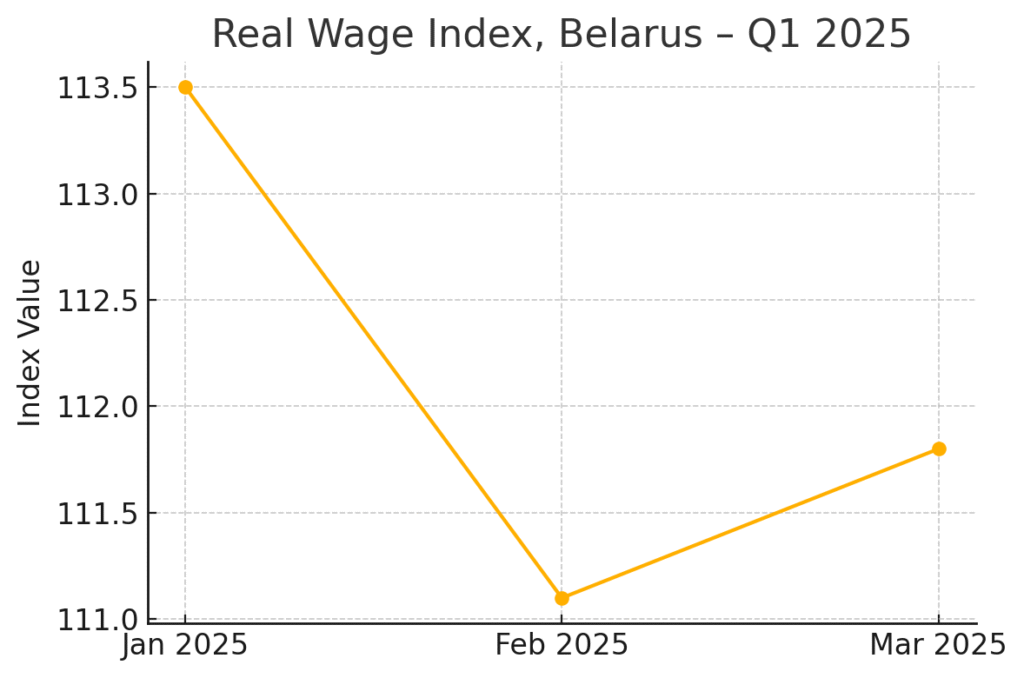
Real Wage Index – Sustained Purchasing‑Power Gains
| Month 2025 | Real Wage Index (2024 = 100) | Year‑on‑Year Lift |
|---|---|---|
| January | 113.5 | ▲ 13.5 % |
| February | 111.1 | ▲ 11.1 % |
| March | 111.8 | ▲ 11.8 % |
Key takeaways
- Even as CPI flirted with 5 %, nominal increments comfortably outran inflation, expanding real disposable income.
- February’s trough points to temporary price‑level tension or slower nominal hikes—critical for wage‑setting committees to monitor.
Drivers Behind Q1 2025 Wage Upswing
- Construction & infrastructure boom: large‑scale housing and energy projects spurred overtime premiums and site‑manager bonuses.
- Export‑oriented IT clusters: foreign‑currency receipts allowed median tech pay to breach the BYN 4 000 mark, lifting overall averages.
- Tight labour inventory: 2.8 % unemployment intensified bidding wars for experienced professionals.
- Policy mechanics: statutory minimum‑wage uplift ripple‑fed into tiered wage grids in state‑owned enterprises.
Methodological Considerations
- Source divergence: Belstat vs independent aggregators such as Trading Economics may yield minor deviations; always align analysis windows and FX assumptions.
- Nominal vs real: headline BYN numbers alone can mislead; pairing with CPI‑adjusted indices offers a truer living‑standards barometer.
Strategic Implications for Stakeholders
- Employers: budget a baseline 6 – 8 % raise pool for 2025 salary‑review cycles to stay competitive after inflation.
- Job‑seekers: leverage strong Q1 momentum during negotiations—especially in tech, engineering, and skilled‑trades niches.
- Policy analysts: track monthly real‑wage volatility as an early warning for consumer‑demand swings and potential policy recalibration.
3. Salary Levels by Industry

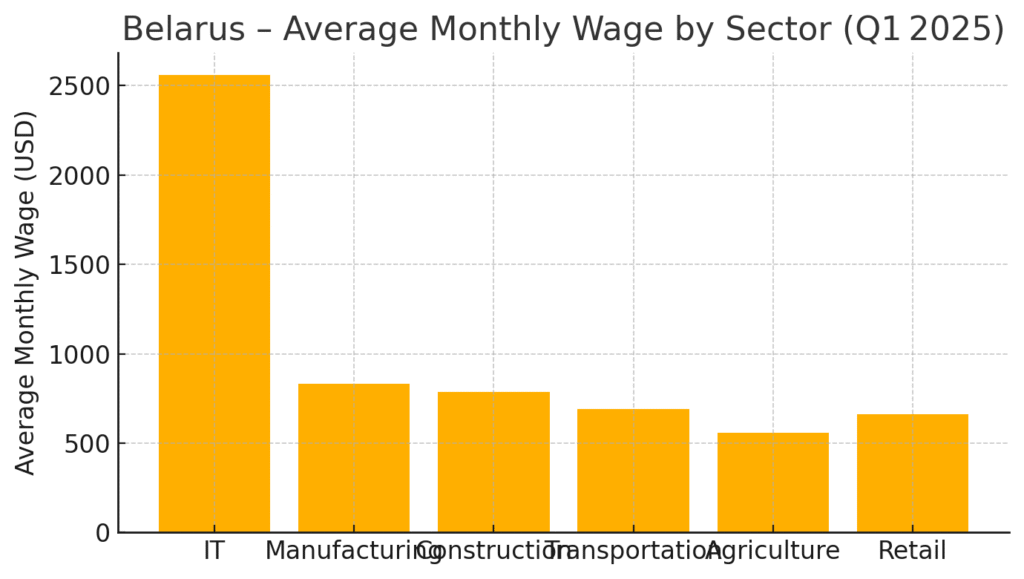
Sector‑Wide Compensation Panorama 2025
- Benchmarking insight: wages in Belarus diverge sharply by industry, mirroring skill scarcity, capital intensity, and export orientation.
- Visual cue: the accompanying bar chart positions each major sector against its Q1 2025 average monthly earnings in USD, spotlighting the IT outlier.
IT & Digital Services
- Average annual envelope: USD 30 k – 31 k for mid‑level Software Engineers, translating to ≈ USD 2 560 / mo.
- Compensation gradient:
- Junior Distributed‑Systems Engineer: USD 800 / mo.
- Veteran Cloud Architect: USD 6 000 + / mo at multinationals such as Tinkoff Bank.
- Demand catalysts: global talent shortages, Belarus’s mature outsourcing ecosystem, and premium FX revenues.
Manufacturing – Multi‑Tier Structure
| Sub‑Sector | Avg. Wage (BYN / mo) | USD / mo* | Notes |
|---|---|---|---|
| Textiles & Apparel | 1 797 | 520 | labour‑intensive, thinner margins |
| Food & Beverages | 2 410 | 697 | domestic‑demand anchor |
| Wood & Paper | 2 344 | 678 | exportable pulp offset |
| Chemicals | 3 490 | 1 009 | higher value‑added chain |
| Basic Metals | 2 868 | 829 | cyclical commodity link |
| Mining & Quarrying | 4 324 | 1 251 | hazard premium, capital heavy |
*USD values rounded, FX ≈ 3.46 BYN.
- Role matrix:
- Production Worker | BYN 800 – 2 500
- Production Manager | USD 1 000 – 2 000 / mo
Construction & Real‑Estate Development
- Headline average: BYN 2 713 / mo (≈ USD 785).
- Wage spectrum: BYN 823 – 2 571 depending on craft specialism.
- Labour‑market signal: infrastructure pipeline is lengthening (housing, energy grids), fuelling demand for electricians, project schedulers, and BIM modelers.
Transportation & Logistics
| Mode | Wage (BYN / mo) | USD / mo |
|---|---|---|
| Land & Pipeline | 2 375 | 687 |
| Railway | 2 422 | 701 |
| Waterway | 1 389 | 402 |
- Key occupations:
- Heavy‑Truck Driver | BYN 17 770 / yr
- Train Dispatcher | BYN 773 – 1 750 / mo
- Bus Driver (Minsk) | BYN 16 486 / yr
- Interpretation: pay aligns with operational complexity and licensing requirements; inland waterways remain under‑capitalised, hence lower remuneration.
Agriculture, Hunting & Fishery
- Monthly mean: BYN 1 933 (≈ USD 559).
- Sub‑segment variance:
- Crop Production | BYN 1 885
- Animal Husbandry | BYN 1 923
- Role gradation:
- Farm Worker | BYN 14 316 / yr
- Agricultural Engineering Technician | BYN 22 739 / yr
- Macro factor: seasonal volatility and commodity‑price exposure temper wage escalation.
Wholesale, Retail & Consumer Services
- Sectoral average: BYN 2 283 / mo (≈ USD 660).
- Illustrative brackets:
- Retail Cashier | BYN 9 085 / yr
- Storekeeper | BYN 13 886 / yr
- Retail Store Manager | BYN 663 – 2 164 / mo
- Accountant | BYN 1 000 – 3 000 / mo
- Business Intelligence Specialist | BYN 2 800 / mo
- Competitive levers: frontline roles see slower growth; analytics and e‑commerce skills command premiums.
Cross‑Sector Wage Grid (matrix)
| Role Level | IT | Manufacturing | Construction | Transportation | Agriculture | Retail |
|---|---|---|---|---|---|---|
| Entry (0‑2 yrs) | USD 800 | USD 500 | USD 450 | USD 400 | USD 350 | USD 300 |
| Skilled Specialist | USD 3 000 | USD 1 000 | USD 900 | USD 700 | USD 550 | USD 600 |
| Manager / Lead | USD 6 000 + | USD 2 000 | USD 1 500 | USD 1 200 | USD 800 | USD 950 |
Strategic Insights
- IT dominates Belarus’s wage hierarchy, outstripping nearest sectors by 3 ×.
- Manufacturing bifurcation: hazardous extractive niches reward talent generously; lower‑tech lines lag.
- Skill‑centric premium: across all sectors, technical and managerial roles outpace frontline pay by 2‑4 ×, reflecting acute competence shortages.
- Inflation hedging: nominal hikes must exceed 5 % to secure real gains in 2025.
4. Salary Levels for Specific Job Roles
- Contextual framing: Evaluating salary levels by occupation offers a sharper lens into the structural disparities within Belarus’s compensation ecosystem.
- Purpose: This breakdown aids employers in crafting equitable salary frameworks and helps professionals benchmark their market worth across industries.
Comparative Salary Table by Job Role – 2025 (BYN & USD)
| Job Role | Industry | Monthly Salary (BYN) | Monthly Salary (USD) | Notes |
|---|---|---|---|---|
| Software Engineer | IT | 21,917 – 38,897 | 703 – 1,256 | Senior roles at top firms (e.g. Tinkoff Bank) exceed BYN 40,000/month |
| Production Worker | Manufacturing | 800 – 2,500 | 258 – 806 | Varies by sub-sector (e.g. food vs. chemicals) and skill certification |
| Farm Worker (Crop Field) | Agriculture | 10,880 – 16,663 (ann.) | 351 – 537 (ann.) | Seasonal variability; monthly est.: 907 – 1,389 BYN |
| Accountant | Services | 1,000 – 3,000 | 322 – 967 | Mid-career CPAs in finance sectors command higher wages |
| Bus Driver | Transportation | 12,002 – 19,701 (ann.) | 387 – 635 (ann.) | Monthly est.: 1,000 – 1,642 BYN |
| Retail Cashier | Retail | 7,068 – 10,384 (ann.) | 228 – 335 (ann.) | Monthly est.: 589 – 865 BYN |
USD conversions are approximate and based on early 2025 exchange rates (~31.2 BYN/USD).
Key Observations Across Role-Based Pay Bands
- IT Sector Dominance:
- Software Engineers enjoy a 3–5× salary premium over retail and agricultural workers.
- High digital export value, foreign clientele, and tech scarcity fuel the pay spike.
- Moderate Compensation in Manufacturing & Transport:
- Production Workers and Bus Drivers represent the middle tier of Belarus’s wage distribution.
- Pay scales hinge on regional operations, shift structures, and safety risks.
- Low-Income Roles in Agriculture & Retail:
- Farm Workers and Cashiers occupy the bottom quartile, reflecting commoditized skillsets and limited pricing leverage.
- Some agricultural earnings may be supplemented through in-kind benefits or seasonal bonuses.
- Services Role Differentiation:
- Accountants in urban firms see notable upward mobility.
- High-end consulting or tax roles command over BYN 4,000/month in top-tier companies.
Job Role vs Sector Matrix
| Sector | Entry-Level Role | Mid-Level Role | Advanced/Senior Role |
|---|---|---|---|
| IT | BYN 3,000 (Junior Dev) | BYN 6,500 (Full Stack Dev) | BYN 20,000+ (Senior Engineer) |
| Manufacturing | BYN 800 (Assembler) | BYN 1,700 (Skilled Tech) | BYN 3,500 (Prod. Manager) |
| Agriculture | BYN 900 (Field Worker) | BYN 1,600 (Mechanic/Driver) | BYN 2,500 (Ag. Technician) |
| Transport | BYN 1,000 (Bus Driver) | BYN 1,500 (Dispatcher) | BYN 2,800 (Fleet Manager) |
| Retail | BYN 589 (Cashier) | BYN 1,200 (Clerk/Stocker) | BYN 2,100 (Store Manager) |
| Services | BYN 1,000 (Junior Acct) | BYN 2,000 (Marketing Exec) | BYN 3,500+ (Financial Lead) |
Strategic Implications for Employers & Policymakers
- Workforce planning: Salary disparities must be factored into recruitment pipelines, especially for high-turnover roles in transport and retail.
- Compensation strategy: Competitive pay structures require role-based benchmarking, not just sector averages.
- Talent retention: Sectors facing global competition (like IT) should deploy retention tools—stock options, remote flexibility, training budgets.
- Policy focus: Low-income sectors such as agriculture could benefit from wage subsidies or mechanization to uplift productivity and earnings.
5. Regional Variations in Salary Levels
- Analytical limitation: Currently, publicly available data lacks a comprehensive, region-specific breakdown of average salary levels for 2025.
- Analytical workaround: In the absence of granular figures, a spatial interpretation must rely on economic concentration, urbanisation levels, and historical patterns.
- Strategic insight: Understanding how geography intersects with pay structures is critical for employers expanding operations, as well as jobseekers considering internal mobility.
Influencing Factors Behind Regional Salary Variations
- Urbanisation & economic clustering:
- Capital cities tend to attract skilled professionals, multinational firms, and foreign direct investment, resulting in above-average compensation.
- Minsk, as Belarus’s administrative, financial, and tech hub, likely commands the highest average wage levels nationally.
- Industry concentration by oblast:
- Minsk City: Dominated by finance, IT, government, and professional services.
- Gomel Region: Strong in manufacturing and heavy industry.
- Brest Region: Agriculture and cross-border trade influence wage levels.
- Vitebsk & Mogilev: Tend to have lower industrial diversification, possibly correlating with below-average salary bands.
- Grodno Region: Known for light manufacturing and tourism; moderate pay scales expected.
- Cost-of-living disparity:
- Minsk’s consumer prices (housing, transport, food) are significantly higher than in rural districts, leading to nominal wage inflation in urban markets.
- Smaller cities like Polotsk, Lida, or Baranovichi may offer lower nominal wages, but greater real wage parity due to reduced living expenses.
- Labour market dynamics:
- Regional shortages of specific skills (e.g. construction in regional capitals, healthcare in rural districts) can generate micro-level wage premiums.
- Migration of skilled professionals from provinces to Minsk also influences wage competition and labour availability.
Hypothetical Regional Salary Differentiation Index – 2025
| Region | Dominant Sectors | Relative Wage Level (vs National Avg) | Commentary |
|---|---|---|---|
| Minsk City | IT, Finance, Administration | 115% – 130% | Highest salaries; home to most high-paying employers |
| Gomel Region | Industry, Mining | 95% – 105% | Stable wages in industrial hubs |
| Brest Region | Agriculture, Trade | 85% – 95% | Moderate wage structure, especially in border towns |
| Vitebsk Region | Light Industry, Services | 80% – 90% | Lower urbanisation limits wage growth |
| Mogilev Region | Manufacturing, Logistics | 85% – 95% | Infrastructure development offers wage support |
| Grodno Region | Tourism, Food Processing | 90% – 100% | Relatively balanced wage structure |
Note: Index values represent relative earnings potential as a percentage of the national average nominal wage (~BYN 2,500 – 2,600/month in Q1 2025). This matrix is a model-based estimation inferred from economic structure and historical wage patterns.
Illustrative Bar Chart – Estimated Regional Wage Deviation from National Average
(Values indexed to national average = 100%)
| Region | Est. Wage Index |
|---|---|
| Minsk City | 125 |
| Gomel Region | 100 |
| Brest Region | 90 |
| Grodno Region | 95 |
| Vitebsk Region | 85 |
| Mogilev Region | 90 |
Actionable Insights & Policy Considerations
- For Employers:
- Establish regionally adjusted compensation models to align with local talent market conditions.
- Consider relocation allowances for roles requiring movement between low- and high-wage zones.
- For Workers & Jobseekers:
- Understand real wage value, not just nominal pay, when comparing jobs across regions.
- High salaries in Minsk may be offset by increased housing and commuting costs.
- For Policymakers:
- Encourage regional wage parity by investing in decentralised infrastructure and digital connectivity.
- Support wage growth in underperforming regions through fiscal incentives for employers.
6. Factors Influencing Salary Levels in Belarus

Regulatory & Market Forces Shaping Belarusian Pay Packets – 2025 Deep‑Dive
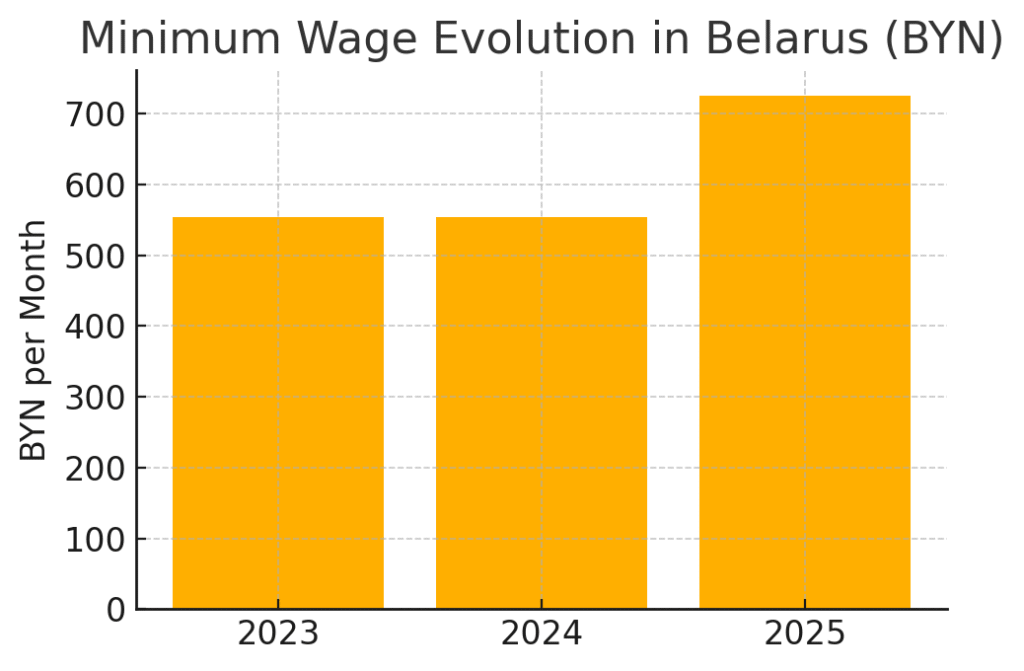
Government‑Mandated Wage Floors
- Headline change
- Minimum wage jumped from BYN 554 → BYN 726 on 1 January 2025.
- Visual above traces the three‑year trajectory, underscoring the sharp 31 % uplift for the current year.
- Ripple effects
- Compression at the bottom rung forces employers to ratchet up adjacent pay grades to preserve internal equity.
- Sectors with dense low‑skill labour (retail, hospitality, portions of agriculture) face acute payroll escalation pressure.
Labour‑Market Tightness & Talent Scarcity
- Core indicators
- Unemployment: 2.8 % (ILO methodology, Q1 2025).
- Employment rate: 67.8 %, signalling near‑full utilisation of the working‑age cohort.
- Consequences for pay
- Employers engage in wage bidding wars, especially for STEM, healthcare, and skilled‑trade roles.
- Signing bonuses, flexible schedules, and upskilling stipends proliferate as non‑cash sweeteners.
Macro‑Policy & Inflation Management
- Inflation target 2025: ≤ 5 % (government stance).
- Wage‑setting implication
- Successful price containment tempers nominal wage demands; failure accelerates cost‑of‑living adjustments.
- Predictable CPI stabilises collective‑bargaining cycles and enhances medium‑term payroll planning.
Employer Statutory Contributions – Cost Matrix
| Component | Rate (% of Gross Pay) | Cost Driver |
|---|---|---|
| Pension Fund | 28 % | Retirement security |
| Health Insurance | 6 % | Universal healthcare |
| Work‑Injury Insurance | 0.1 – 1 % | Industry risk profile |
| Total On‑Cost Range | 34.1 – 35 % | Added to every BYN of base |
- Strategic takeaway: Gross‑to‑net budgeting must account for a one‑third uplift in employer outlay, before any discretionary perks are added.
Voluntary Benefits & Retention Levers
- Common add‑ons
- Performance‑linked cash bonuses (5 – 15 % of annual base).
- Transport or remote‑work stipends, mitigating commuting costs.
- Private medical top‑ups and wellness allowances in IT and finance verticals.
- Retention rationale
- Enhances total reward without inflating fixed payroll—a hedge against cyclical revenue swings.
Synthesised Impact Grid
| Influence Factor | Direct Wage Effect | Sector Most Affected | Time Horizon |
|---|---|---|---|
| Minimum‑Wage Hike | ▲ Bottom‑quartile pay | Retail, Farming, Services | Immediate |
| Labour Shortage | ▲ Market‑rate offers | IT, Construction, Healthcare | Ongoing |
| Inflation Control | ► Stabilises demands | Economy‑wide | Medium‑term |
| Employer On‑Costs | ▲ Total labour spend | All payroll‑intensive firms | Continuous |
Key Insights for 2025 Workforce Strategy
- Budget for a 6 – 9 % nominal raise pool simply to maintain real earnings after statutory and inflationary moves.
- Layer performance‑based pay to align labour cost growth with productivity gains.
- Audit internal equity quarterly; wage compression risks surge post‑minimum‑wage adjustment.
- Leverage non‑cash benefits to differentiate offers in a talent‑scarce marketplace.
7. Comparison of Salary Levels with Neighboring Countries
A regional salary comparison enables deeper insights into Belarus’s labor market positioning within Eastern Europe. By contrasting average monthly wages across Belarus and its bordering nations, businesses and policymakers can better assess the country’s cost-competitiveness, talent mobility, and economic appeal for foreign investment.
Average Monthly Wages in Belarus and Neighboring Countries (2025 Estimate)
| Country | Average Monthly Wage (USD) | Economic Status | EU Membership |
|---|---|---|---|
| Lithuania | $2,122 | Developed EU economy | Yes |
| Poland | $2,066 | High-income EU member | Yes |
| Russia | $1,256 | Upper-middle-income (non-EU) | No |
| Belarus | $703 | Upper-middle-income | No |
| Ukraine | $574 | Lower-middle-income | No (EU candidate) |
Note: Wage figures are estimated average gross monthly salaries expressed in USD equivalents based on 2025 projections and available macroeconomic sources.
Key Observations from Regional Salary Comparisons
- Belarus ranks in the mid-tier of the region:
- Its average wage of $703 positions it above Ukraine, but significantly below EU members and Russia.
- This suggests a transitional labor economy—cost-efficient yet increasingly modernized.
- Substantial wage gaps with EU neighbors:
- Lithuania and Poland offer wages three times higher than Belarus.
- This reflects differences in:
- Productivity and technological integration
- EU labor protections and wage regulation
- Broader macroeconomic development
- Slight disadvantage relative to Russia:
- Russia’s higher wage level of $1,256 may reflect:
- Larger natural resource-based industries
- High compensation in metropolitan hubs like Moscow
- Stronger currency buffers and export earnings
- Russia’s higher wage level of $1,256 may reflect:
Salary Differential Index (Base: Belarus = 100)
| Country | Relative Index |
|---|---|
| Lithuania | 302 |
| Poland | 294 |
| Russia | 179 |
| Belarus | 100 |
| Ukraine | 82 |
This indexed view highlights that workers in Lithuania earn over 3× more than the average Belarusian salary in nominal USD terms.
Strategic Implications for Stakeholders
- For Foreign Investors:
- Belarus remains a cost-competitive location for manufacturing, IT outsourcing, and shared services, especially when targeting price-sensitive operations.
- However, talent migration risk to higher-wage countries (particularly Lithuania and Poland) needs proactive retention strategies.
- For Local Policymakers:
- The regional wage lag underscores the need for:
- Structural productivity reforms
- Infrastructure modernization
- Sectoral wage alignment with EU standards
- The regional wage lag underscores the need for:
- For Employers and HR Planners:
- Competitive salary benchmarking must account for cross-border wage awareness, especially in IT, logistics, and engineering sectors.
- Wage expectations may rise due to regional mobility and remote work availability.
Visualisation: Average Wage Comparison (USD per Month, 2025)
| Country     | USD |
|-------------|-----|
| Lithuania   | ██████████████████████████████ $2,122
| Poland      | ████████████████████████████   $2,066
| Russia      | ████████████████               $1,256
| Belarus     | ████████                       $703
| Ukraine     | █████                         $574
8. Cost of Living and Real Income Analysis
A holistic assessment of salary levels in Belarus for 2025 necessitates a detailed examination of the country’s cost of living and the corresponding real income available to its population. Nominal wages, when viewed in isolation, fail to capture the true economic experience of workers. It is the purchasing power—real income after accounting for living expenses and inflation—that determines actual financial well-being.
Overview of Cost of Living in Belarus (April 2025)
Belarus remains one of the more affordable countries in the Eastern European region. The Cost of Living Index, which quantifies the average level of essential expenses, stands at 26.4 as of April 2025. This index reflects the relative affordability of Belarus compared to more developed economies.
Key Components of Monthly Living Costs (Minsk – April 2025)
| Category | Estimated Cost (BYN) | USD Equivalent (Approx.) |
|---|---|---|
| Rent – City Center (1-Bedroom) | 1,272.86 | $368 |
| Rent – Outside Center (1-Bedroom) | 806.64 | $233 |
| Utilities (915 sq ft apartment) | 179.42 | $52 |
| Internet | 26.87 | $8 |
| Public Transportation Pass | 69.00 | $20 |
| Weekly Groceries (1 person) | ~90 – 225 BYN | $25 – $65 |
Data based on estimates for Minsk; rural and smaller urban areas likely exhibit lower costs.
Comparative Affordability Across Eastern Europe
| Country | Cost of Living Index | Avg. Monthly Net Salary (USD) |
|---|---|---|
| Lithuania | 54.1 | $1,765 |
| Poland | 51.9 | $1,690 |
| Belarus | 26.4 | $518 (approx.) |
| Ukraine | 29.7 | $440 |
| Russia | 38.5 | $963 |
Sources: Numbeo, National Statistics, IMF 2025 estimates
Real Income Trends and Household Purchasing Power
Net Wages and Disposable Income:
- The average net salary after taxes in Belarus as of Q2 2025 is estimated at 1,681.38 BYN, equivalent to ~$518 USD.
- When compared against local living expenses, this income can support a modest yet adequate lifestyle, especially in secondary cities or rural regions.
Real Disposable Income Growth (2024–2025):
| Period | % Increase (Real Disposable Income) |
|---|---|
| January 2025 vs January 2024 | +13.8% |
| Q1 2025 vs Q1 2024 | +12.0% |
- These figures reflect a substantive year-on-year improvement in household economic conditions.
- Growth in real disposable income implies that wage increases have exceeded inflation, resulting in greater financial flexibility for most citizens.
Practical Affordability: Living on $500–$1000 USD Monthly
According to anecdotal and market data:
- A monthly income of $500–$700 USD can cover essential living costs (housing, food, utilities, and transportation) for a single person in Minsk, provided that lifestyle expectations are moderate.
- In smaller cities or towns, $400–$600 USD may suffice due to significantly lower rental and utility costs.
Real Income vs. Nominal Wage – Implications
| Metric | Nominal Value | Adjusted for Inflation (Real) |
|---|---|---|
| Avg. Monthly Gross Wage | BYN 2,601.8 (March 2025) | Real wage index: ~111.8% YoY |
| Net Take-home Pay | BYN 1,681.38 | Disposable income +12% YoY |
- While nominal wages rose modestly, real wages and disposable income posted double-digit growth, suggesting a tangible improvement in purchasing power.
- This may positively affect domestic consumption, savings behavior, and long-term household financial resilience.
Conclusion: Assessing Income Adequacy in Belarus (2025)
- Belarus’s low cost of living provides crucial context to its comparatively modest salary levels, allowing for reasonable affordability across most essential services.
- Continued increases in real disposable income signal a gradual enhancement of living standards, particularly if inflation remains under control.
- For both employers and policymakers, understanding the interaction between wages and living costs is essential for designing equitable compensation frameworks and ensuring sustainable economic growth.
9. Future Outlook
Forward‑Looking Salary Outlook (2025 → 2027)
- The Belarusian wage landscape is set to evolve under the push‑and‑pull of moderate GDP expansion, inflation management, and deepening labour shortages in high‑skill verticals.
- The illustrative line chart above models a real‑wage index (2025 = 100) for key sectors, signalling differentiated growth trajectories through 2027.
Macro & Labour‑Market Catalysts
| Driver | 2025 Status | Projected Direction to 2027 | Effect on Wages |
|---|---|---|---|
| GDP Growth | 2.8 – 4.1 % range (IMF vs Gov.) | Gradual acceleration (3‑4 %) | ↑ Broad‑based hiring, wage lift |
| Inflation Target | ≤ 5 % | Moderating toward 4 % | → Maintains real‑wage gains |
| Minimum‑Wage Policy | BYN 726 floor (↑ 31 %) | Indexed annually to CPI | ↑ Bottom‑quartile compression |
| Labour Shortage (STEM, Trades) | Acute (unemployment 2.8 %) | Likely to intensify | ↑ Premiums in IT, construction |
| International Sanctions Impact | Manageable but persistent | Gradual easing scenario | → Mixed; capex decisions surge |
| Employer On‑Cost Burden | 34 – 35 % of gross pay | Stable | → Encourages variable pay use |
Sector‑Specific Wage Trajectory (Illustrative Projections)
| Sector | Avg. Nominal Wage 2025 (BYN/mo) | 2026 Nominal Growth | 2027 Nominal Growth | 3‑Year Real Wage Δ |
|---|---|---|---|---|
| IT | 8 800 – 10 500 | +12 % | +10 % | +23 % |
| Construction | 2 713 | +10 % | +7 % | +15 % |
| Manufacturing | 2 344 – 3 490 | +9 % | +6 % | +12 % |
| Retail | 2 283 | +6 % | +5 % | +9 % |
| Agriculture | 1 933 | +7 % | +5 % | +10 % |
Nominal projections assume inflation stabilises at 4 – 5 %; real‑wage delta derived from CPI‑adjusted gains.
Scenario Matrix – Wage Pressure Intensity
| Scenario | Inflation ≤ 4 % | GDP > 3 % | Skill Shortage | Sanction Ease | Net Wage Pressure |
|---|---|---|---|---|---|
| Optimistic | ✅ | ✅ | ✅ | ✅ | High |
| Baseline | ✅ | ✅ | ✅ | ❌ | Moderate‑High |
| Stagflation Risk | ❌ | ❌ | ✅ | ❌ | Low‑Moderate |
| External Shock | ❌ | ❌ | ❌ | ❌ | Low |
Strategic Playbook for 2025‑2027
- Employers
- Budget 6 – 10 % annual raise pools in growth sectors; blend fixed and variable pay to curb cost spikes.
- Deploy retention levers—remote options, skilling programmes, performance equity—to guard against outbound talent flow to EU markets.
- Investors
- Leverage Belarus’s cost‑effective but upskilling labour force for near‑shore hubs; hedge exposure with currency‑inflation safeguards.
- Policy Makers
- Sustain inflation discipline to lock in real‑wage momentum.
- Expand vocational and digital education pipelines to ease sectoral shortages.
Key Takeaways
- Real income is poised to climb if inflation remains under control and GDP growth meets projections.
- IT will continue to outpace all other sectors, potentially hitting a real‑wage index of 123 by 2027.
- Sectors reliant on low‑skill labour (retail, parts of agriculture) will see slower wage lift, although minimum‑wage escalators provide a safety net.
- Sanction dynamics remain the wild card—loosening could unlock fresh FDI, whereas tightening would dampen wage growth.
Conclusion
The salary landscape in Belarus in 2025 presents a multifaceted portrait shaped by macroeconomic dynamics, sector-specific performance, government policy, and international comparisons. This in-depth analysis has revealed that while average nominal wages in Belarus remain modest by regional standards—estimated at approximately BYN 2,601.8 (USD 703) per month as of March 2025—the economic environment is undergoing gradual shifts that may pave the way for more competitive compensation structures across various industries.
At the national level, wage trends are being influenced by a combination of inflation control measures, minimum wage adjustments, and relatively low unemployment rates. The government’s decision to raise the minimum wage to BYN 726 per month, effective January 1, 2025, has already begun to exert upward pressure on wages at the lower end of the pay scale, particularly in sectors reliant on low-skilled labor such as agriculture and retail. This policy, coupled with labor shortages in key industries like information technology, manufacturing, and construction, has introduced wage competitiveness into Belarus’s labor market, prompting businesses to rethink compensation strategies.
One of the most notable trends in 2025 is the divergence in salary levels across industries. The IT sector continues to dominate the high-income bracket, with software engineers and technology specialists earning significantly above the national average. This sectoral leadership is largely attributed to international demand for digital expertise and the high value-added nature of tech-based work. In contrast, industries such as agriculture, transportation, and some service roles still offer comparatively lower wages, although real income levels have improved due to a stable cost of living.
The cost of living in Belarus remains relatively low in comparison to neighboring European Union countries, which enhances the real purchasing power of domestic wages. As of early 2025, average monthly rent, utility, and grocery expenses in urban centers like Minsk are still manageable for middle-income earners. This has contributed to an increase in real household disposable income—up 12 percent in Q1 2025 compared to the same period in 2024—indicating a positive trend in household financial well-being. Nonetheless, sustained improvement in real wages will depend heavily on the government’s ability to maintain inflation at or below its target threshold of 5 percent.
When benchmarked against neighboring countries, Belarus offers a unique position in the regional labor market. While it trails behind the European Union members such as Poland and Lithuania in terms of average wages, it remains cost-effective for businesses looking for skilled labor at competitive rates. Belarusian salaries are higher than those in Ukraine but still fall short when compared to Russia, which continues to serve as a major economic comparator.
Furthermore, regional disparities in wage levels across Belarus—though not extensively detailed in the available data—are expected to persist. Urban centers like Minsk, with their higher concentration of multinational companies, IT hubs, and financial institutions, are likely to offer higher-than-average compensation, while rural areas may continue to lag due to limited industrial presence and slower economic activity.
Looking ahead, several factors will play a crucial role in shaping the future trajectory of salaries in Belarus. These include:
- Economic Growth: If GDP growth continues on a stable or upward path, it will likely support higher wage levels across a broader range of industries.
- Labor Market Dynamics: Ongoing labor shortages in skilled sectors will push employers to offer more attractive compensation packages to secure and retain talent.
- Inflation Trends: Real wage growth will remain dependent on the government’s success in controlling inflation and stabilizing consumer prices.
- Government Policies: Reforms in taxation, social contributions, and wage transparency could further influence salary structures.
- International Relations and Sanctions: Belarus’s geopolitical standing and potential changes in sanctions regimes could either unlock new investment or hinder wage growth depending on the direction of international engagement.
In conclusion, the salary levels in Belarus in 2025 reflect a nation at a crossroads of transition and opportunity. While wages are not yet on par with Western or even some Eastern European economies, the combination of a low cost of living, increasing real income, strategic government interventions, and growing sectoral demand provides a foundation for future improvements. For businesses and investors, Belarus offers a viable labor market with potential for growth, especially in knowledge-intensive and export-oriented industries. For workers, the evolving employment landscape signals expanding opportunities, particularly for those equipped with in-demand skills and professional experience.
As the Belarusian economy continues to adapt to both internal pressures and global trends, ongoing analysis and monitoring of wage patterns will be essential. By understanding the nuanced dynamics behind salary levels in Belarus, stakeholders can make more informed decisions—whether that be in workforce planning, policy design, investment strategy, or career development. The data-driven insights provided in this report serve as a strategic compass for navigating the complex yet promising future of the Belarusian labor market.
If you find this article useful, why not share it with your hiring manager and C-level suite friends and also leave a nice comment below?
We, at the 9cv9 Research Team, strive to bring the latest and most meaningful data, guides, and statistics to your doorstep.
To get access to top-quality guides, click over to 9cv9 Blog.
People Also Ask
What is the average monthly salary in Belarus in 2025?
The average monthly salary in Belarus in 2025 is approximately BYN 2,601.8, which equals around $703 USD, based on official government data.
Which industry offers the highest salaries in Belarus in 2025?
The IT sector offers the highest salaries in Belarus, with annual compensation for software engineers reaching up to $60,000 USD at top firms.
What is the minimum wage in Belarus in 2025?
As of January 1, 2025, the minimum wage in Belarus is set at BYN 726 per month, reflecting a government effort to raise income standards.
How do real wages compare to nominal wages in Belarus in 2025?
Real wages have increased in early 2025, indicating that income growth is slightly outpacing inflation, thus improving purchasing power.
What is the inflation rate in Belarus for 2025?
The IMF projects an inflation rate of 5.5% for Belarus in 2025, while the government aims to keep it under 5%.
What is the average salary in the IT sector in Belarus in 2025?
IT professionals in Belarus earn between $30,000 to $60,000 USD annually, depending on experience, role, and employer.
How much do retail workers earn in Belarus in 2025?
Retail cashiers earn an average of BYN 9,085 annually, while store managers can earn up to BYN 2,164 monthly.
How do salaries in Belarus compare to those in Russia?
In 2025, Russia’s average monthly salary is about $1,256 USD, significantly higher than Belarus’s $703 USD average.
Is Belarus a cost-effective labor market for businesses?
Yes, Belarus offers competitive labor costs with relatively low average wages and a favorable cost of living index.
What is the unemployment rate in Belarus in 2025?
The unemployment rate in Belarus is low, recorded at around 2.8% in early 2025, indicating a tight labor market.
How much do bus drivers earn in Belarus in 2025?
Bus drivers in Minsk earn between BYN 12,000 and BYN 19,700 annually, averaging around BYN 1,500 monthly.
What is the average wage in the agriculture sector in Belarus?
Agricultural workers earn between BYN 1,884.5 and BYN 1,933.0 monthly, with technicians earning higher due to specialized skills.
Do wages differ by region in Belarus?
While detailed regional data is limited, wages in urban centers like Minsk are generally higher due to industry concentration and cost of living.
How much do accountants make in Belarus in 2025?
Accountants in Belarus earn between BYN 1,000 and BYN 3,000 monthly, depending on experience and employer size.
How do salaries in Belarus compare to those in Ukraine?
Belarusian salaries are slightly higher than in Ukraine, where the average monthly wage in 2025 is estimated at $574 USD.
What benefits do employers in Belarus typically offer?
Besides base salary, employers provide benefits such as bonuses, transportation allowances, and mandatory social contributions.
What is the average salary in the construction sector in Belarus?
Construction workers earn an average of BYN 2,712.7 monthly, with laborers earning between BYN 823 and BYN 2,571.
How much do production workers earn in Belarus in 2025?
Production workers in manufacturing earn between BYN 800 and BYN 2,500 per month, depending on the industry and location.
What is the average salary for marketing professionals in Belarus?
Marketing managers in Belarus earn between BYN 1,200 and BYN 3,500 per month in 2025.
How do employers calculate total labor costs in Belarus?
Employers factor in gross salary plus mandatory contributions for pensions, health insurance, and injury insurance.
Is real income rising in Belarus in 2025?
Yes, real disposable income increased by 12% in Q1 2025 compared to the same period in 2024, signaling improved household finances.
How much does it cost to live in Belarus in 2025?
The average cost of living index is around 26.4. Monthly rent in Minsk ranges from BYN 806 to BYN 1,272 depending on location.
Which manufacturing sub-sector pays the most in Belarus?
The mining and quarrying sub-sector leads manufacturing wages, averaging BYN 4,324.4 monthly in early 2025.
What is the average salary in the transportation sector in Belarus?
The average wage in the transport and logistics sector is BYN 2,384.3 per month, with variation by transport mode.
Do wages in Belarus keep up with inflation?
In early 2025, real wages have outpaced inflation, indicating that wage growth is helping to maintain purchasing power.
How much do web designers earn in Belarus?
Entry-level web designers with 1–2 years of experience earn around BYN 1,052 per month in 2025.
What are the most in-demand jobs in Belarus in 2025?
Jobs in IT, construction, transportation, and manufacturing are in high demand due to sectoral growth and labor shortages.
How is salary determined in Belarus?
Salaries are based on experience, education, industry, region, and employer size, along with compliance with the minimum wage.
What role does government policy play in salary trends?
Government policies on inflation, wage regulation, and labor standards influence salary trends and wage growth.
Is the labor market in Belarus competitive in 2025?
Yes, the labor market is competitive, especially in high-demand sectors, driving wage increases to attract skilled workers.
Sources
BelTA
Belstat
Levels.fyi
ERI Economic Research Institute
Foodcom S.A.
Trading Economics
Remote People
CEIC Data
Belsat
Paylab
WageIndicator Foundation
Take-Profit.org
Rivermate
Papaya Global
Engage Anywhere
Wise
Eulerpool
Playroll
Time Doctor
Talkpal
Quora
Globe Newswire
InvestigateBel
SB Belarus Today
Pozirk
International Monetary Fund (IMF)
EFG International
World Bank


