

Key Takeaways
- Salaries in New Zealand for 2026 show real wage growth, with pay increases outpacing inflation, but earnings vary significantly by industry, region, experience level, and skill demand.
- High-growth sectors such as technology, healthcare, education, construction, and agriculture are driving stronger salary benchmarks, while regional and demographic pay gaps continue to influence overall income distribution.
- Cost of living pressures, total reward packages, and long-term workforce trends toward 2030 are reshaping how employees and employers evaluate salary competitiveness and financial sustainability.
Understanding the salary landscape in New Zealand for 2026 has become more essential than ever for job seekers, employers, and policy planners alike. As the country continues to navigate economic shifts, labour market trends, and demographic transformations, having access to comprehensive and up-to-date salary data is vital for making informed career and business decisions.


In 2026, New Zealand’s labour market is experiencing the effects of several converging forces. These include steady wage growth across high-demand sectors, shifts in the cost of living, increased regional job mobility, and evolving expectations around non-salary compensation. With inflation gradually stabilising but housing and utility costs remaining elevated, understanding the real value of salaries across different regions, roles, and industries is a key priority for workers and employers.
This detailed salary guide breaks down the average and median earnings across sectors such as technology, healthcare, education, agriculture, construction, finance, and public service. It also provides insights into gender and ethnic pay gaps, CEO and executive compensation benchmarks, and changes in minimum wage rates. From Auckland to the West Coast, the disparities between urban and regional incomes reveal important dynamics shaping job decisions, remote work strategies, and workforce distribution.
Furthermore, this report explores how non-salary benefits such as flexible work arrangements, health coverage, and green incentives are becoming critical components of total reward packages. Employees in 2026 are no longer evaluating compensation based solely on take-home pay but are assessing financial wellness support, family benefits, and autonomy as part of a broader value proposition.
For businesses, understanding these evolving expectations is necessary for designing competitive salary offers, enhancing employee retention, and maintaining a strong employer brand. For workers, this guide offers clarity on salary benchmarks, projected wage growth to 2030, and cost-of-living adjustments that impact financial planning.
Whether you’re planning a career move, negotiating a pay rise, hiring talent, or conducting strategic workforce planning, this all-in-one salary guide provides a data-driven, region-specific, and future-focused look at New Zealand’s salary outlook in 2026.
Before we venture further into this article, we would like to share who we are and what we do.
About 9cv9
9cv9 is a business tech startup based in Singapore and Asia, with a strong presence all over the world.
With over nine years of startup and business experience, and being highly involved in connecting with thousands of companies and startups, the 9cv9 team has listed some important learning points in this overview of Salaries in New Zealand for 2026: A Complete Guide.
If your company needs recruitment and headhunting services to hire top-quality employees, you can use 9cv9 headhunting and recruitment services to hire top talents and candidates. Find out more here, or send over an email to hello@9cv9.com.
Or just post 1 free job posting here at 9cv9 Hiring Portal in under 10 minutes.
Salaries in New Zealand for 2026: A Complete Guide
- Macroeconomic Foundations and the Return of Real Wage Growth
- The Regulatory Framework: Minimum Wage and Immigration Thresholds
- Sectoral Analysis: Professional, Technical, and Service Industries
- Public Sector Benchmarking: Healthcare and Education
- Agriculture and Primary Industries
- Regional Salary Disparities and the Urban-Rural Divide
- Seniority, Experience, and the Career Lifecycle
- Demographic and Ethnic Inequities in the Wage Market
- Non-Salary Compensation: The Evolution of Total Rewards
- Cost of Living: The Context for Salary Sustainability
- Future Projections and Long-Term Trends to 2030
1. Macroeconomic Foundations and the Return of Real Wage Growth

New Zealand’s salary landscape in 2026 is being shaped by the return of real wage growth, a clearer economic outlook, and adjustments in workforce planning by employers. With inflation levels easing and salary increases staying steady, many workers across the country are beginning to see actual increases in purchasing power. This shift offers positive momentum for employees and employers alike as the country enters a new phase of post-inflation economic balance.
Resurgence of Real Wage Growth
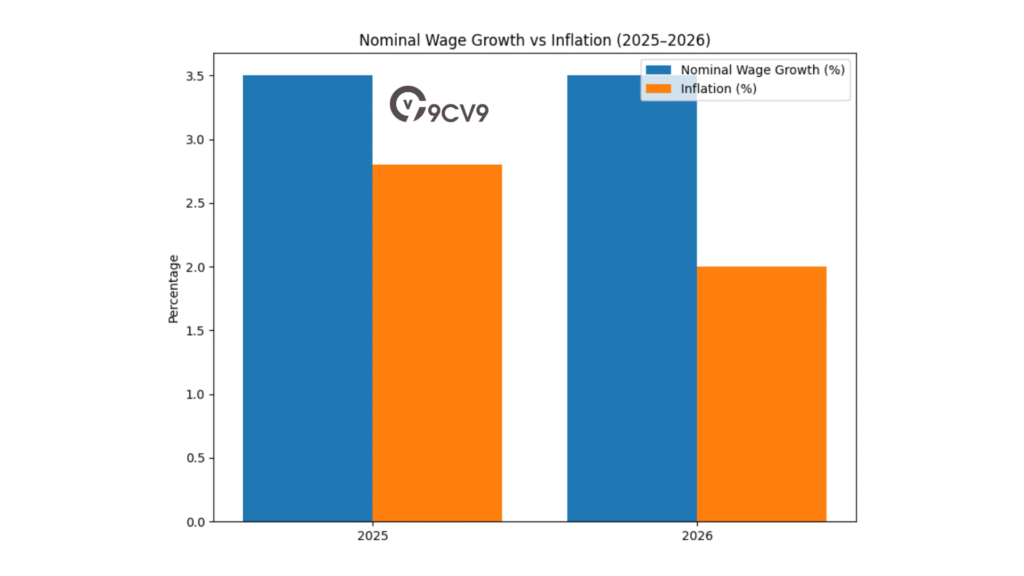
Employers in New Zealand are maintaining a consistent salary growth rate, estimated at 3.5% in 2026. What makes this rise meaningful is the parallel drop in inflation, expected to settle near 2.0%, which allows employees to retain more of their earnings in real terms. This marks a significant departure from recent years, where rising consumer prices had often outpaced wage growth.
The increase in real wages is not just a financial win for workers—it reflects strategic decision-making by employers. Many companies are now focused on long-term workforce planning, talent retention, and addressing persistent skills shortages, especially in key industries like healthcare, tech, and construction.
Improved Economic Outlook
New Zealand’s overall economic conditions are showing moderate but stable improvement. After growing just 0.7% in 2025, the country’s GDP is projected to expand by up to 1.8% in 2026. Lower interest rates are expected to support this rebound, particularly as many households transition from higher mortgage rates to more affordable ones.
At the same time, unemployment remains relatively high, ranging from 5.1% to 5.3%. While this reflects some ongoing slack in the labor market, it has also created more flexibility for employers. The urgency of the “talent war” seen in past years has cooled, giving organizations the space to take a more strategic, data-driven approach to hiring and pay structures.
National Economic and Salary Forecast for 2025–2026
The following table provides a clear view of key national indicators and projected wage benchmarks across New Zealand:
Table: National Economic and Earnings Indicators in New Zealand (2025–2026)
| Indicator | 2025 Measured Value | 2026 Projected Value | Alignment and Insight |
|---|---|---|---|
| Median Annual Salary | $69,836 | $72,280 (Est. +3.5%) | Shows stable nominal growth with real wage gains |
| Average Annual Salary | $81,484 | $84,335 (Est. +3.5%) | Reflects continued rise across skilled occupations |
| Median Hourly Rate | $34.25 | $35.45 | Hourly pay continues to track overall inflation |
| Consumer Price Inflation | 2.8% (Dec 2025) | 1.7% – 2.0% | Inflation forecast supports real wage growth |
| Unemployment Rate | 5.4% (Dec 2025) | 5.1% – 5.3% | Signals mild slack in labor market |
| GDP Growth | 0.7% – 1.0% | 0.9% – 1.8% | Positive economic rebound underway |
| Official Cash Rate (OCR) | 2.25% | 2.25% (Trough) | Reflects continued accommodative monetary policy |
Decade-Long Trends in Wage Growth
Looking at the broader historical context, wage growth in New Zealand has been strong over the past decade. From 2015 to 2025, the median salary grew by approximately 52.6%, rising from $45,760 to nearly $70,000. This growth has far outpaced cumulative inflation over the same period, which ranged between 30% and 35%.
This wage increase suggests a real income growth of around 15% to 20% across the workforce, indicating long-term improvement in living standards for many New Zealanders despite temporary economic disruptions during the COVID-19 years and post-pandemic inflationary pressures.
Table: Wage Growth vs. Inflation (2015–2025)
| Year | Median Annual Salary | Cumulative Salary Growth | Estimated Cumulative Inflation | Real Wage Gain Estimate |
|---|---|---|---|---|
| 2015 | $45,760 | – | – | – |
| 2025 | $69,836 | +52.6% | +30% to +35% | +15% to +20% |
Key Insights for Employers and Job Seekers
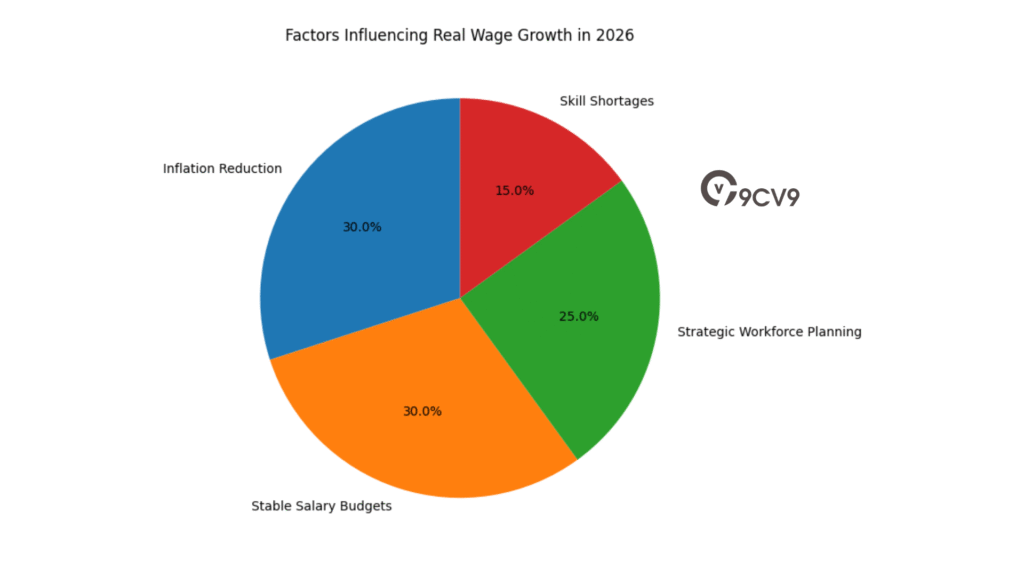
- Employers are using stable salary budgets to stay competitive and retain top talent while preparing for long-term growth.
- The reduction in inflation means more purchasing power for employees, especially in lower and mid-income bands.
- Strategic hiring practices are replacing urgency-based recruitment, promoting better alignment between business needs and workforce capabilities.
- Job seekers can expect greater transparency in salary offers and improved negotiating power, particularly in high-demand sectors.
This evolving salary landscape in 2026 reflects a balanced environment in which both employers and workers can make better decisions. Real wage growth, stable economic indicators, and a gradual labor market recovery are all working together to shape a more sustainable and opportunity-rich future in New Zealand’s employment market.
2. The Regulatory Framework: Minimum Wage and Immigration Thresholds
In 2026, the New Zealand government has introduced important updates to its wage and immigration regulations. These changes are designed to support workers with rising living costs while helping businesses maintain financial stability. The new framework ensures a careful balance between protecting low-wage earners and avoiding excessive pressure on small and medium-sized enterprises.
Government Policy on Wage Adjustments
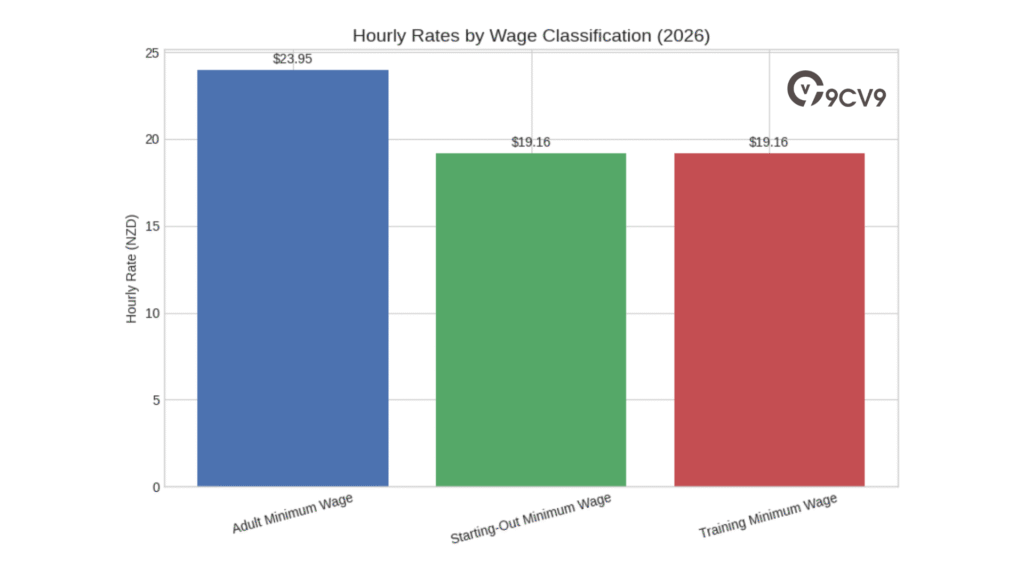
From April 1, 2026, the adult minimum wage will rise by 2.0%, moving from $23.48 to $23.95 per hour. This increase reflects a more measured approach compared to the sharp wage hikes seen earlier in the decade. By adopting smaller annual changes, the government aims to provide better financial planning predictability for businesses while offering low-income workers more security amid the ongoing cost-of-living challenges.
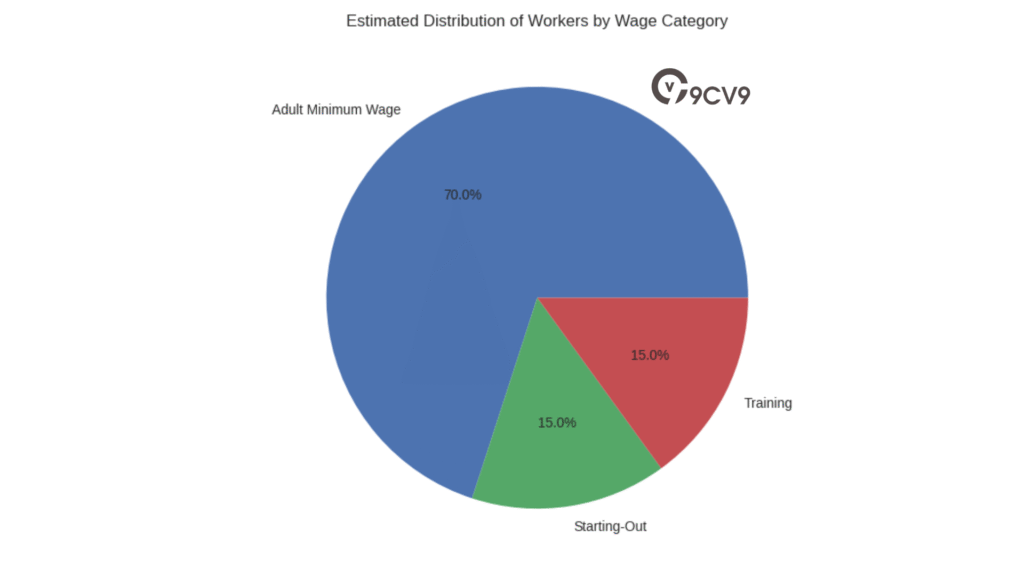
Approximately 122,500 workers across the country are expected to benefit directly from this wage rise. Many of these employees are part of the retail, hospitality, and support service sectors, where minimum wage roles are more common.
At the same time, businesses—especially SMEs—are managing other rising costs, such as infrastructure maintenance and increasing insurance premiums. The government’s approach considers these factors, avoiding sudden shocks to payroll budgets that could result in job losses or reduced hiring capacity.
Breakdown of New Wage Classifications
New Zealand’s wage legislation outlines several statutory minimum wage categories based on employment status and training conditions. Each category has its own pay structure and eligibility criteria. The table below presents the updated wage tiers that take effect from April 1, 2026.
Table: Statutory Wage Rates in New Zealand (Effective April 1, 2026)
| Wage Classification | Hourly Rate | Weekly Pay (40 Hours) | Annual Gross Salary |
|---|---|---|---|
| Adult Minimum Wage | $23.95 | $958.00 | $49,816.00 |
| Starting-Out Minimum Wage | $19.16 | $766.40 | $39,852.80 |
| Training Minimum Wage | $19.16 | $766.40 | $39,852.80 |
These classifications serve specific groups:
- Adult Minimum Wage: Applies to all workers aged 18 and over, and to any employees—regardless of age—who supervise or train others.
- Starting-Out Wage: This rate is intended for 16 and 17-year-olds during their first six months of continuous employment.
- Training Wage: This applies to employees aged 20 or older who are participating in formal workplace training that results in at least 60 credits per year.
These wage definitions ensure that younger or less experienced workers still earn fair compensation while undergoing structured development or early career transitions.
Connection to Immigration and Visa Policies
The wage changes for 2026 also impact New Zealand’s Accredited Employer Work Visa (AEWV) scheme. Immigration New Zealand has set a new requirement that all roles offered to migrant workers under this scheme must comply with the updated minimum wage rates.
As of April 1, 2026, any job offer used for a visa application must meet or exceed the new adult minimum wage threshold of $23.95 per hour. This update places a firm obligation on employers to review all job advertisements, employment contracts, and salary letters associated with AEWV applications.
Failure to comply with these wage conditions can result in immediate visa rejections. For employers relying on migrant labor, this means timely audits and updates are essential to avoid disruptions in recruitment pipelines and ensure legal compliance.
Table: AEWV Compliance Summary (Effective from April 1, 2026)
| Policy Element | Minimum Requirement | Notes |
|---|---|---|
| AEWV Minimum Hourly Pay | $23.95 | Matches adult minimum wage |
| Visa Application Eligibility | Role must meet threshold | Applies to all offers submitted from April 1 |
| Contract and Offer Letter Requirements | Must reflect new wage | HR teams must verify documents for compliance |
Strategic Considerations for Employers
Businesses are now expected to align their compensation frameworks with both domestic wage laws and immigration rules. This dual requirement makes it crucial for HR departments to stay updated and proactive in adjusting payroll systems, training programs, and offer templates.
Employers should also take the following steps:
- Audit current employment contracts for compliance
- Adjust job advertisements and internal pay grades
- Train hiring managers on new wage rules
- Coordinate with legal and immigration advisors for AEWV-related cases
By staying ahead of these regulatory changes, organizations can protect their hiring pipelines, avoid legal penalties, and continue attracting talent from both local and international markets.
The 2026 updates serve as an important reminder that wage policies are closely tied to broader labor strategies and immigration frameworks, especially in a globalized economy like New Zealand’s.
3. Sectoral Analysis: Professional, Technical, and Service Industries
a. Technology and Digital Transformation
The salary structure in New Zealand for 2026 is shaped by the rapid evolution of industry-specific demands. The market does not function uniformly; instead, it operates through a network of smaller, skill-driven segments. These salary segments are influenced by digital transformation, skill shortages, and the emergence of high-demand job functions, particularly in sectors like technology, professional services, and construction.
Labour Force Expansion and Demand for Skilled Talent
Employment in New Zealand is projected to grow significantly, with an estimated addition of 471,500 workers by 2026. This growth is largely concentrated in sectors that require advanced technical skills. Professional services, business consulting, digital infrastructure, and engineering-based construction are among the fastest-growing areas.
Industries are actively investing in workforce transformation, where job roles are evolving alongside the implementation of emerging technologies. The demand for highly skilled professionals—especially in IT and business services—is creating sharp wage differentiation within the same occupational groups.
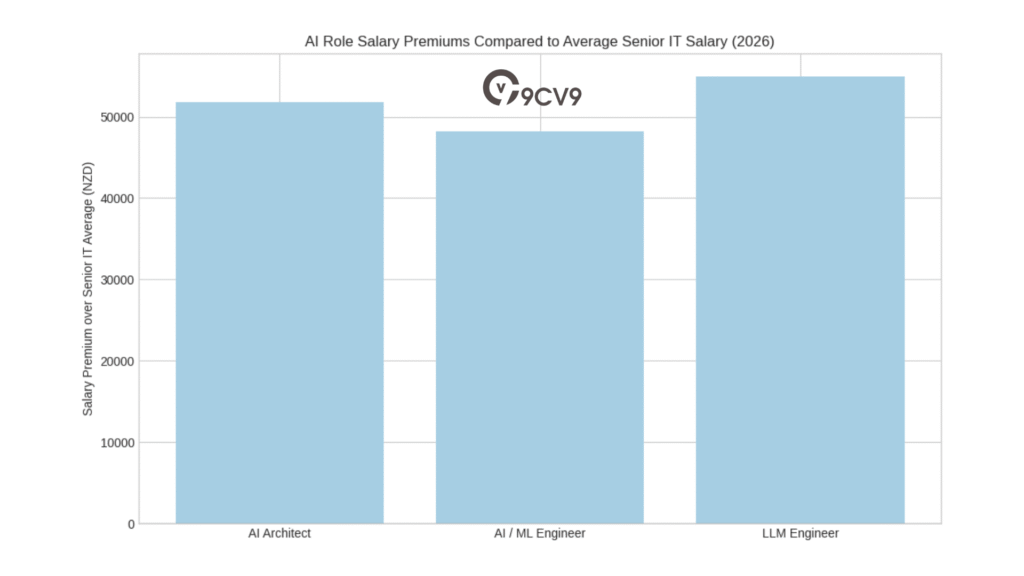
Technology Sector: The Rise of the AI-Driven Economy
One of the most noticeable shifts in 2026 is the emergence of the “AI Premium” in tech salaries. While general IT roles have reached stable salary levels, companies are now paying substantial premiums—typically between 20% to 30% above the standard range—for talent in Artificial Intelligence, Machine Learning, and Data Science.
According to industry reports, 87% of IT leaders in New Zealand are prepared to offer elevated salary packages for professionals with AI-related expertise. This includes roles focused on AIOps, Large Language Model (LLM) engineering, and AI infrastructure development.
The talent shortage in this domain is a global issue, with over 4 million AI-related roles currently unmet worldwide. New Zealand’s local market reflects this trend, leading to rapid salary growth and increased competition for advanced tech talent.
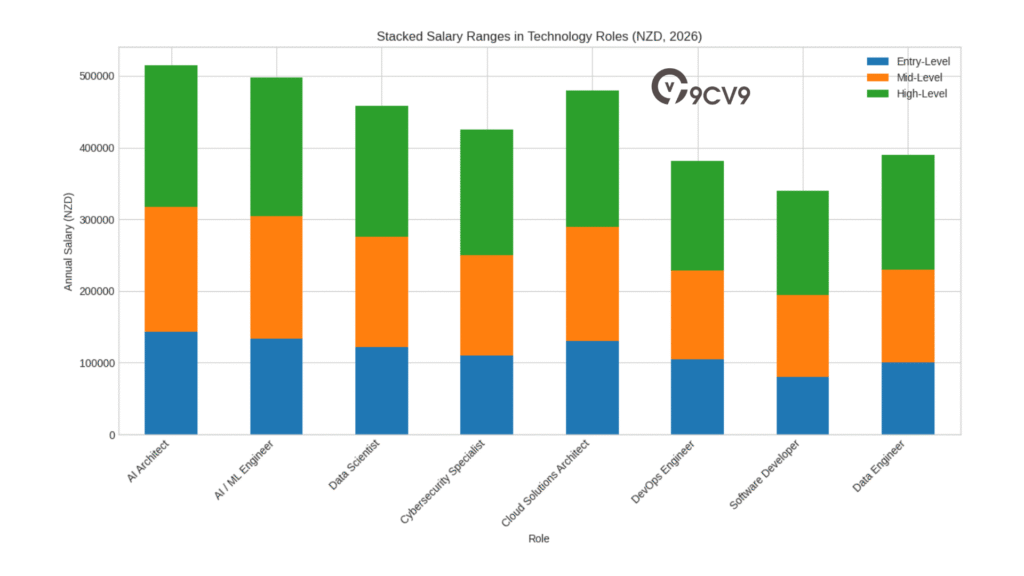
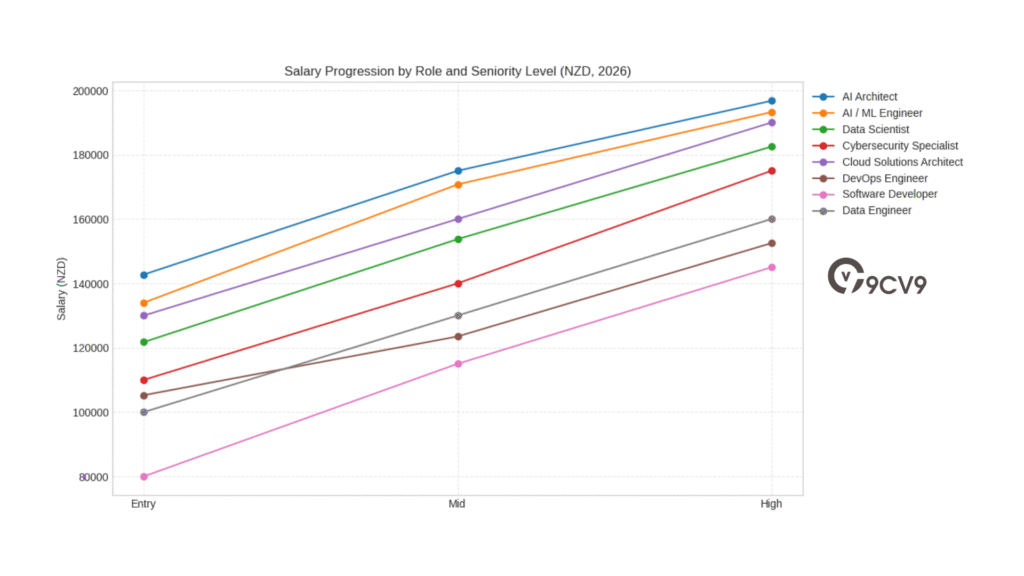
Table: Median Annual Salary Benchmarks in Technology Roles (NZD, 2026)
| Technology Role | Entry-Level (Low) | Mid-Level (Experienced) | High-Level (Specialized/Lead) |
|---|---|---|---|
| AI Architect | $142,750 | $175,000 | $196,750 |
| AI / ML Engineer | $134,000 | $170,750 | $193,250 |
| Data Scientist | $121,750 | $153,750 | $182,500 |
| Cybersecurity Specialist | $110,000 | $140,000 | $175,000 |
| Cloud Solutions Architect | $130,000 | $160,000 | $190,000 |
| DevOps Engineer | $105,250 | $123,500 | $152,500 |
| Software Developer | $80,000 | $115,000 | $145,000 |
| Data Engineer | $100,000 | $130,000 | $160,000 |
Emerging Roles: AIOps and LLM Engineering
New job titles are also entering the scene, including AIOps Engineers and LLM Engineers—roles that focus on the integration of AI into IT operations and the development of Large Language Model applications. These positions often involve skills like prompt engineering, system scaling, and advanced monitoring frameworks.
Because of their complexity and relevance to AI-driven systems, these professionals are among the highest-paid in the tech domain in 2026. These roles also bring a new layer of strategic influence within companies, as they directly impact automation efficiency and predictive analytics capabilities.
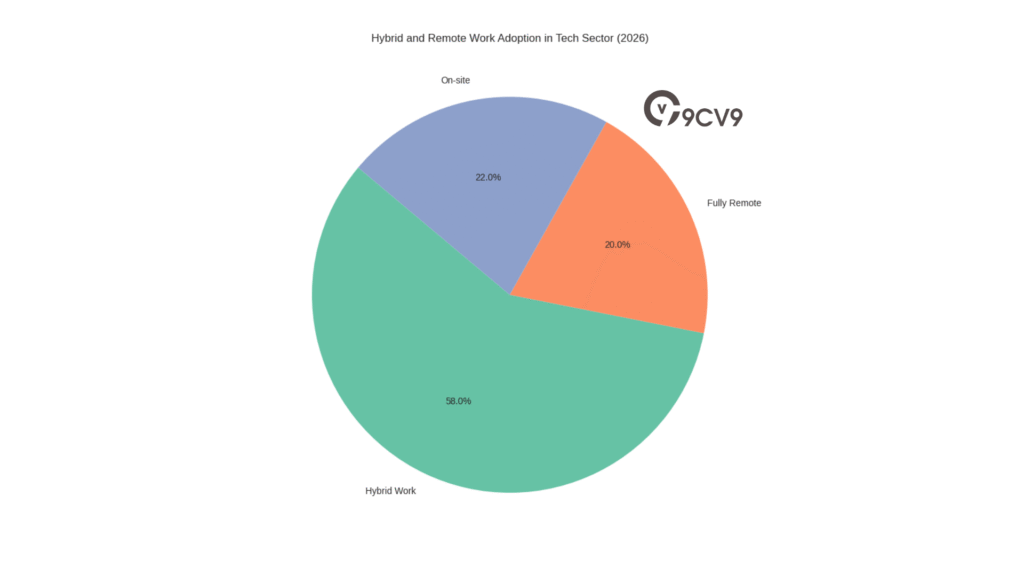
Hybrid Work as a Standard in the Tech Industry
Workplace flexibility continues to play a vital role in shaping employment offers. As of 2026, about 78% of professionals in New Zealand’s tech sector operate under hybrid or fully remote work models. This trend is no longer seen as a fringe benefit—it has become a baseline expectation.
Employers that fail to offer flexibility in work location often struggle to attract or retain skilled talent. In fact, flexible arrangements have become as important as salary when candidates evaluate job opportunities in the tech field.
Conclusion: Competitive Edge Through Sectoral Adaptation
New Zealand’s salary dynamics in 2026 show a clear shift toward specialization and sector-specific salary premiums. The professional and technology sectors are leading in wage growth, driven by global demand for talent and the adoption of advanced technologies.
Organizations that align their salary structures with these evolving sector benchmarks—while also offering hybrid work models—will have a competitive advantage in attracting and keeping top talent. The years ahead are expected to see even further salary segmentation, particularly in fields where innovation, digital skills, and real-time decision-making continue to shape the future of work.
b. Finance, Accounting, and Insurance
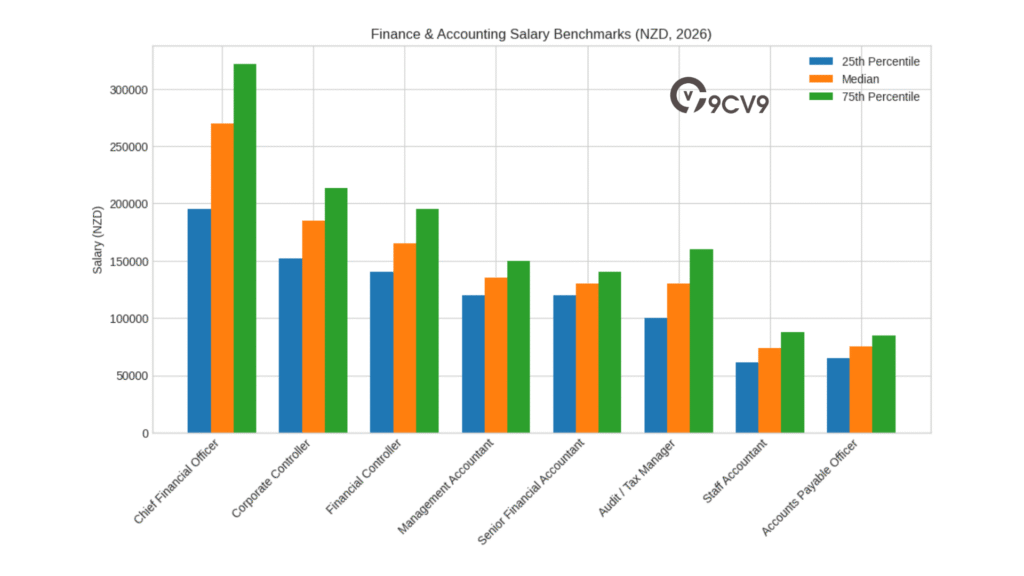
The finance, accounting, and insurance sectors in New Zealand are undergoing a wave of transformation in 2026. This shift is largely being driven by new regulatory requirements, growing complexities in global compliance, and the increasing need for highly trained financial professionals across all business sizes. As a result, salary growth in these industries is expected to remain strong, particularly for roles tied to audit, tax, risk, and financial control.
Regulatory Compliance Fueling Demand and Wage Increases
With tighter financial reporting rules and evolving international accounting standards, businesses are relying more heavily on finance professionals who can manage audits, ensure regulatory compliance, and support governance. These pressures have led to strong salary growth, particularly in public accounting. Positions such as tax and audit managers are among the fastest-growing in pay, with expected increases averaging around 3.7% in 2026—the highest within the broader financial services industry.
Organizations are not only looking for experienced accountants but are also investing in their internal financial infrastructure, making roles like financial controllers and management accountants essential in planning, budgeting, and cost control.
Table: Finance and Accounting Salary Benchmarks (NZD, 2026 Median Annual)
| Position | 25th Percentile | 50th Percentile (Median) | 75th Percentile |
|---|---|---|---|
| Chief Financial Officer | $195,500 | $269,750 | $321,750 |
| Corporate Controller | $152,000 | $185,000 | $213,250 |
| Financial Controller | $140,000 | $165,000 | $195,000 |
| Management Accountant | $120,000 | $135,000 | $150,000 |
| Senior Financial Accountant | $120,000 | $130,000 | $140,000 |
| Audit / Tax Manager | $100,000 | $130,000 | $160,000 |
| Staff Accountant | $61,000 | $73,750 | $87,750 |
| Accounts Payable Officer | $65,000 | $75,000 | $85,000 |
Role of Qualifications and Certifications in Salary Differentiation
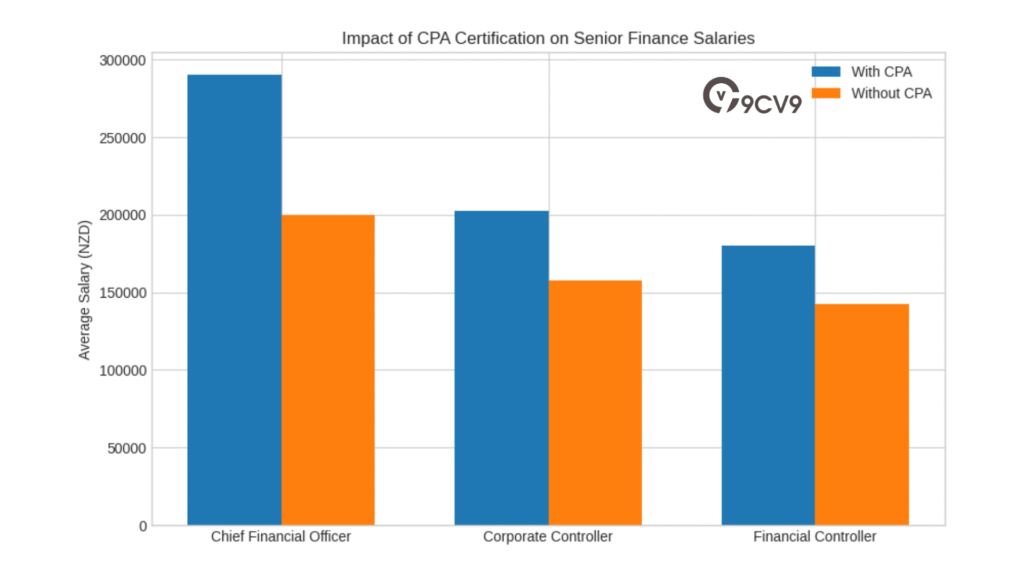
In 2026, professional certifications have become a key determinant of salary progression in New Zealand’s financial services sector. For instance, individuals holding a Chartered Professional Accountant (CPA) qualification or similar designation often see significantly higher compensation. Senior finance professionals with CPA credentials can expect annual earnings of over $200,000, especially in leadership roles such as CFO or Corporate Controller.
On the other hand, finance professionals without recognized certifications tend to have limited upward mobility in terms of salary. In most cases, their earning potential plateaus around $100,000, particularly if they lack experience in specialized functions such as international tax structuring or enterprise risk management.
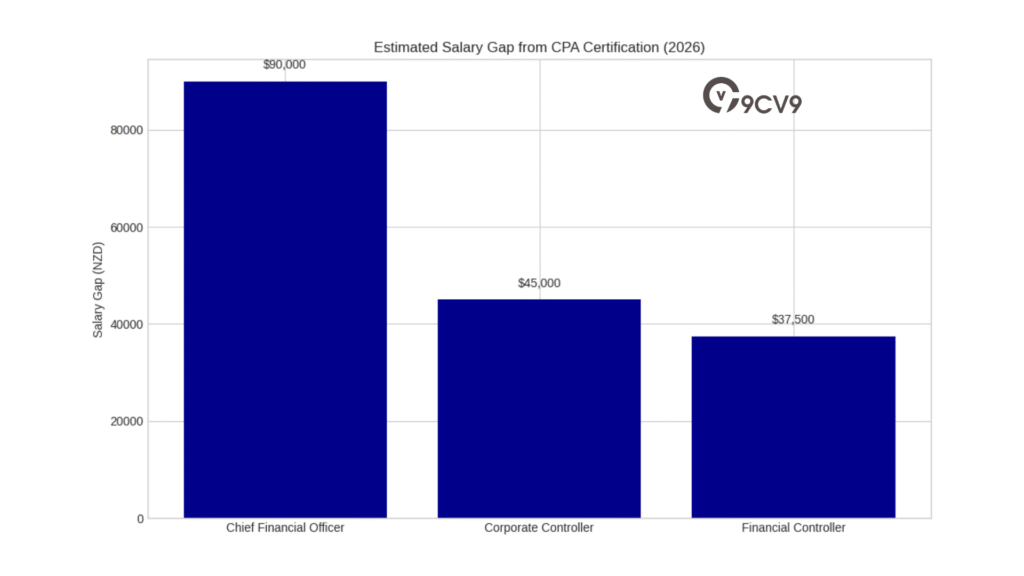
Matrix: Impact of CPA Certification on Senior Finance Roles
| Role | With CPA Certification | Without CPA Certification | Salary Gap Estimate |
|---|---|---|---|
| Chief Financial Officer | $260,000 – $320,000 | $180,000 – $220,000 | $60,000 – $100,000 |
| Corporate Controller | $190,000 – $215,000 | $145,000 – $170,000 | $45,000 – $55,000 |
| Financial Controller | $165,000 – $195,000 | $130,000 – $155,000 | $35,000 – $40,000 |
New Influences on Compensation Structures
As traditional salary bands become less effective in defining compensation for newly emerging roles, companies are increasingly relying on internal benchmarking. This includes assessing peer compensation across departments and evaluating organizational profitability. These metrics are especially relevant for hybrid positions that combine financial analysis, compliance, and digital transformation.
For example, roles involving fintech platforms or integrated ERP systems are being created without historical salary benchmarks, forcing employers to set pay scales based on internal salary architecture and performance expectations.
Conclusion: Navigating Salaries in Financial Services
In 2026, finance and accounting professionals in New Zealand are well-positioned to benefit from continued wage growth, provided they possess relevant qualifications and operate in roles aligned with regulatory importance or digital systems management. With global financial oversight becoming more stringent, the demand for skilled, certified financial experts is likely to grow even further.
Employers who aim to stay competitive in attracting and retaining top-tier talent must refine their salary structures and invest in upskilling their teams. Whether through CPA certification, internal benchmarking, or sector-specific role development, strategic compensation planning will be essential in navigating the evolving landscape of financial services.
c. Construction, Infrastructure, and Trades
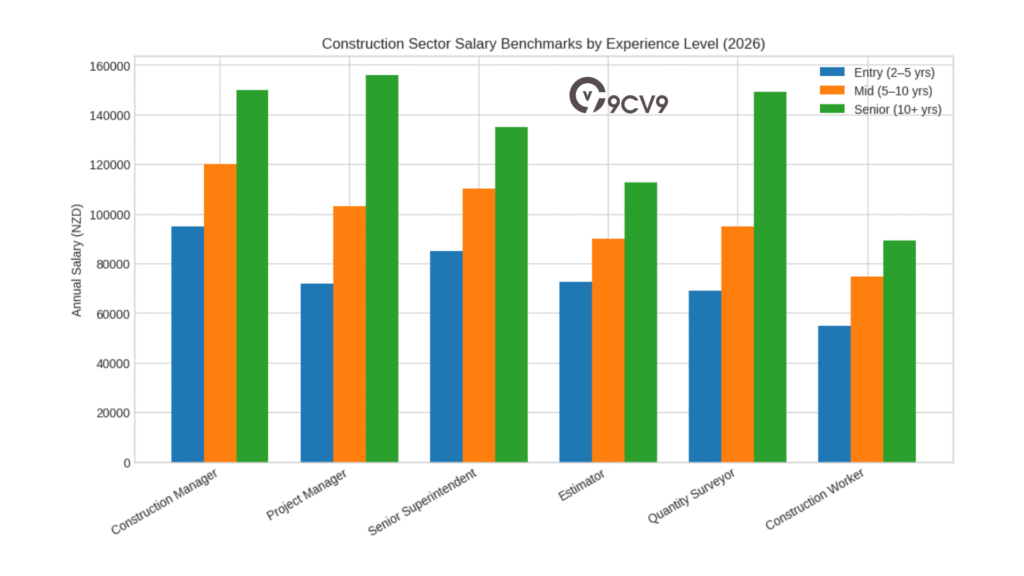
The construction, infrastructure, and skilled trades sector remains one of the most important contributors to New Zealand’s workforce and economic stability in 2026. This segment is experiencing steady employment expansion and competitive salary growth as demand continues for large-scale developments, skilled labor, and project leadership. With government-backed infrastructure spending and a persistent talent shortage, compensation trends in this industry reflect both urgency and opportunity.
Employment Growth and Sector Expansion
New Zealand’s construction and utilities workforce is projected to grow by around 2.2% annually in 2026. This increase is being fuelled by strategic government investments in essential infrastructure, transport, energy systems, and housing development. These projects have led to a greater need for qualified professionals who can manage budgets, timelines, compliance, and quality standards across various construction environments.
The current hiring climate is especially favorable for mid to senior-level professionals, including project managers, site supervisors, and quantity surveyors. Companies are offering structured compensation packages to retain top construction talent, particularly those with long-term project experience and technical qualifications.
Table: Construction Sector Salary Benchmarks in New Zealand (Median Annual NZD, 2026)
| Role | Entry Level (2–5 Years) | Mid Level (5–10 Years) | Senior Level (10+ Years) |
|---|---|---|---|
| Construction Manager | $85,000 – $105,000 | $105,000 – $135,000 | $135,000 – $165,000 |
| Project Manager (Construction) | $72,000 | $103,000 | $156,000 |
| Senior Superintendent | $75,000 – $95,000 | $95,000 – $125,000 | $125,000 – $145,000 |
| Estimator | $65,000 – $80,000 | $80,000 – $100,000 | $100,000 – $125,000 |
| Quantity Surveyor | $69,000 | $95,000 | $149,000 |
| Construction Worker (Trade) | $54,756 | $74,803 | $89,166 |
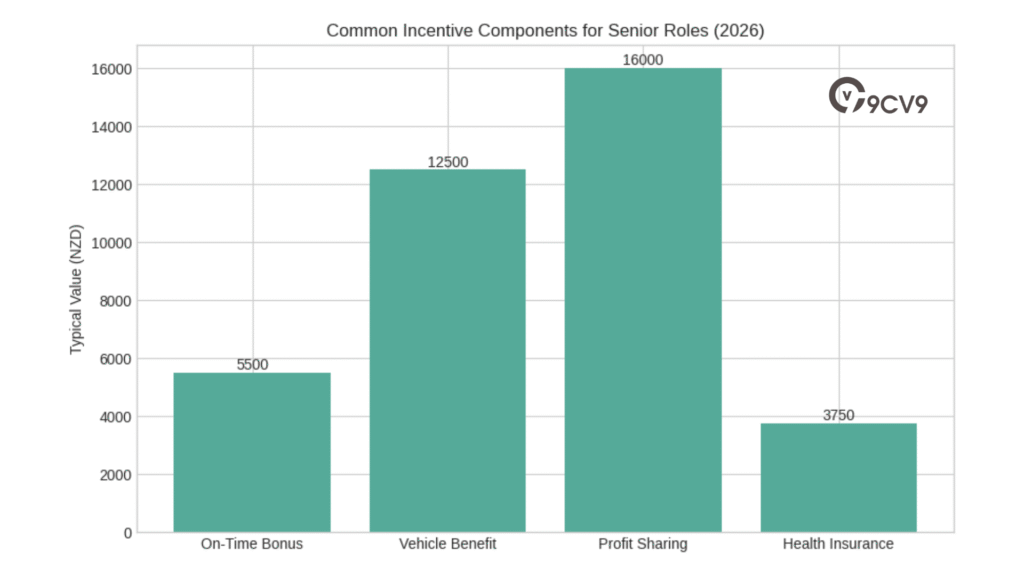
Incentive-Based Pay Structures for Senior Roles
Senior professionals in the construction sector often receive more than just a base salary. Many companies are adding performance-based rewards to retain experienced talent and to encourage delivery excellence. These bonuses are typically tied to project milestones, safety metrics, and cost efficiency.
- Bonuses for completing construction projects on time can range between $3,000 and $8,000.
- Senior-level compensation packages may include non-cash incentives such as:
- Vehicle allowances or company vehicles
- Profit-sharing based on project success or company earnings
- Comprehensive health insurance or wellness benefits
In many cases, these added components bring the total annual compensation for senior construction roles to $25,000 to $40,000 above the base salary.
Matrix: Common Incentives in Senior Construction Roles (2026)
| Compensation Element | Typical Value (NZD) | Description |
|---|---|---|
| On-Time Delivery Bonus | $3,000 – $8,000 | Paid upon meeting agreed project deadlines |
| Vehicle Program / Allowance | $10,000 – $15,000 | Company car or annual vehicle benefit |
| Profit-Sharing or Equity | $12,000 – $20,000 | Based on company/project performance |
| Health & Insurance Benefits | $2,500 – $5,000 | Often included in total remuneration |
Premium Pay for Specialized Project Types
In 2026, not all construction projects offer the same salary opportunities. Professionals working on complex infrastructure—especially in sectors such as data center builds, advanced healthcare facilities, and public transport upgrades—are seeing additional compensation benefits.
- These high-complexity projects often offer salary premiums of 10% to 15% above standard market rates.
- They also demand more specialized knowledge in compliance, safety, and technical specifications, making them attractive to highly experienced professionals.
Conclusion: Career Opportunities in Construction Remain Strong
The construction, infrastructure, and trades sector in New Zealand offers promising income potential in 2026. With large projects underway and a high demand for skilled personnel, employers are increasing base salaries, offering performance incentives, and enhancing total rewards packages.
For professionals in this field, advancing qualifications and targeting complex project types can significantly increase earning power. For employers, investing in competitive compensation strategies is key to securing talent in a labor-constrained market. The year 2026 reflects a landscape where workforce demand, national infrastructure goals, and financial rewards are closely aligned.
4. Public Sector Benchmarking: Healthcare and Education
a. Healthcare and Nursing Salary Structures
The public sector in New Zealand has undergone significant changes in compensation planning for 2026. These developments are the result of long-term collective bargaining efforts aimed at resolving critical staffing shortages, ensuring workforce stability, and adjusting for rising living costs. Government salaries—particularly in essential services like healthcare and education—have increased notably, with some roles now outpacing their private sector counterparts in both base pay and total compensation packages.
Salary Growth and Role Distribution in the Public Sector
In 2025, the average salary within New Zealand’s Public Service reached approximately $103,300. This figure stands considerably higher than the private sector average, which remains around $85,700. The public sector’s higher average is largely influenced by the concentration of qualified professionals, such as educators, nurses, policy analysts, and departmental managers, who dominate the upper salary bands.
This wage gap also reflects the government’s structured investment in public-facing institutions, especially where chronic understaffing had previously hindered service delivery. Salaries have been strategically increased to retain experienced personnel and reduce turnover across major public service categories.
Focus on Healthcare: A Deep Dive into Nursing Pay Structures
One of the most transformed areas within the public sector is healthcare—specifically nursing. In 2026, nurse salaries in New Zealand have reached record levels due to updated pay equity agreements, revised overtime protocols, and structured incentives for continued professional development.
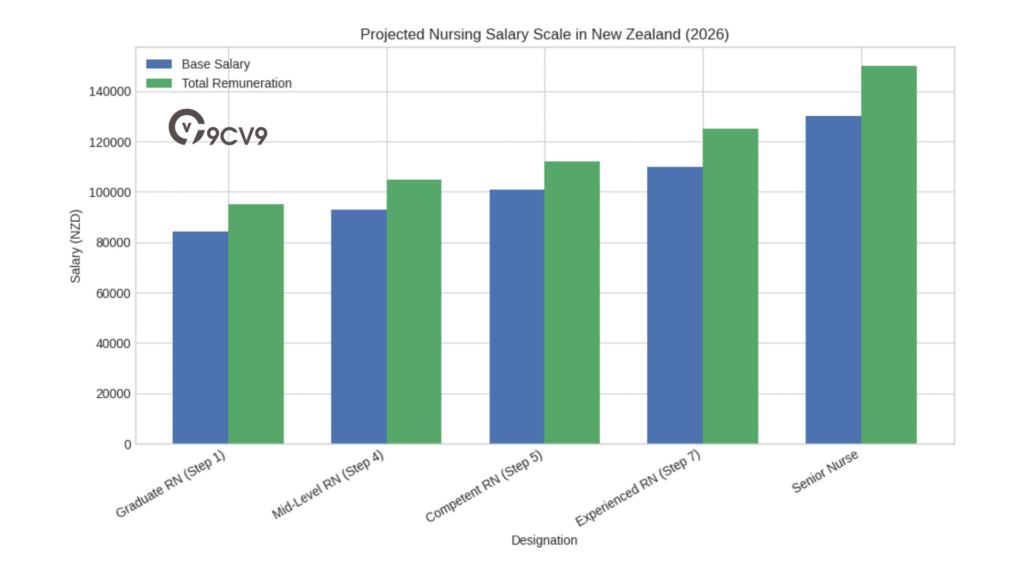
The new compensation model rewards experience, qualifications, and long service. Registered nurses now receive substantial total remuneration packages that include not only base pay but also additional allowances for shift work, penal rates, and progression through the Professional Development and Recognition Programme (PDRP).
Table: Projected Nursing Salary Scale in New Zealand (June 2026)
| Step Level | Designation | Base Salary (NZD) | Estimated Total Remuneration (NZD) |
|---|---|---|---|
| Step 1 | Graduate Registered Nurse | $84,150 | $95,000+ |
| Step 4 | Mid-Level Registered Nurse | $93,003 | $105,000+ |
| Step 5 | Competent Registered Nurse | $100,849 | $112,000+ |
| Step 7 | Experienced RN (6+ Years) | $109,963 | $125,000+ |
| Senior | Senior Nurse | $130,000+ | $150,000+ |
These pay enhancements have contributed to a significant drop in workforce turnover. As of early 2026, the nurse turnover rate has declined from 14% to 8.6%, indicating improved satisfaction and retention. In addition to remuneration, benefits such as additional leave days, education stipends, and streamlined promotional pathways have also played a key role in stabilizing the workforce.
Matrix: Key Impacts of Nursing Pay Reform (2026)
| Factor | Pre-Reform (Pre-2022) | Current (2026) | Impact on Workforce Stability |
|---|---|---|---|
| Average Base Salary (RN) | $68,000 | $100,000+ | Significant Increase |
| Turnover Rate (Annual) | 14% | 8.6% | Lower Attrition |
| Senior Nurse Compensation | ~$95,000 | $150,000+ | Increased Retention and Attraction |
| Career Pathways | Limited | Structured (PDRP-Based) | Professional Growth Opportunities |
Ongoing Pressures and Private Sector Implications
Although the public healthcare sector has made considerable progress, negotiations around inflation-indexed wage increases are still ongoing. Some unions and employee advocacy groups are pushing for automatic adjustments tied to cost-of-living data to ensure that real wage growth continues over time.
These negotiations are also having ripple effects in the private healthcare sector. Employers are finding it increasingly difficult to match public sector packages, particularly for mid- to senior-level nurses. As a result, private hospitals and care facilities may need to enhance their total reward offerings through flexible schedules, sign-on bonuses, or education grants to remain competitive.
Conclusion: Public Sector Compensation Aligns with Talent Retention Goals
New Zealand’s public sector salary frameworks in 2026 demonstrate a focused effort to modernize compensation strategies in vital industries like healthcare and education. The nursing sector, in particular, stands as a case study of successful wage reform—leading to improved job satisfaction, reduced turnover, and stronger recruitment outcomes.
With continued economic pressure and a dynamic labor market, public institutions are expected to remain key drivers of salary benchmarking and employment policy. Employers in both sectors will need to continually assess pay structures, benefits, and long-term retention strategies to attract and retain skilled professionals in a highly competitive landscape.
b. Education and Teaching Benchmarks
In 2026, the education sector in New Zealand marks a significant improvement in salary benchmarks, reflecting both recognition of the profession’s importance and an effort to address teacher shortages—particularly in regional and hard-to-staff areas. The latest figures show that 80% of fully qualified secondary school teachers now earn a base salary of over $100,000. This development is part of a broader strategy to improve teacher retention and career progression nationwide.
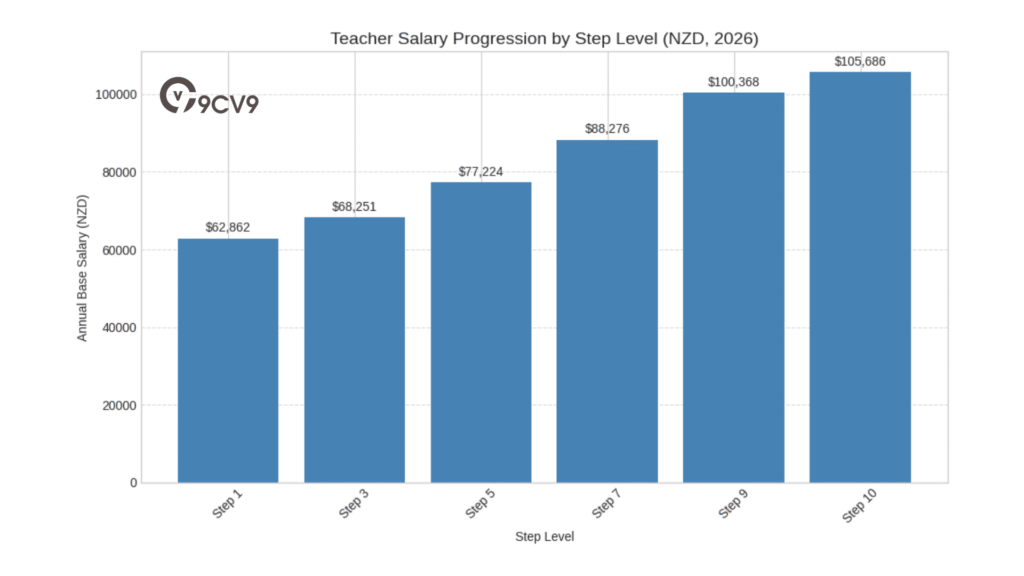
Teacher Salary Growth and Qualification-Based Pay Scale
The structured salary scale for trained teachers in 2026 is designed around years of experience, qualification levels, and step progression. The starting salary for entry-level teachers with a Group 3 (G3) qualification begins at $62,862, with experienced educators reaching well over $100,000. Teachers advance through the steps based on tenure and professional development milestones.
This consistent and transparent scale helps align earnings with expertise and educational contributions, offering a clearer career path for those entering and staying in the profession.
Table: Trained Teacher Salary Scale in New Zealand (Effective January 28, 2026)
| Step Level | Qualification Group | Annual Base Salary (NZD) |
|---|---|---|
| Step 1 | G3 Entry | $62,862 |
| Step 3 | G4 Entry | $68,251 |
| Step 5 | Standard Step | $77,224 |
| Step 7 | Experienced Step | $88,276 |
| Step 9 | G3 Maximum | $100,368 |
| Step 10 | G3+ / G4 / G5 Maximum | $105,686 |
The pay structure not only ensures equity across the education system but also creates predictable salary expectations for future workforce planning. Higher steps and qualification bands result in more significant salary brackets, encouraging long-term professional development.
Additional Allowances and Leadership Incentives
Teachers who take on additional responsibilities, such as department heads, coordinators, or senior academic roles, receive financial incentives beyond the base salary. These incentives are crucial in retaining talent in schools with leadership shortages and in regions that have historically struggled to fill senior teaching roles.
- An annual allowance of $2,500 is granted to those assigned as a “Principal’s Nominee”—typically responsible for assessment coordination and compliance oversight.
- Management unit values have also increased to $5,500 as of January 2026, allowing schools to financially reward teachers with leadership or administrative duties.
Matrix: Teacher Incentive Components and Additions (2026)
| Incentive Category | Value (NZD) | Purpose and Role Description |
|---|---|---|
| Principal’s Nominee Allowance | $2,500 per annum | For coordinating internal assessments and NZQA |
| Management Unit (MU) Value | $5,500 each | Leadership, department oversight, or team roles |
| Regional Staffing Retention | Variable | Case-by-case for remote area recruitment |
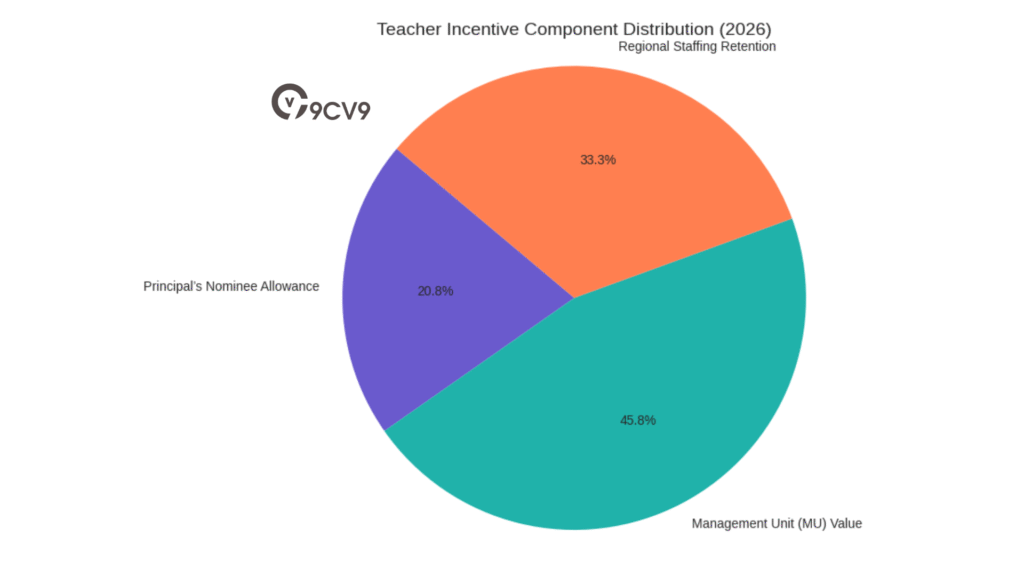
These structured incentives provide a flexible way for schools to recognize leadership, support professional growth, and tackle staffing challenges in less populated districts.
Implications for Retention and Regional Equity
The salary increases and structured allowances introduced in 2026 have a measurable impact on improving teacher retention. Schools in regional New Zealand, often facing hiring challenges, now have more tools to compete for experienced teachers. These changes make education careers more financially attractive and sustainable, particularly for mid-career professionals seeking stability and long-term growth.
Moreover, the comprehensive pay model aligns with broader public sector strategies designed to address workforce shortages, promote quality teaching, and support national educational outcomes.
Conclusion: Education Pay Reform Strengthens Teaching Careers in 2026
New Zealand’s 2026 education sector salary framework provides a robust foundation for attracting and retaining teachers in a competitive labor market. With well-structured salary steps, additional leadership incentives, and regionally adaptive recruitment policies, the system supports not only financial growth for educators but also the long-term quality and consistency of national education delivery.
As the country continues to address regional disparities and rising educational demands, these salary reforms are expected to play a central role in shaping the future of the teaching profession across all levels of schooling.
5. Agriculture and Primary Industries
In 2026, agriculture continues to play a central role in New Zealand’s economy, both in terms of employment and export performance. The sector is experiencing strong salary growth, driven by high commodity prices and ongoing demand for skilled farm and livestock management professionals. With a farmgate milk price forecast of $10 per kilogram, earnings across farming roles are at some of the most competitive levels in recent history.
Growth in Agricultural Pay Across Core Roles
Farm management roles are commanding higher salaries due to increasing operational complexity, rising global food demand, and growing investment in modern farming technologies. Senior and specialized positions—particularly in livestock management, agronomy, and veterinary services—are now offering compensation that rivals roles in other technical sectors.
Table: Agricultural Job Salary Benchmarks in New Zealand (2026, Median Annual NZD)
| Job Title | Average Salary (NZD) | Salary Range (NZD) |
|---|---|---|
| Farm Manager (General) | $110,000 | $100,000 – $140,000 |
| Dairy Farm Manager | $70,493 | $55,196 – $80,221 |
| Veterinarian | $120,000 | $90,000 – $150,000 |
| Agronomist | $95,000 | $75,000 – $115,000 |
| Agricultural Manager | $62,350 | $48,879 – $75,608 |
| Assistant Farm Manager | $55,000 | $48,000 – $62,000 |
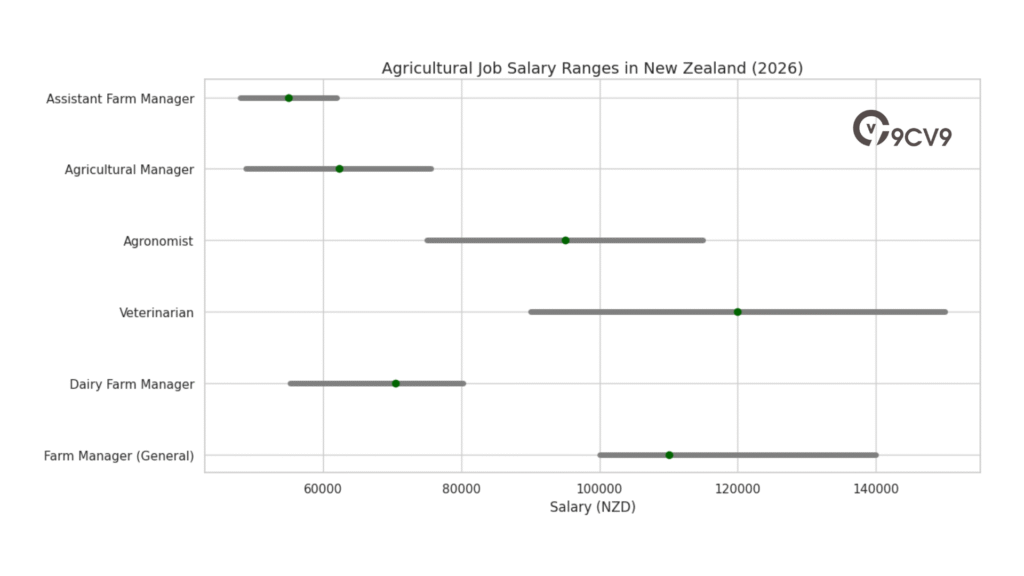
This table illustrates the wide salary spectrum within the sector, reflecting both role complexity and the scale of farming operations. Veterinary professionals remain among the highest earners due to skill shortages and rising demand for animal health services.
Geographical Variations in Farm Manager Salaries
Salaries for farm managers differ significantly by region. This variation is typically influenced by factors such as the productivity level of the region, operational scale, and concentration of export-focused farming. Regions with higher-intensity dairy, beef, and horticulture production tend to offer more competitive salaries to attract and retain skilled leaders.
Matrix: Regional Farm Manager Salary Averages (2026)
| Region | Average Farm Manager Salary (NZD) | Notes |
|---|---|---|
| Taupo | $140,000 | High productivity dairy belt |
| Papakura / Franklin | $125,000 | Close to Auckland; high-value agri production |
| Canterbury | $118,000 | Major dairy and cropping region |
| Southland | $102,000 | Focused on livestock and sheep farming |
| New Plymouth | $80,000 | Smaller-scale mixed farming |
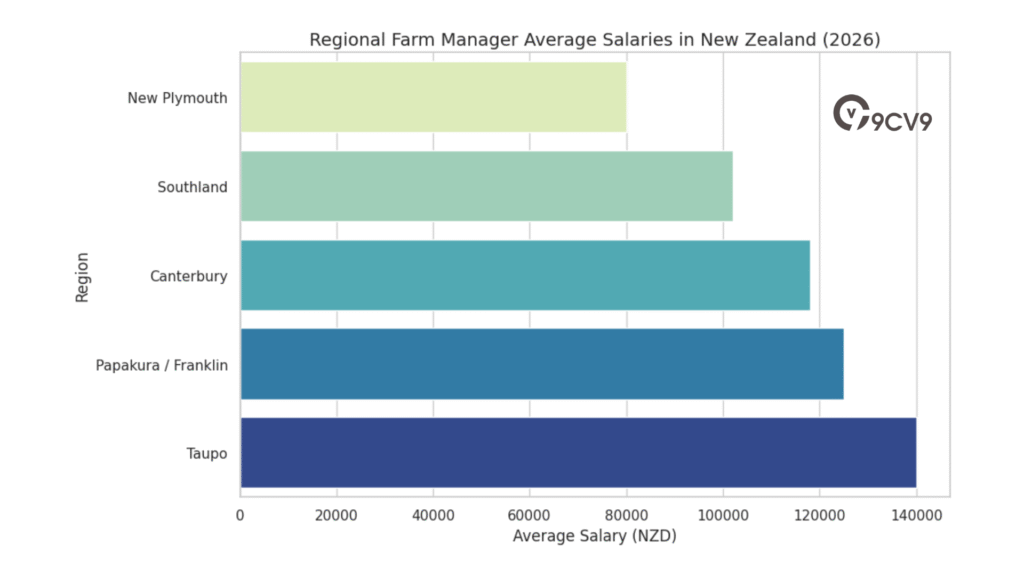
These differences underline the importance of location in determining compensation. Farms in high-yield or export-intensive areas are willing to pay significantly more due to operational demands and the need for technical oversight.
Key Drivers of Agricultural Salary Growth in 2026
Several economic and operational factors contribute to rising wages in the agriculture sector:
- Export Commodity Prices: High prices for milk, meat, wool, and horticulture products are fueling sector revenue and enabling higher wage budgets.
- Skill Shortages: A lack of qualified candidates in senior roles such as farm management and agronomy is placing upward pressure on salaries.
- Operational Complexity: With more farms adopting automated systems, precision agriculture, and sustainability reporting, roles are becoming more technical, and compensation is increasing accordingly.
- Regional Retention Strategies: Employers in remote or rural areas are introducing incentives, including accommodation and relocation assistance, to attract candidates.
Conclusion: Agriculture as a Competitive Career Path in 2026
New Zealand’s agricultural sector in 2026 offers strong career potential and financial growth, especially for those with technical qualifications and experience in large-scale operations. With rising global demand for sustainably produced food and strong export pricing, the industry continues to be a reliable and rewarding employment avenue. Professionals who invest in certifications, regional mobility, and technological literacy are best positioned to benefit from this upward salary trend.
6. Regional Salary Disparities and the Urban-Rural Divide
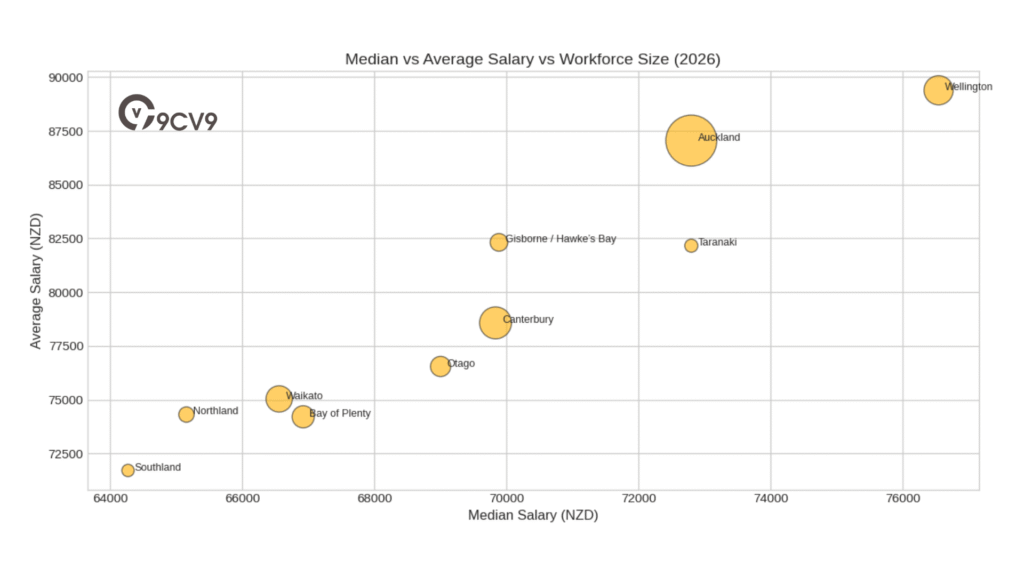
In 2026, salary differences across regions in New Zealand remain significant, largely shaped by geography, sector presence, and workforce concentration. Urban centres, particularly Wellington and Auckland, continue to offer higher average and median wages compared to regional and rural areas. These variations are driven by differences in job types, industry density, and cost of living across the country.
Geographical Influence on Income Levels
Wellington maintains its position as the region with the highest median annual salary, estimated at $76,544. This is primarily due to the concentration of high-level public service positions, central government departments, and corporate headquarters. However, when looking at overall average income, Auckland takes the lead with an average household income exceeding $166,000 in 2025. That figure, however, is influenced heavily by high-income earners and doesn’t always reflect the broader population.
In contrast, regions such as the West Coast and Southland report some of the lowest median and average salaries. These areas are more reliant on traditional industries such as mining, agriculture, and manufacturing, where wage levels are generally lower compared to tech, finance, and policy-related roles in urban centres.
Table: Median and Average Salaries by Region in New Zealand (2025–2026)
| Region | Median Salary (NZD) | Average Salary (NZD) | Workforce Size (in ‘000s) |
|---|---|---|---|
| Wellington | $76,544 | $89,388 | 319.7 |
| Auckland | $72,800 | $87,048 | 977.5 |
| Taranaki | $72,800 | $82,160 | 64.5 |
| Gisborne / Hawke’s Bay | $69,888 | $82,316 | 117.5 |
| Canterbury | $69,836 | $78,572 | 383.6 |
| Otago | $69,004 | $76,544 | 153.4 |
| Bay of Plenty | $66,924 | $74,204 | 184.0 |
| Waikato | $66,560 | $75,036 | 260.3 |
| Northland | $65,156 | $74,308 | 88.7 |
| Southland | $64,272 | $71,708 | 57.5 |
| West Coast | $54,080 | $62,244 | Data Unavailable |
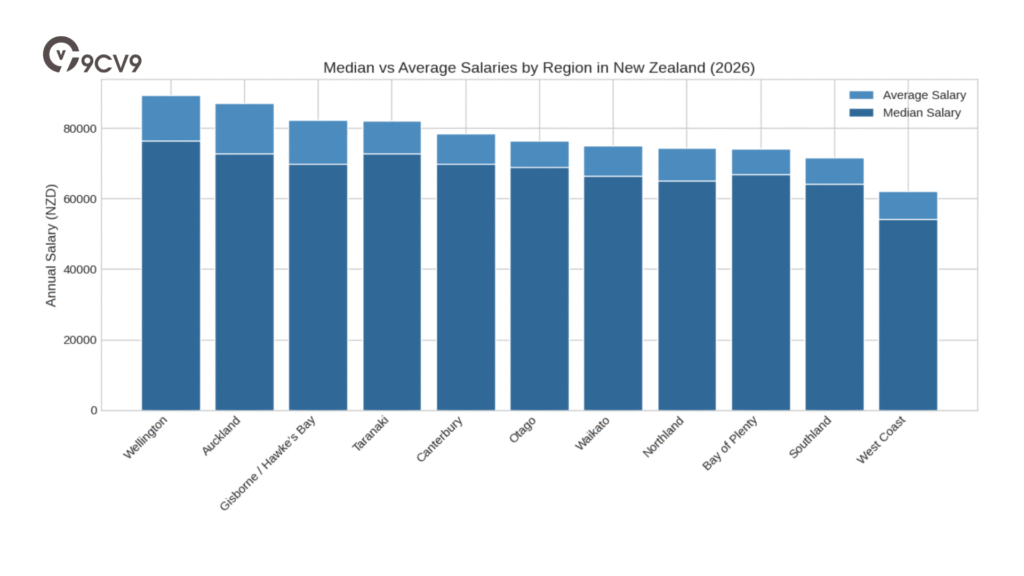
The difference between median and average income in high-earning cities like Auckland highlights the influence of outlier earners. While the average wage may appear high, it is often skewed by a small percentage of extremely high-income professionals. For most workers, the median figure offers a more accurate reflection of actual earnings.
Urban Salary Strength vs. Regional Labor Dynamics
Despite Auckland having the highest average household income, Wellington remains the benchmark for middle-income earners due to its steady supply of upper-tier public service jobs. However, changes in government budgets and restructuring have slowed wage growth in the capital, as public sector hiring has plateaued.
On the other hand, cities like Auckland and Hamilton are experiencing a resurgence in employment demand, particularly in professional services, construction, logistics, and digital industries. These urban labour markets are recovering faster post-pandemic, leading to renewed salary growth.
Matrix: Urban vs. Regional Salary and Employment Trends (2026)
| Region Type | Salary Level Trend (2026) | Key Sectors Influencing Growth | Employment Outlook |
|---|---|---|---|
| Major Urban (e.g. Auckland, Wellington) | Stable to Moderate Growth | Government, Corporate HQs, Tech | Stabilized or returning to growth |
| Mid-Urban (e.g. Hamilton, Tauranga) | Rising | Construction, Education, Logistics | Strong recovery, talent attraction |
| Regional (e.g. Taranaki, Otago) | Steady | Agriculture, Tourism, Manufacturing | Moderate growth, low competition |
| Rural (e.g. West Coast, Southland) | Limited Growth | Farming, Forestry, Mining | Slow expansion, wage caps observed |
This matrix helps employers and job seekers understand how geography impacts both current wage levels and projected job demand. Urban zones offer more access to higher salaries and diversified industries, while regional and rural areas often rely on a smaller set of economic drivers.
Conclusion: Salary Planning in a Regionally Diverse Economy
New Zealand’s salary landscape in 2026 shows that location remains a critical factor in earning potential. Urban areas offer the highest wages and more career options, while regional centres provide steady but less competitive income levels. Understanding these regional patterns is essential for businesses managing payroll strategies and for individuals planning relocation, job changes, or career development.
For policymakers and employers, addressing the urban-rural salary divide will be key to ensuring equitable economic growth, improving regional workforce participation, and attracting professionals to underserved areas through housing incentives, remote work flexibility, or regional salary adjustments.
7. Seniority, Experience, and the Career Lifecycle
In New Zealand’s 2026 workforce landscape, age and career stage are among the most influential factors in determining salary levels. Earnings typically increase steadily with age and experience before reaching a peak in midlife and then gradually decline as many professionals shift toward flexible work arrangements or partial retirement. Understanding how salaries vary across different age groups offers critical insight for employers, policy planners, and individuals mapping out long-term career paths.
Age as a Key Driver of Income Growth
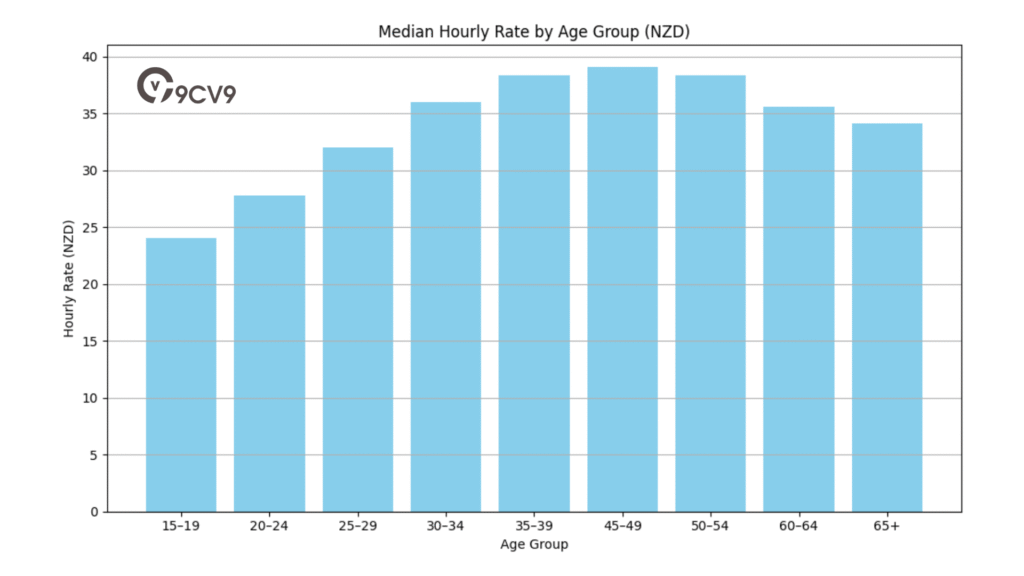
The typical earnings pattern follows a bell-shaped curve, where income rises from the early 20s, peaks during the late 40s, and begins to taper off around the mid-50s. Workers aged 45–49 represent the peak-earning segment, reflecting the culmination of experience, seniority, and career advancement.
On the other end of the spectrum, those aged 15–19 earn the lowest wages, often due to limited work hours, part-time roles, and entry-level positions. These early-career roles, though lower in earnings, serve as essential stepping stones toward long-term earning potential.
Table: Median and Average Earnings by Age Group in New Zealand (2025–2026)
| Age Group | Median Annual Salary (NZD) | Average Annual Salary (NZD) | Median Hourly Rate (NZD) |
|---|---|---|---|
| 15–19 | $19,656 | $28,392 | $24.00 |
| 20–24 | $55,120 | $52,988 | $27.80 |
| 25–29 | $66,820 | $70,772 | $32.00 |
| 30–34 | $75,816 | $81,952 | $36.00 |
| 35–39 | $79,196 | $89,336 | $38.36 |
| 45–49 (Peak) | $81,900 | $98,176 | $39.04 |
| 50–54 | $79,768 | $96,044 | $38.36 |
| 60–64 | $69,784 | $83,980 | $35.58 |
| 65+ | $54,860 | $67,392 | $34.13 |
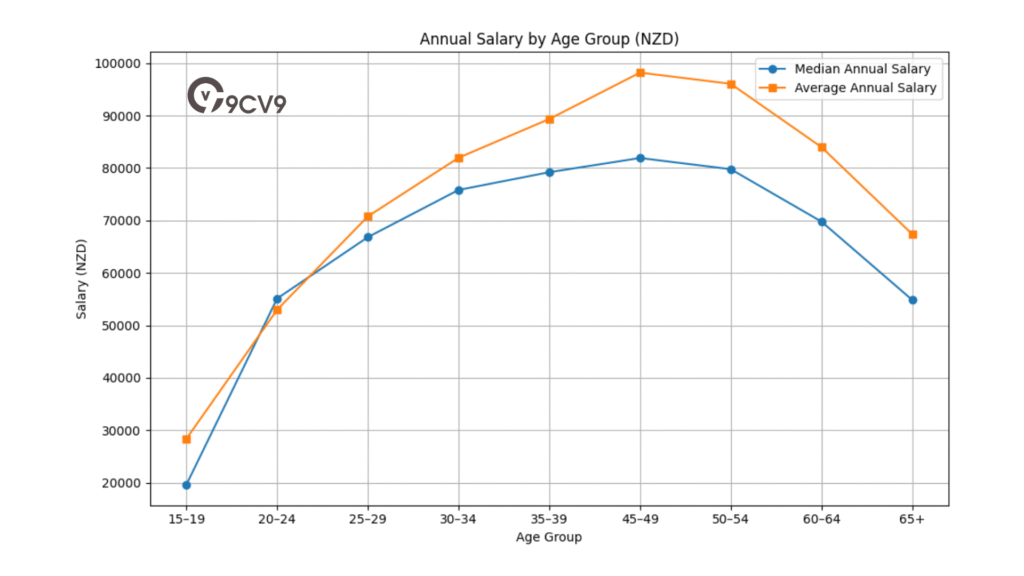
The progression clearly shows that individuals in their late 40s enjoy the highest median income—$81,900 annually—compared to just $19,656 for those aged 15–19. The hourly earnings also rise significantly with age, reflecting increased responsibilities and specialization.
Matrix: Career Stage vs. Income Dynamics (2026)
| Career Stage | Typical Age Range | Income Trend | Key Influencers |
|---|---|---|---|
| Entry-Level / Student | 15–24 | Low but rising | Part-time roles, training, hourly jobs |
| Early Professional | 25–34 | Moderate and accelerating | Skills accumulation, career development |
| Established Professional | 35–44 | Strong income growth | Management entry, specialization |
| Peak Earning Years | 45–49 | Highest income | Senior roles, strategic leadership |
| Transition to Flexibility | 50–64 | Stable to declining | Work-life balance, reduced hours |
| Retirement / Consultancy | 65+ | Lower median, higher average | Split between part-time and elite roles |
This matrix outlines how earnings vary not just by age, but by the nature of employment at different life stages. While younger workers focus on career building, older professionals often shift priorities toward flexibility, semi-retirement, or advisory roles.
Understanding the Median vs. Average Disparity in Senior Workers
The largest gap between average and median salaries appears in the 65+ age group, where the average salary exceeds the median by $12,532. This disparity indicates a split within this age cohort:
- A small percentage of older professionals remain in high-paying roles such as consultants, board members, or independent advisors.
- The majority transition into lower-hour, lower-intensity roles, reducing their income but aligning with lifestyle preferences and retirement planning.
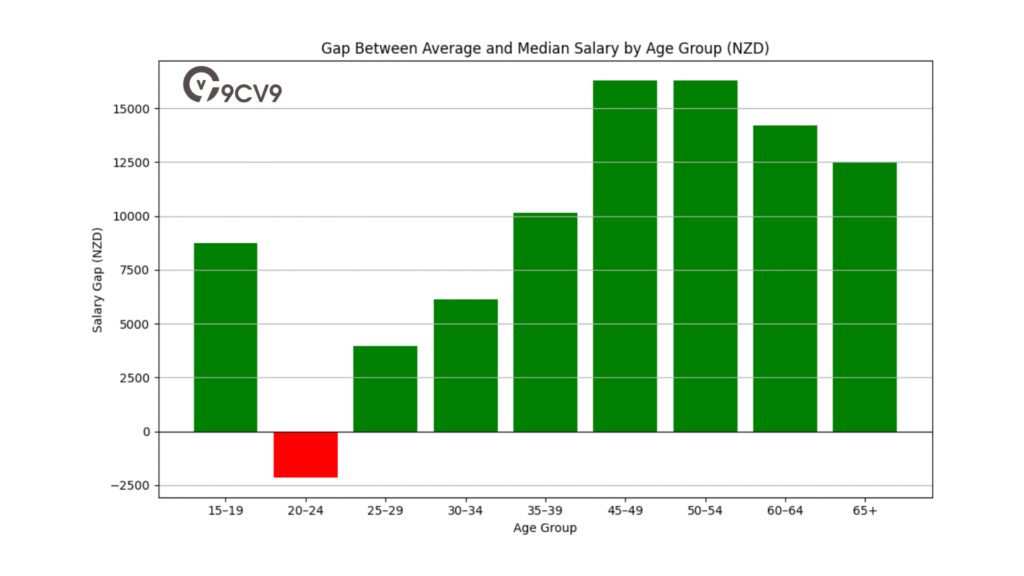
This bifurcated trend highlights the importance of interpreting both median and average data points when analyzing compensation for older workers.
Conclusion: Age-Based Salary Planning in the New Zealand Workforce
In 2026, New Zealand’s earnings structure reflects predictable but impactful patterns tied to age and experience. Professionals who invest in their careers during their 20s and 30s are well-positioned to benefit from peak earnings by their late 40s. Employers and HR leaders can use this data to design age-appropriate compensation strategies, succession planning, and retention models.
For individuals, understanding these trends helps in long-term financial planning, training investment, and decisions around late-career transitions. Whether entering the workforce or preparing for retirement, age remains a core factor in determining salary expectations across all industries.
a. Executive and C-Suite Remuneration
In 2026, executive-level salaries across New Zealand reflect the growing importance of performance-based pay and market benchmarking. Senior leadership roles—particularly those at the C-suite level—are heavily influenced by company profitability, scale, industry dynamics, and competitive talent strategies. As the responsibilities of executives evolve with business complexity, remuneration packages continue to rise, especially for those who directly impact operational efficiency, shareholder value, and long-term growth.
Key Factors Driving Executive Pay in 2026
The structure of executive compensation in New Zealand is largely influenced by the following elements:
- Organisational Size and Profitability: Larger companies and high-revenue sectors tend to offer higher base salaries and bonuses.
- Role Familiarity: For well-established roles such as CEO or COO, 44% of employers rely on external salary benchmarking tools and published salary guides.
- New and Emerging Roles: When it comes to newly created or less standardised positions—often found in fast-scaling industries or startups—organisations prefer internal peer-level comparisons or managerial input for compensation decisions.
- Bonus Culture: Bonuses form a significant part of the total remuneration package, with some executives earning six-figure bonuses depending on their contributions to business success.
Table: 2026 Executive Salary Benchmarks in New Zealand (Median NZD)
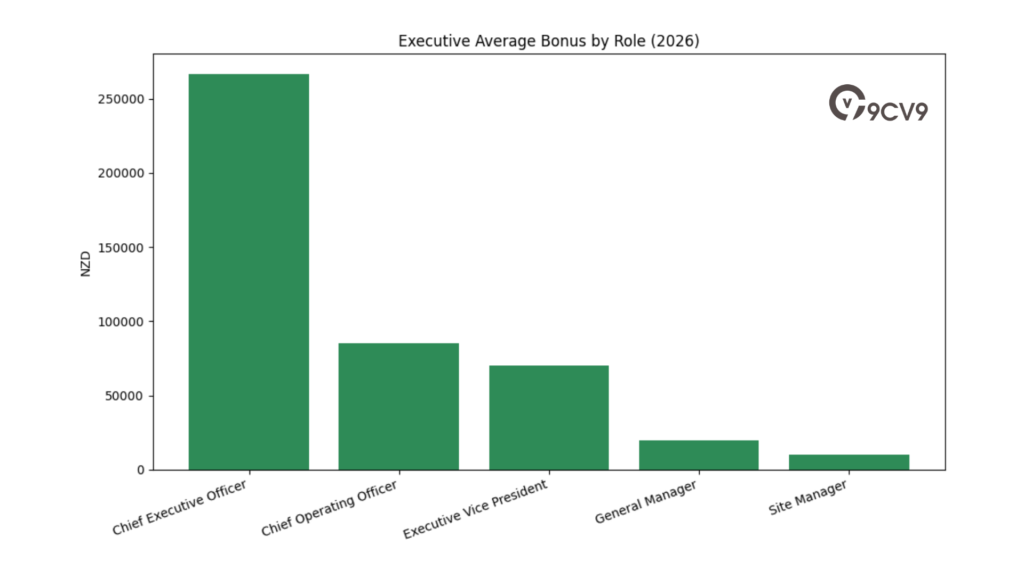
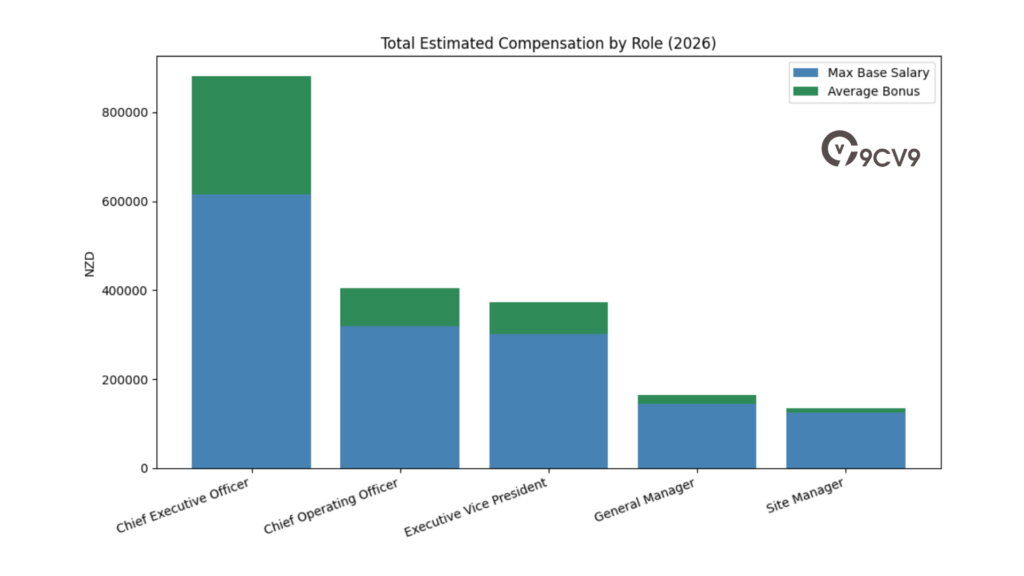
| Title | Base Salary Range (NZD) | Estimated Average Bonus (NZD) |
|---|---|---|
| Chief Executive Officer | $222,000 – $615,000 | $266,824 |
| Chief Operating Officer | $180,000 – $320,000 | $85,000 |
| Executive Vice President | $180,000 – $302,000 | $70,000 |
| General Manager | $130,000 – $145,000 | $20,000 |
| Site Manager | $105,000 – $125,000 | $10,000 |
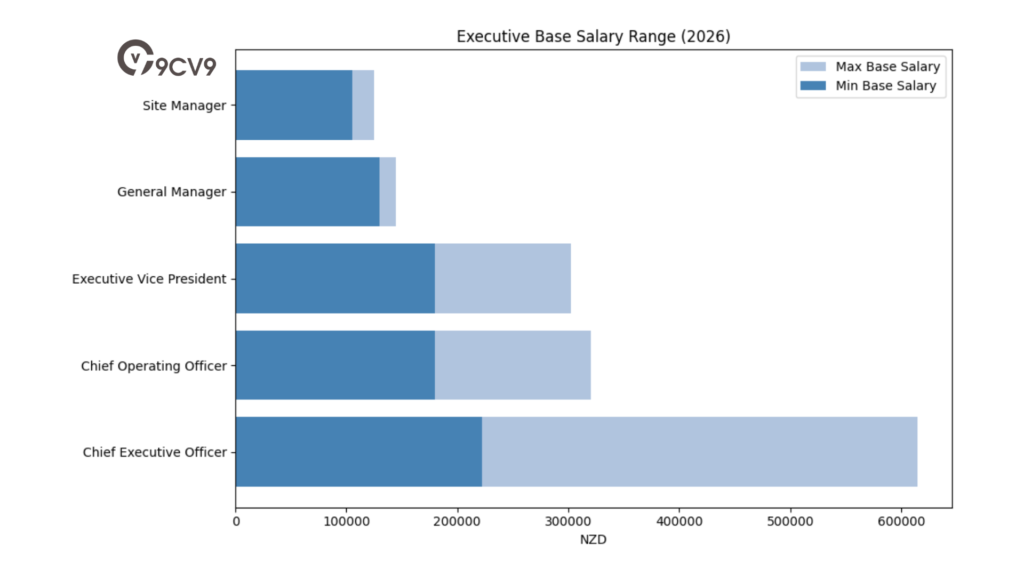
This salary structure shows a significant disparity between operational managers and strategic-level executives. While general and site managers receive steady base compensation with modest bonus potential, C-suite roles such as CEO and COO often carry both higher fixed salaries and performance-linked variable earnings.
Matrix: Determinants of Executive Compensation Structure in 2026
| Compensation Factor | High-Impact Roles (e.g. CEO, EVP) | Mid-Level Execs (e.g. GM, Site Manager) | Influence on Pay Scale |
|---|---|---|---|
| Company Performance | Strongly tied | Moderately tied | Primary driver for bonuses |
| External Benchmarking | Frequently used | Sometimes used | Establishes market parity |
| Internal Peer Comparison | Less common | Common | Influences emerging roles |
| Bonus and Incentive Pay | Large proportion of total comp. | Smaller proportion | Varies by function and KPIs |
| Role Familiarity and Maturity | Well-documented | Often variable | Affects base salary accuracy |
This matrix highlights that while high-level roles tend to follow external market data, mid-level and emerging leadership positions are more fluid, often shaped by internal business context.
Strategic Considerations for Executive Hiring and Retention
In a competitive employment market, companies are now placing more emphasis on total reward strategies. These often include:
- Long-Term Incentive Plans (LTIPs) such as stock options or equity grants, particularly in private or publicly listed enterprises.
- Retention Bonuses for executives critical to change management, M&A processes, or major digital transformations.
- Non-Monetary Perks like executive coaching, sabbaticals, and enhanced leave entitlements, which are becoming increasingly common in senior compensation packages.
Conclusion: C-Suite Salaries Reflect Evolving Leadership Demands
The executive pay landscape in New Zealand for 2026 shows that senior leaders are being rewarded not just for their titles, but for the measurable impact they bring to their organisations. As roles become more strategic and outcome-driven, salary structures have adapted to reflect this reality.
Employers that want to attract top-tier leadership must go beyond basic salary benchmarks and develop comprehensive reward frameworks that balance performance incentives, internal equity, and external competitiveness. This approach is critical not only to hiring the right talent but also to retaining them in a highly fluid and increasingly global executive labor market.
8. Demographic and Ethnic Inequities in the Wage Market
a. The Gender Pay Gap and the Motherhood Penalty
New Zealand has made progress in improving overall income equality, particularly in terms of reducing the national gender pay gap. However, deeper demographic disparities remain across the wage landscape, especially when analysing compensation through the lens of gender, ethnicity, age, and disability status. In 2026, these wage gaps are not just statistical differences—they reflect structural barriers that continue to affect the earning potential of underrepresented and historically marginalised groups.
Gender Pay Gap: Progress and Persistent Challenges
By June 2025, New Zealand recorded its lowest ever national gender pay gap at 5.2%, signalling a positive shift toward fairer pay practices. Yet, this headline figure masks more complex trends when broken down by age and life stage.
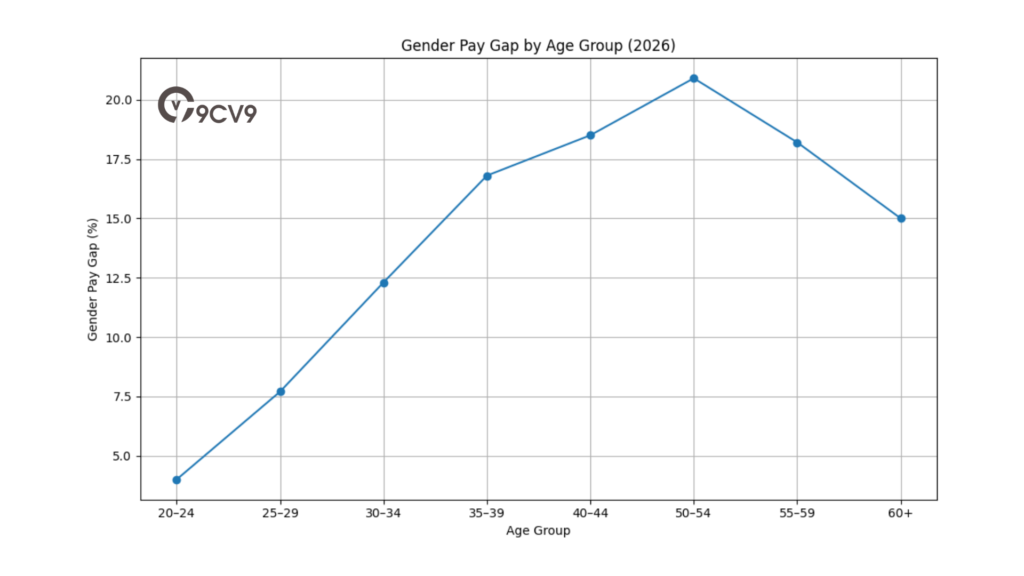
The wage gap is relatively narrow among younger professionals aged 25 to 29, at 7.7%. However, as employees progress through their careers, the divide becomes more pronounced, reaching a peak of 20.9% among those aged 50 to 54. This shift is closely tied to caregiving responsibilities, often referred to as the “motherhood penalty.” Women are more likely to reduce work hours, decline promotions, or exit the workforce temporarily to fulfil family obligations during the same period when male peers tend to advance into higher-paying senior roles.
Table: Gender Pay Gap by Age Group in New Zealand (2026)
| Age Group | Estimated Gender Pay Gap (%) | Observations and Influences |
|---|---|---|
| 20–24 | ~4.0% | Entry-level roles; early career equity |
| 25–29 | 7.7% | Begins to widen post-graduation |
| 30–34 | 12.3% | Early caregiving years for many women |
| 35–39 | 16.8% | Mid-career plateau due to family obligations |
| 40–44 | 18.5% | Male peers move into higher executive roles |
| 50–54 (Peak Gap) | 20.9% | Women experience slowed progression |
| 55–59 | 18.2% | Partial recovery phase |
| 60+ | 15.0% | Gradual narrowing post-peak work years |
This lifecycle trajectory shows that the gender wage gap is not simply a result of hiring bias—it reflects long-term systemic issues such as unequal parental leave uptake, limited part-time progression tracks, and reduced access to leadership development for women re-entering the workforce.
Ethnic and Disability Pay Inequities
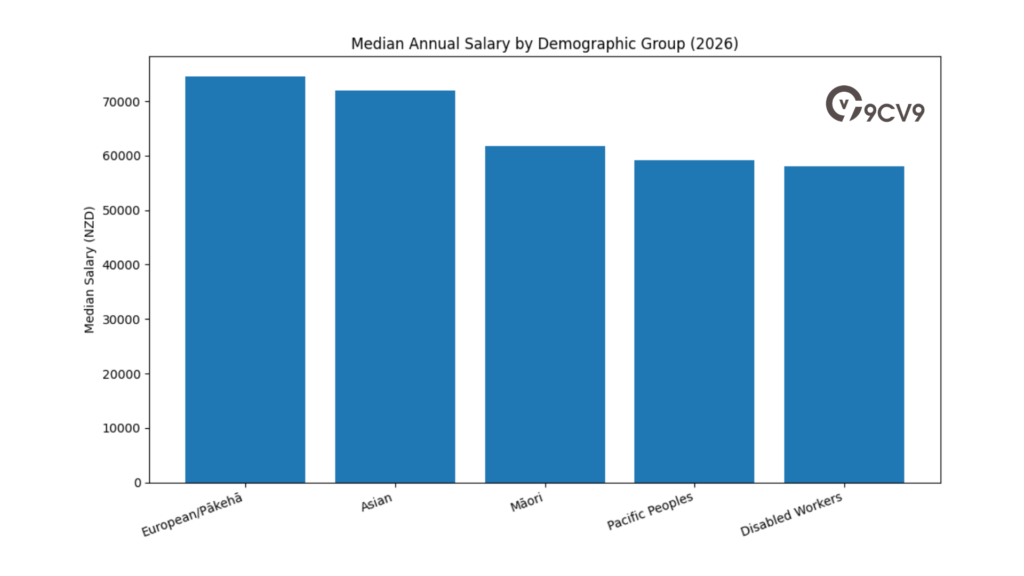
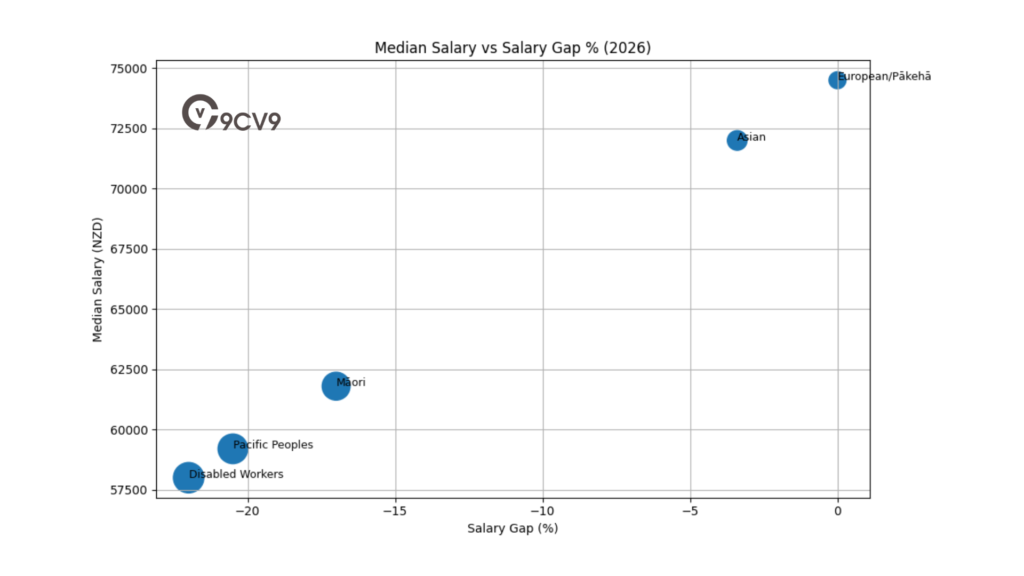
Alongside gender, ethnicity and disability status are major dimensions of income disparity in New Zealand’s 2026 job market. Workers identifying as Māori and Pacific Peoples continue to earn significantly less than European and Asian New Zealanders, even in comparable roles and with similar qualifications.
- Māori workers are, on average, earning 17% less than their Pākehā counterparts.
- Pacific Peoples face an even wider income gap, with disparities often exceeding 20%, particularly in metropolitan job markets.
- Employees with disabilities experience lower average earnings due to both limited access to high-paying roles and reduced full-time employment opportunities.
Matrix: Disparities in Median Annual Salaries by Demographic Group (2026, Estimated)
| Demographic Group | Estimated Median Salary (NZD) | Salary Gap vs. National Median (%) | Key Contributing Factors |
|---|---|---|---|
| European/Pākehā | $74,500 | Baseline | Higher access to senior roles and networks |
| Asian | $72,000 | -3.4% | High representation in STEM and tech |
| Māori | $61,800 | -17% | Industry concentration and bias |
| Pacific Peoples | $59,200 | -20.5% | Underrepresentation in leadership roles |
| Disabled Workers | $58,000 | -22% | Reduced access to full-time work, discrimination |
These disparities are reflective of both systemic exclusion and industry segmentation. Many Māori and Pacific workers are overrepresented in lower-paying sectors like manual trades, warehousing, and service roles, and underrepresented in executive, legal, and digital sectors.
Conclusion: Addressing Wage Equity in New Zealand’s 2026 Labour Market
Despite encouraging signs such as a narrowing overall gender pay gap, New Zealand’s salary system in 2026 continues to reflect longstanding imbalances rooted in social, cultural, and institutional barriers. Addressing these wage disparities will require not only better reporting and pay transparency, but also inclusive hiring practices, equitable promotion policies, and robust government support for return-to-work and disability inclusion programs.
For New Zealand to fully achieve income equality across all demographics, both public and private sector stakeholders must invest in systems that ensure fair progression, equal access to opportunity, and long-term structural change. Wage fairness in 2026 is no longer a compliance issue—it is a central pillar of sustainable economic and social development.
b. Ethnic and Disability Pay Disparities
As of 2026, despite national progress in salary transparency and diversity initiatives, income inequality remains a concern for many demographic groups in New Zealand’s workforce. Pay gaps persist across ethnicities and disability status, with European and male employees still earning significantly more than their counterparts. These income disparities are shaped by multiple systemic and historical factors, including access to education, career advancement pathways, and bias in hiring and promotion practices.
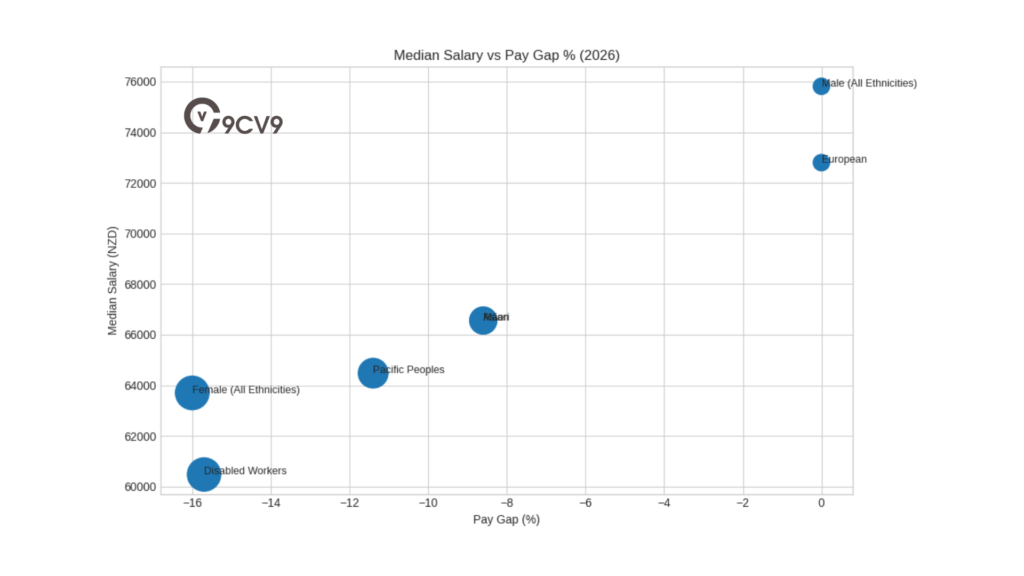
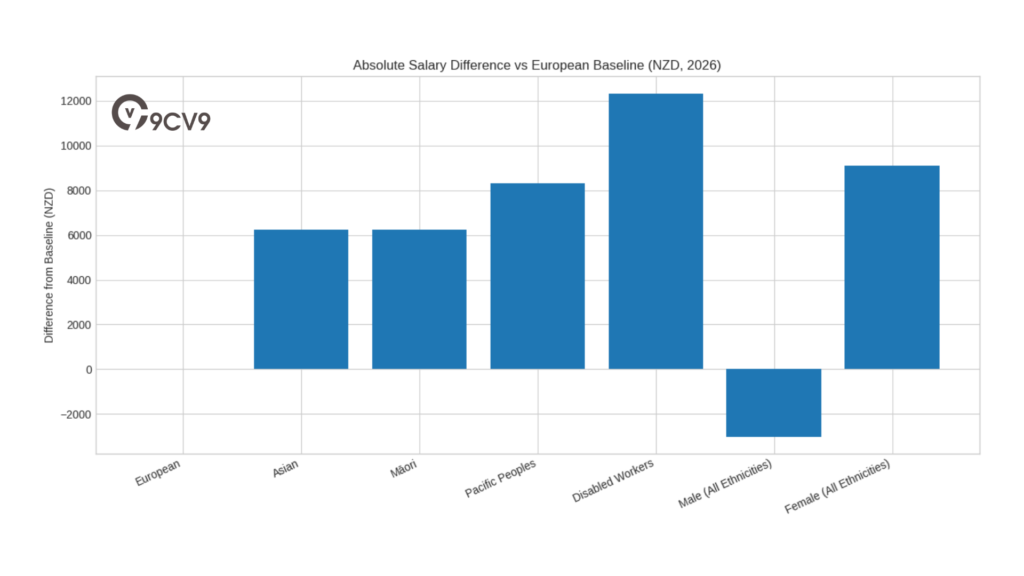
Ethnicity-Based Wage Disparities
European New Zealanders continue to earn the highest median annual salaries, averaging $72,800. In contrast, Māori and Asian workers both earn $66,560, which represents an 8.6% shortfall compared to their European counterparts. The gap widens further for Pacific Peoples, who have a median salary of $64,480—11.4% less than European workers.
These wage gaps are influenced by role distribution across sectors, with many Pacific and Māori professionals overrepresented in industries that traditionally offer lower pay. Additionally, fewer individuals from these groups occupy leadership or executive positions, limiting access to higher salary brackets.
Disability-Linked Pay Inequality
Workers with disabilities face an equally challenging pay environment. The median weekly income for disabled employees is estimated at $1,163, compared to $1,380 for non-disabled employees. This equates to an annual estimated gap of 15.7%. This wage disparity is often linked to limited full-time work opportunities, reduced access to senior roles, and a lack of workplace accommodations or support systems that enable career progression.
Table: Median Annual Salaries and Disparity by Demographic (2025–2026)
| Demographic Group | Median Annual Salary (NZD) | Pay Gap vs. European (%) | Notes on Contributing Factors |
|---|---|---|---|
| European (Baseline) | $72,800 | – | Highest median salary group |
| Asian | $66,560 | -8.6% | STEM-skewed roles, underrepresentation in senior leadership |
| Māori | $66,560 | -8.6% | Concentration in manual and service industries |
| Pacific Peoples | $64,480 | -11.4% | Lower access to leadership, wage compression |
| Disabled Workers | $60,476 (Est.) | -15.7% | Lower full-time employment rates |
| Male (All Ethnicities) | $75,816 | – | Benchmark for gender comparison |
| Female (All Ethnicities) | $63,700 | -16.0% | Influenced by caregiving roles and bias |
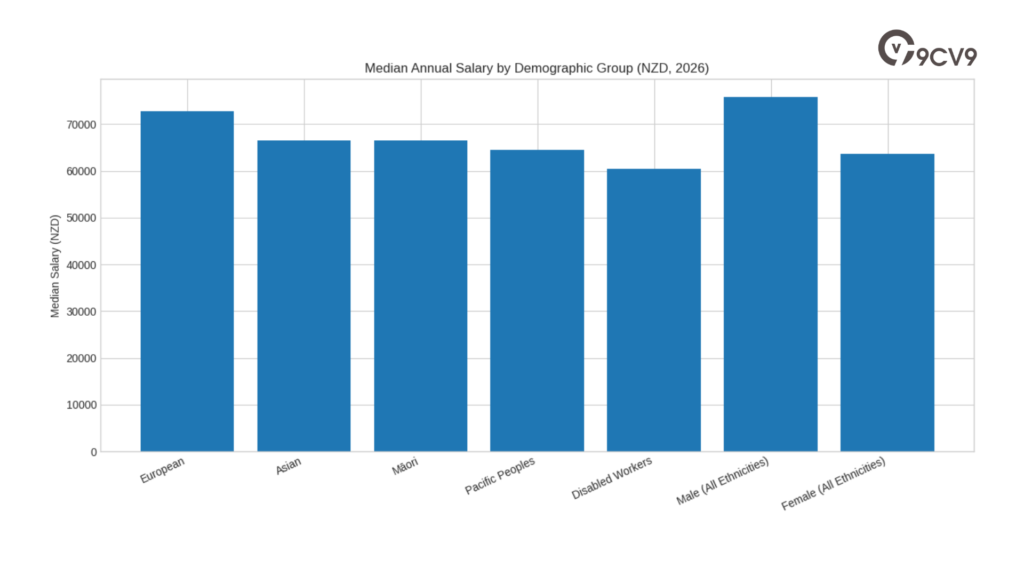
The above data highlights both ethnic and gender-based disparities. Women, especially Māori and Pacific women, often experience compounded inequity—earning less due to both gender and ethnic pay gaps. These combined disadvantages severely affect long-term financial security, superannuation savings, and career advancement.
Tools Supporting Pay Equity Efforts
In response to these inequalities, the New Zealand government and public sector have introduced new tools and strategies to promote equity:
- Gender Pay Gap Calculator: A national tool designed to help organizations measure and understand pay differences by gender across their workforce, adjusted by job role and level.
- Kia Toipoto Action Plans: A government-led framework that guides public and private sector employers through specific steps to address gender and ethnic pay gaps. It focuses on pay transparency, equal opportunity, and inclusive leadership development.
Matrix: Organisational Strategies to Reduce Pay Gaps (2026)
| Action Area | Example Tool/Initiative | Primary Impact |
|---|---|---|
| Pay Transparency | Gender Pay Gap Calculator | Identifies internal gaps and informs policy |
| Inclusive Hiring Practices | Kia Toipoto Implementation | Promotes diverse representation |
| Salary Benchmark Reviews | Ethnic/Gender Pay Audits | Aligns roles with fair market rates |
| Career Development Access | Targeted Upskilling Programs | Ensures pathways to leadership for all groups |
| Flexible Work Inclusion | Disability Work Enablement | Expands access for disabled and caregiving staff |
These actions aim to make wage equality a long-term structural reality rather than a compliance exercise.
Conclusion: Bridging Wage Inequality Through Structured Equity Planning
In 2026, while steps have been taken to reduce wage gaps in New Zealand, the data continues to reflect meaningful disparities based on ethnicity, disability, and gender. The introduction of digital tools and mandated equity frameworks such as Kia Toipoto is a promising step forward, but lasting progress will depend on how actively employers implement these strategies.
Creating fairer pay environments means more than monitoring salary gaps—it requires systemic changes in hiring, training, performance assessment, and leadership pipelines. As New Zealand continues to advance its employment standards, inclusive compensation practices will be critical to building a truly equitable workforce.
9. Non-Salary Compensation: The Evolution of Total Rewards
a. Primary Benefit Trends for 2026
In New Zealand’s evolving workforce, 2026 marks a clear shift in what employees expect from employers. Compensation is no longer measured solely by the numbers on a payslip. Today’s workers—especially across professional and knowledge-based sectors—evaluate job offers and workplace satisfaction through a broader lens called “total rewards.”
Total rewards now encompass a mix of salary, benefits, flexibility, personal development, and values-driven incentives. This change is driven by rising living costs, evolving societal expectations, and the demand for wellbeing-focused workplaces. Traditional perks like office snacks or subsidised gym memberships have lost relevance. In their place, employees now seek meaningful, customisable, and holistic support systems.
Key Trends in Non-Salary Compensation for 2026
Forward-thinking employers in New Zealand are focusing on the following benefit categories to stay competitive in a tight labour market and meet employee expectations.
Table: Emerging Non-Salary Benefits in New Zealand Workplaces (2026)
| Benefit Category | Description | Impact on Employee Experience |
|---|---|---|
| Financial Wellness | Access to KiwiSaver guidance, debt management, mortgage support | Improves long-term financial security |
| Flexible Work Autonomy | Employees choose when and where they work | Increases retention and productivity |
| Lifestyle Spending Accounts | Annual allowance for wellness, education, fertility, or debt repayment | Empowers personalised benefit use |
| Private Health Insurance | Standard benefit including GP, specialist, and mental health access | Enhances care access and reduces wait times |
| Environmental Incentives | EV subsidies, e-bike funding, extra leave for environmental volunteering | Attracts purpose-driven younger professionals |
These benefits are no longer viewed as “extras”—they are becoming baseline expectations, especially among mid-career professionals and younger employees.
Matrix: Comparison of Traditional Perks vs. 2026 Total Rewards Approach
| Component | Traditional Perks (Pre-2020) | 2026 Total Rewards Evolution |
|---|---|---|
| Work Flexibility | Remote work 1–2 days per week | Full schedule autonomy and location choice |
| Financial Tools | Generic superannuation options | Personalised KiwiSaver and mortgage advice |
| Family & Life Support | Parental leave packages | Fertility care, eldercare, student loan help |
| Wellness Options | Gym subsidies, fruit bowls | Mental health coverage, wellness allowances |
| Values-Based Benefits | One-off donations or events | EV subsidies, paid volunteering leave |
The contrast shows a major evolution from one-size-fits-all perks to targeted, high-impact benefits that align with individual life goals and values.
Personalisation and Autonomy as Core Themes
In 2026, employees value choice and relevance above uniformity. One standout innovation is the Lifestyle Spending Account (LSA) model, in which each employee receives an annual allocation—typically between $1,200 and $2,500 NZD—to be used for services or products that match their specific needs. This could include fertility treatments, cultural education programs, debt repayment, or fitness coaching.
This level of autonomy allows organisations to offer inclusive benefits without overengineering rigid HR policies. It also empowers workers to design their own total reward experience.
Health and Wellbeing in a Post-Pandemic Era
Health benefits have become a non-negotiable for many employees, particularly access to private insurance. Wait times in the public health system have pushed demand for private GP consultations, specialist care, and expanded mental health services. Organisations are responding by making health cover a standard part of mid-tier and senior remuneration packages, especially in sectors like tech, law, and finance.
Mental wellness is also deeply embedded in 2026 compensation planning. Beyond health insurance, employers are offering paid mental health leave, access to on-demand therapy platforms, and mindfulness stipends.
Sustainability-Driven Compensation
Younger generations entering the workforce are not just seeking competitive salaries—they also want employers to reflect their environmental and social values. Organisations are increasingly offering green benefits, such as:
- Electric vehicle purchase subsidies
- E-bike ownership support
- Paid leave for volunteering in environmental causes
These initiatives not only align with corporate social responsibility goals but also improve employer branding and recruitment outcomes.
Conclusion: Rethinking Compensation in a Values-Centric Job Market
As 2026 unfolds, the idea of compensation in New Zealand has grown beyond just money. Today’s workers evaluate total value—salary, flexibility, support, and social purpose. Employers who understand and adapt to these expectations will attract and retain top talent in an increasingly mobile and competitive labour market.
To remain relevant, organisations must move from outdated reward models to personalised, holistic, and future-ready benefit systems. Total rewards in 2026 are no longer just part of the package—they are central to the employment experience.
10. Cost of Living: The Context for Salary Sustainability
In 2026, understanding salary data in isolation is no longer sufficient. The value of a salary must be examined within the broader cost of living context. While wage growth continues across sectors, rising living expenses—especially for essentials like housing, food, and utilities—are placing increased pressure on household budgets. Even with inflation stabilising, the cumulative rise in costs since 2020 has significantly reduced real purchasing power.
A salary of $70,000 in 2026 provides a more modest lifestyle than it did six years earlier. This is particularly evident in urban centres, where costs such as rent and groceries consume a larger portion of take-home income.
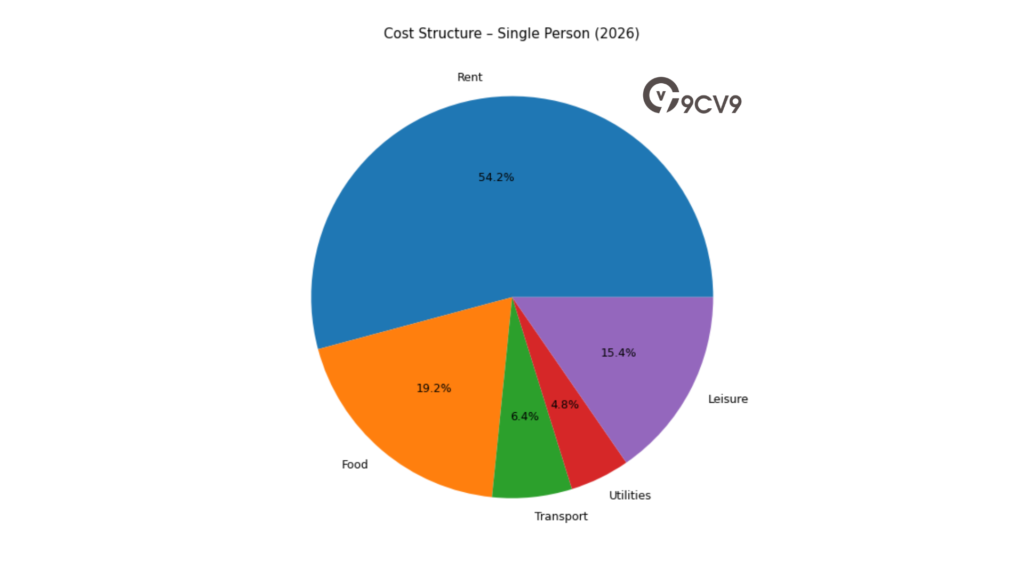
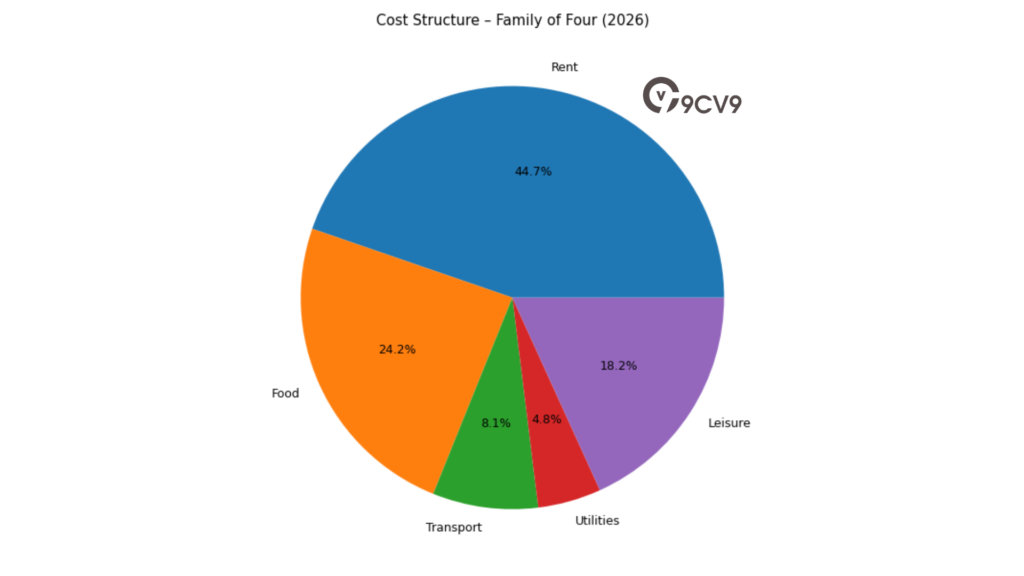
Table: Estimated Average Monthly Living Costs in New Zealand (2026, NZD)
| Expense Category | Single Person (Urban) | Family of Four (Urban) | Notes |
|---|---|---|---|
| Rent (Monthly) | $1,530 – $1,850 | $2,595 – $2,955 | Central city apartments; higher in Auckland |
| Food & Groceries | $600 | $1,500 | Weekly supermarket expenses |
| Transportation | $200 | $500 | Includes fuel, public transport, vehicle upkeep |
| Utilities & Internet | $150 | $300 | Power, water, internet |
| Miscellaneous/Leisure | $480 | $1,130 | Dining, entertainment, clothing |
| Total (City Center) | $3,280+ | $7,000+ | Monthly minimum for a reasonable standard of living |
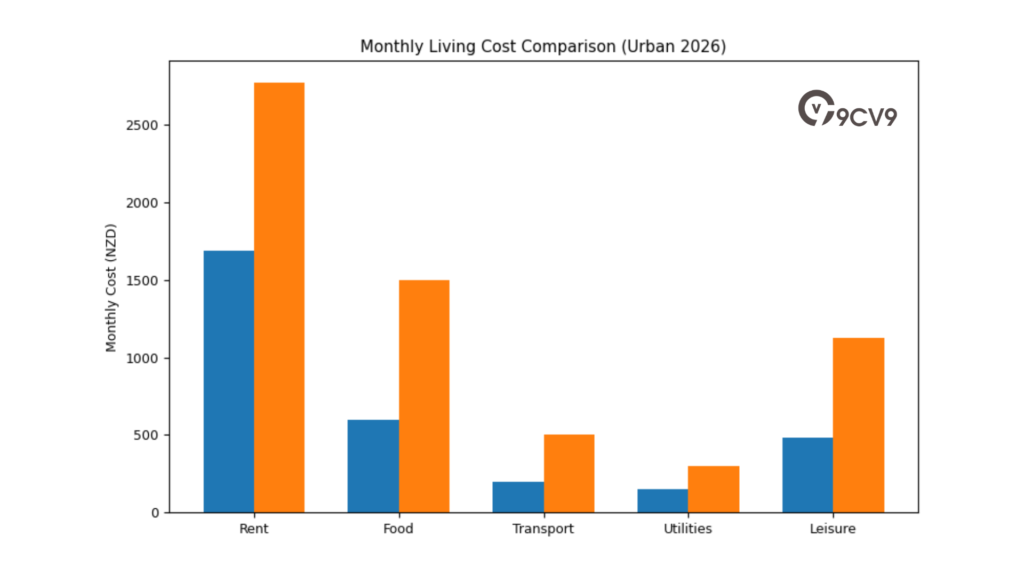
These figures demonstrate the financial reality many households face, especially in metro areas such as Auckland, Wellington, and Christchurch. For a family of four, a combined annual household income above $110,000 is often required to meet essential expenses while maintaining a modest lifestyle.
Annual Cost Movement and Sector-Specific Pressures
While overall inflation slowed to 2.2% in the year ending December 2025, not all households experienced this relief equally. Certain demographic groups—particularly those on fixed or low incomes—faced much higher cost increases.
Matrix: Sub-Group Cost Pressures and Key Contributors (2026)
| Demographic Group | Annual Inflation (2025) | Notable Price Increases | Impact Assessment |
|---|---|---|---|
| General Household Average | 2.2% | Rents, food, internet | Moderated after 2023-2024 inflation peaks |
| Superannuitant Households | 3.8% | Local rates (+8.8%), electricity (+12%) | Higher due to age-related fixed expenses |
| Regional Renters | 5.0% – 11.0% | Rent spikes in Southland, West Coast | Rising due to migration from major cities |
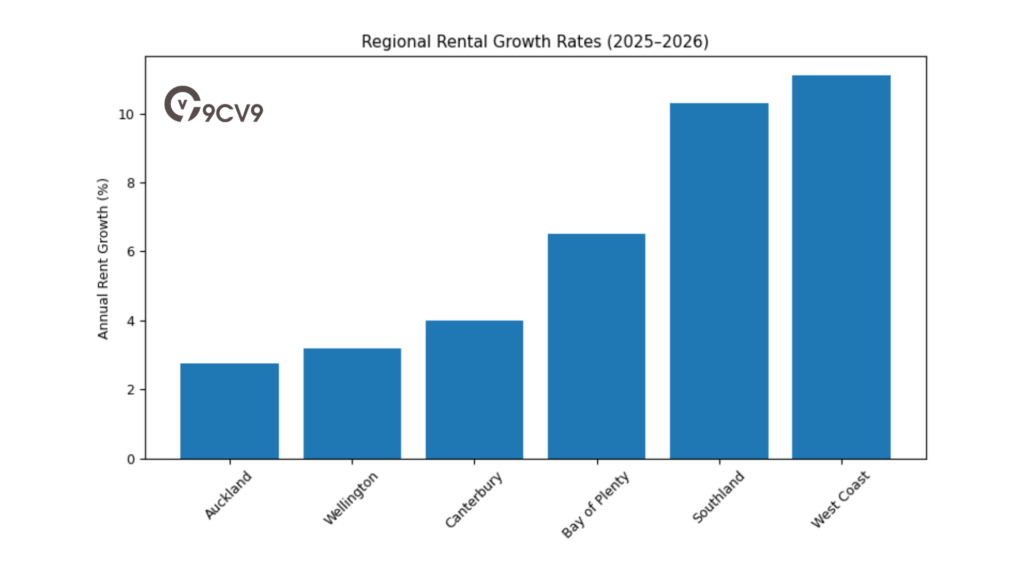
The regional rental market reflects a shifting population trend. While rent increases in Auckland have slowed to around 2.75%, more affordable regions like the West Coast and Southland have seen demand-driven surges, pushing rents up by as much as 10–11%.
Matrix: Regional Rental Growth Rates in New Zealand (2025–2026)
| Region | Annual Rent Growth Rate (%) | Comments on Demand Shifts |
|---|---|---|
| Auckland | 2.75% | Stabilised following sharp increases |
| Wellington | 3.2% | Gradual increase, supply catching up |
| Canterbury | 4.0% | Modest but steady rental growth |
| Bay of Plenty | 6.5% | Driven by inbound migration |
| Southland | 10.3% | Accelerated demand for affordability |
| West Coast | 11.1% | Limited supply, high rural appeal |
These cost trends are reshaping lifestyle decisions. Many professionals and families are exploring remote work options and regional relocations to optimise their income-to-expense ratio. However, with rising regional rents, these opportunities may become less viable without corresponding salary adjustments.
Conclusion: Cost Pressures Reshape Salary Expectations in 2026
In 2026, evaluating salary sustainability in New Zealand requires a full understanding of regional costs, lifestyle choices, and demographic variables. A $70,000 salary may offer financial comfort in some areas but be insufficient in others—especially for families and individuals in high-demand cities.
Employers and policymakers must adjust salary planning frameworks to align with these real-world cost dynamics. This includes not only reviewing base compensation but also expanding total reward offerings, housing support, and regional relocation incentives. A sustainable salary in 2026 is not only about numbers—it’s about ensuring that income can reasonably support modern living expectations across diverse locations and life stages.
11. Future Projections and Long-Term Trends to 2030
As New Zealand’s labour market evolves, the salary outlook toward 2030 points to a clear shift driven by skills, demographics, and sectoral transformation. Forecasts from the Ministry of Business, Innovation and Employment (MBIE) reveal that employment will grow at an average annual rate of 1.8% through 2026 and beyond, with the majority of new roles concentrated in high-skill occupations—particularly in management, healthcare, education, and agribusiness.
This future employment landscape reflects the country’s efforts to meet critical service demands in rural areas, maintain its agricultural competitiveness, and adapt to a more specialised and knowledge-based economy.
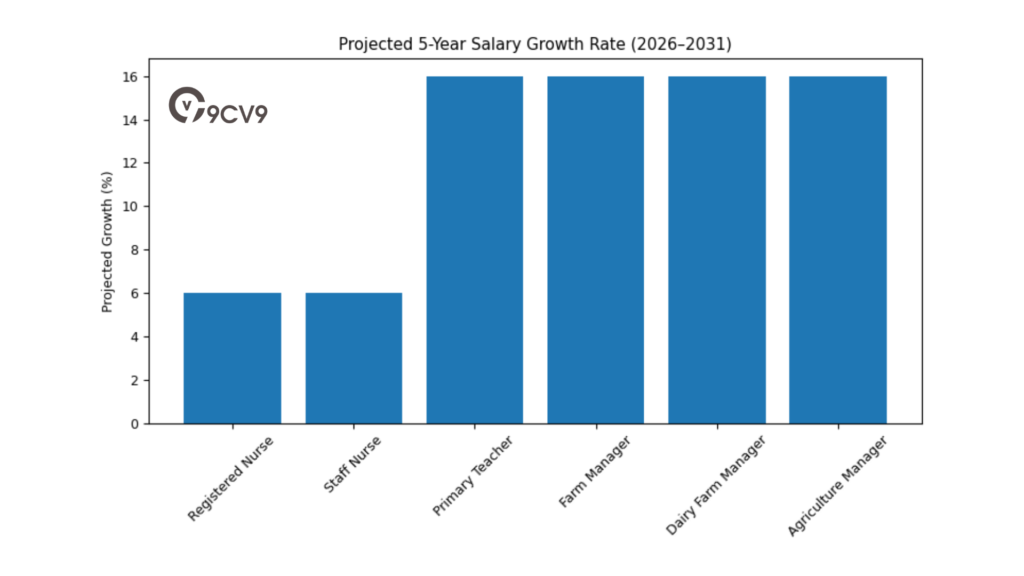
Projected Wage Growth by Occupation (2026–2031)
Over the next five years, salary projections indicate robust growth across several essential industries. Notably, roles in primary education and agricultural management are expected to experience the highest rate of increase at 16%, underscoring persistent talent shortages and strategic national priorities in these sectors.
Table: Estimated 5-Year Salary Growth Forecast (NZD, 2026–2031)
| Occupation | 2026 Average Salary (NZD) | 2031 Projected Salary (NZD) | Projected Growth (%) |
|---|---|---|---|
| Registered Nurse | $113,973 | $120,917 | +6% |
| Staff Nurse | $104,390 | $110,751 | +6% |
| Primary School Teacher | $93,272 | $107,814 | +16% |
| Farm Manager | $92,218 | $107,114 | +16% |
| Dairy Farm Manager | $70,493 | $81,483 | +16% |
| Agriculture Manager | $62,350 | $72,176 | +16% |
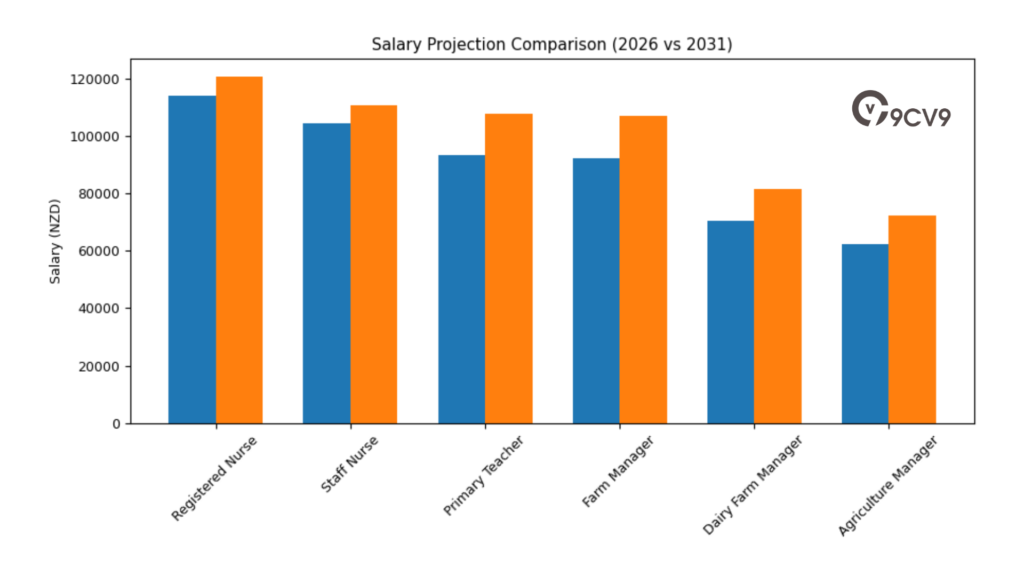
This upward wage movement is influenced by various long-term trends, including population ageing, demand for domestic food security, teacher retention strategies, and rural labour shortages. These sectors are expected to receive targeted government investment and private sector support, both of which will contribute to continued salary growth.
Matrix: Sector Priorities and Wage Growth Alignment (2026–2031)
| Sector | Projected Growth Priority | Reasons for Salary Increases | Workforce Challenges |
|---|---|---|---|
| Healthcare (Nursing) | Moderate | Essential services, higher patient demand | Ageing population, retention post-COVID |
| Education (Primary) | High | Rural school shortages, growing class sizes | Low entry pipeline, regional staffing gaps |
| Agriculture (Management) | High | Food production, export sector competitiveness | Urbanisation reducing rural labour availability |
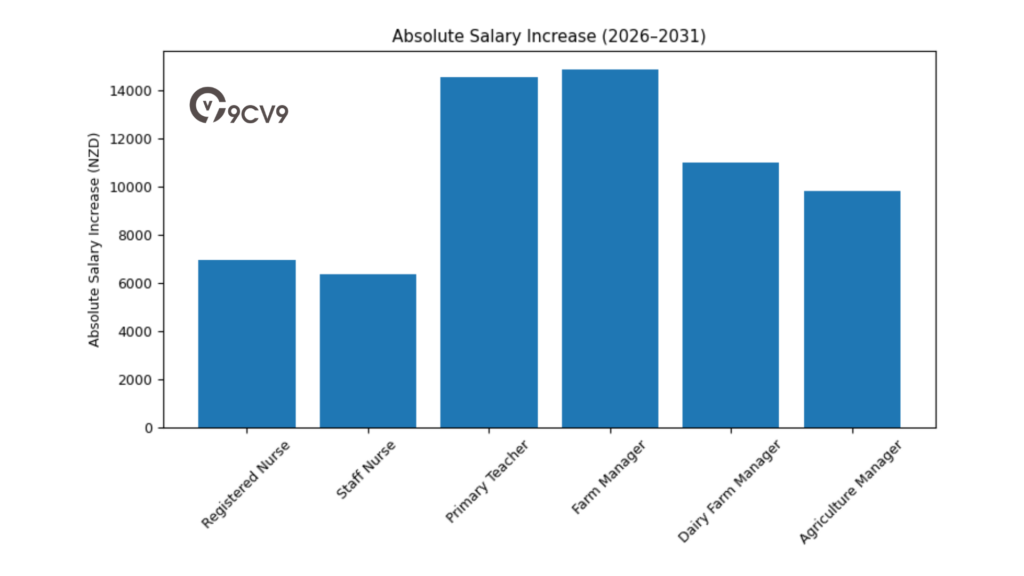
This matrix shows how different sectors are responding to demographic pressure, skills shortages, and national strategic objectives. Roles that directly support public well-being or national exports are receiving stronger policy and wage support through 2031.
Key Trends Influencing Future Salaries
Several macroeconomic and structural trends will continue to shape New Zealand’s wage trajectory:
- Skill-Based Wage Divergence: High-skill and degree-requiring occupations will see faster wage growth compared to low-skill, generalist roles.
- Rural Staffing Gaps: Expect higher salary offers and incentives in under-served regional areas, particularly in healthcare, education, and primary industries.
- Government Interventions: Sector-specific funding and policy reforms will push wages higher in priority areas such as early childhood education and sustainable agriculture.
- Technological Integration: Jobs that incorporate digital, AI, and data-driven skills will attract higher remuneration due to limited supply and high strategic value.
Conclusion: Salary Trends Through 2030 Reflect Economic and Workforce Transformation
Looking ahead to 2030, New Zealand’s salary environment is expected to shift significantly toward rewarding skilled, regional, and high-impact occupations. With healthcare, agriculture, and education at the forefront, workers entering these fields today are likely to benefit from steady wage increases, improved working conditions, and policy-driven support.
Organisations and job seekers alike must prepare for a labour market that values specialisation, adaptability, and cross-sectoral experience. Strategic career choices aligned with future growth sectors will unlock higher earning potential and long-term job security in New Zealand’s evolving economy.
Conclusion
Understanding the complete salary environment in New Zealand for 2026 requires a comprehensive perspective—one that looks beyond just base pay figures and delves into the broader dynamics of employment, economic shifts, workforce priorities, and cost of living realities. As New Zealand continues to adapt to post-pandemic economic conditions, technological disruption, demographic transitions, and evolving workforce expectations, the salary structure across industries and roles is undergoing significant transformation.
This guide reveals that salary growth in 2026 is not uniform. Instead, it is shaped by multiple intersecting factors such as region, occupation, experience level, gender, ethnicity, education, and sector demand. The introduction of real wage growth—where salary increases are finally outpacing inflation—has begun to restore earning power for many employees. However, the benefits are not distributed evenly across the population. Sectoral fragmentation, geographical disparities, and structural inequities still persist, creating a complex wage environment that demands thoughtful navigation by job seekers, employers, policymakers, and economic planners.
In high-growth sectors such as technology, healthcare, construction, education, and agriculture, skilled professionals are experiencing strong salary increases. Specialised roles in artificial intelligence, cloud engineering, nursing, teaching, and farm management are seeing above-average growth due to critical talent shortages and increased demand. These areas are projected to maintain upward salary trajectories through to 2030, making them attractive long-term career options. Furthermore, the evolution of total rewards packages, including flexible work arrangements, lifestyle benefits, health coverage, and sustainability-driven perks, now plays a crucial role in overall compensation and employee satisfaction.
At the same time, workers are grappling with an uneven cost-of-living environment. Although headline inflation has eased, essential expenses such as rent, electricity, and groceries remain high—particularly in major urban centres. Regional shifts in affordability, driven by rent surges in previously low-cost areas, are reshaping labour mobility and lifestyle decisions. For many households, a nominal salary increase may not fully compensate for the actual rise in daily expenses, making salary sustainability a more pressing consideration than ever before.
Demographic wage gaps continue to underscore the need for policy intervention and employer accountability. The gender pay gap, while at its lowest national average on record, still widens sharply with age. Ethnic minorities and workers with disabilities face persistent pay inequities due to systemic challenges and underrepresentation in higher-paying roles. Government initiatives like Kia Toipoto and transparency tools such as the Gender Pay Gap Calculator are important steps toward addressing these disparities, but progress requires continued monitoring, reporting, and implementation across both public and private sectors.
Looking ahead, long-term salary trends in New Zealand indicate a shift towards skill-based wage divergence. Jobs that demand advanced qualifications, digital literacy, and leadership capabilities will command higher wages, while generalist and lower-skilled roles may experience stagnation without upskilling or role evolution. Employment growth through 2030 will largely be concentrated in high-skill categories, further reinforcing the need for targeted education, vocational training, and career planning.
For employees, the key takeaway is the importance of aligning career choices with sectors that show strong growth potential and long-term stability. For employers, it is critical to benchmark salaries accurately, invest in talent retention through holistic rewards strategies, and embed equity across every level of the compensation structure. For policymakers and economic leaders, the priority remains enabling sustainable wage growth, improving regional affordability, and closing structural pay gaps that hinder social and economic inclusion.
Ultimately, a complete guide to salaries in New Zealand for 2026 is more than a snapshot of market rates—it is a detailed roadmap that highlights where the workforce is today and where it is headed tomorrow. By staying informed, adaptable, and aligned with the evolving employment ecosystem, both individuals and organisations can make smarter, future-focused decisions in a rapidly changing world of work.
If you find this article useful, why not share it with your hiring manager and C-level suite friends and also leave a nice comment below?
We, at the 9cv9 Research Team, strive to bring the latest and most meaningful data, guides, and statistics to your doorstep.
To get access to top-quality guides, click over to 9cv9 Blog.
To hire top talents using our modern AI-powered recruitment agency, find out more at 9cv9 Modern AI-Powered Recruitment Agency.
People Also Ask
What is the average salary in New Zealand in 2026?
The average salary in New Zealand in 2026 is approximately $84,000 annually, with variations based on industry, role, and region.
What is the median salary in New Zealand in 2026?
The national median salary in 2026 is around $72,000 per year, reflecting the midpoint of all earners across the country.
Which jobs have the highest salaries in New Zealand in 2026?
Executive roles, technology specialists, medical professionals, and experienced engineers rank among the highest-paying jobs in 2026.
What is considered a good salary in New Zealand in 2026?
A good salary in New Zealand in 2026 is generally considered to be above $100,000, particularly in major cities due to the high cost of living.
How much do nurses earn in New Zealand in 2026?
Registered nurses earn around $114,000 on average, with senior nurses making up to $125,000 depending on experience and allowances.
What is the average salary for teachers in New Zealand in 2026?
Primary school teachers earn an average of $93,000, while experienced educators with leadership roles may earn more than $105,000.
How does the cost of living affect salary value in 2026?
The rising cost of housing, food, and utilities has reduced the purchasing power of salaries, especially in urban centres.
What is the minimum wage in New Zealand in 2026?
The adult minimum wage in 2026 is set at $23.95 per hour, equating to approximately $49,800 annually for full-time work.
Do salaries vary by region in New Zealand in 2026?
Yes, salaries vary greatly. Wellington has the highest median salary, while regional areas like the West Coast have lower wage levels.
What is the gender pay gap in New Zealand in 2026?
The national gender pay gap is 5.2%, but it increases with age and peaks at over 20% for workers aged 50 to 54.
How much do farm managers earn in 2026?
General farm managers earn around $110,000 on average, with top regional earners reaching $140,000 or more.
Are executive salaries increasing in New Zealand?
Yes, C-suite salaries continue to rise, with average CEO compensation exceeding $260,000, influenced by performance and industry.
What is the projected salary growth by 2030?
Salaries in high-demand sectors like education and agriculture are projected to grow by up to 16% between 2026 and 2031.
What industries offer the fastest salary growth?
Education, agriculture, healthcare, and technology are leading sectors for projected salary increases in the coming years.
How much do software developers make in New Zealand in 2026?
Software developers earn between $80,000 and $145,000 depending on their level of experience and specialisation.
What is a typical salary for a data scientist in 2026?
Data scientists in New Zealand earn from $121,000 to over $182,000, with demand driving up pay for specialised roles.
Is remote work influencing salaries in 2026?
Yes, remote and hybrid work models are now standard, and flexibility has become a key part of total compensation.
What are total rewards in New Zealand salary packages?
Total rewards include salary, health insurance, lifestyle benefits, paid leave, and flexible work options beyond just base pay.
How much do people with disabilities earn in 2026?
Disabled workers earn a median of around $60,500, which is about 15.7% less than non-disabled workers.
How does ethnicity impact wages in New Zealand?
European workers earn the highest median salaries, while Pacific Peoples and Māori workers face wage gaps of 8% to 11%.
What non-salary benefits are common in 2026?
Common benefits include lifestyle spending accounts, private health insurance, EV subsidies, and financial wellness programs.
Are regional salaries catching up to urban centres?
While some regions offer competitive wages, urban centres still lead in average salaries due to industry presence and role concentration.
What are the typical household expenses in 2026?
City-centre households spend over $7,000 per month on rent, food, utilities, transport, and other living costs.
How much do new graduates earn in 2026?
Graduate salaries vary by field but typically start between $55,000 and $65,000, with tech and healthcare on the higher end.
What is the salary outlook for agriculture in 2026?
Agriculture roles are expected to see strong growth, with projected salary increases of up to 16% by 2031.
What is the average hourly wage in New Zealand in 2026?
The average hourly wage in 2026 is around $39 during peak earning years and varies by occupation and age group.
What age group earns the highest salaries in 2026?
Workers aged 45–49 are the highest earners, with median incomes exceeding $81,900 during their peak career phase.
Are there still pay gaps based on gender and ethnicity?
Yes, significant gaps remain, particularly for older women and ethnic minority groups, despite overall improvements.
How do company size and industry affect executive pay?
Larger organisations and high-revenue industries offer higher executive salaries, often with performance bonuses and equity.
What factors should job seekers consider in 2026?
Job seekers should evaluate salary, total benefits, cost of living, location, career growth, and long-term industry trends.
Sources
Human Resources Director
Reserve Bank of New Zealand
Talent International
Stats NZ
IMF DataMapper
MPA Mag
MoneyHub NZ
NZIER
Franklin Times
Newland Chase
Ministry of Business, Innovation & Employment
The Economic Times
ArtBeat NZ
New Zealand Immigration Partners
Robert Half
Cherry Bekaert
RIT Tech and Digital Market & Salary Update
Workday Blog
The Birmingham Group
Payscale
ERI Economic Research Institute
Te Kawa Mataaho Public Service Commission
Te Whatu Ora
IBISWorld
Ministry of Education
PPTA
Westpac
Seek New Zealand
SalaryExpert
Infometrics Regional Economic Profile
DLA Piper GENIE
Commerce Commission
Employment Hero
upGrad
Opes Partners
Barfoot & Thompson


