

From our earlier post, we delved into the reasons behind using a Sigmoid function for the Logistic Regression rather than a normal linear function. In this post, we will continue sharing on the Cost Function.
The Cost Function is important because it gives us the errors of our predictions and subsequently, is needed for our learning algorithm. Concretely, we like to minimise the errors of our predictions, i.e, to minimise the cost function. Ideally, if all our errors are zero, it is akin to playing a dart game in which all our darts would hit the bull’s-eye. On the other side of the argument, if our errors are very high, this means that our predicted values are missing all the true observed values, i.e., our darts are in general missing the bull’s-eye.
While we like to have zero errors when running our cost function with our hypothesised values (perfect prediction for every value), this might not be a good scenario given that it might lead to a phenomenon called “high variance”. We will touch more on this in later writings.
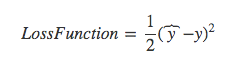
Going back to formulating the loss function, a typical loss function would be to minimise the sum of squared errors, i.e.

This function, however, can give rise to multiple local optimas during the optimization process, meaning your optimised solution might not be the most optimised (there is a chance there could be a better solution). Ideally, we want the optimised solution to be the global minimum, rather than the local minimum.


As seen in the above diagram, we might inadvertently initialise the parameters and optimise them to the local minimum without reaching the “true” global minimum. Therefore, the aforementioned loss function wouldn’t be ideal for us to use.
What could be our loss function then?
One loss function commonly used for logistics regression is this:


Do note I used cost and loss interchangeably but for those accustomed to Andrew Ng’s lectures, the “loss function” is for a single training example whereas the “cost function” takes the average over all training examples.
To see why this loss function makes sense: Assuming y = 1, and focusing on the top equation, -log(h⊖(x)), we want it to be very negative as this is a loss function (Recall that we want to minimise the loss function as an objective). As a result, h⊖(x) will be large. That said, recall that h⊖(x) is limited to the maximum value of 1 due to the Sigmoid function constraining the estimated hypothesised value between 0 to 1:
h⊖(x) = ŷ= σ(z)
Hence, when y=1, we have the loss function minimized to the extreme when ŷ = 1. A perfect prediction which has little or no loss/cost incurred.
Conversely, if y = 0, and focusing on the bottom part of the equation, -log(1- h⊖(x)). We like this to be very negative due to our loss minimisation objective. As a result, 1- h⊖(x) would be very large, and the corollary of that would be h⊖(x) being very small. However, recall that h⊖(x) is limited to the minimum value of 0 due to the Sigmoid function making the estimated hypothesised value between 0 to 1.
Hence, when y=0, we have the loss function minimized to the extreme when ŷ = 0. A perfect prediction which has little or no loss/cost incurred.
Their corresponding graphs will illustrate the above points:


As you can see from the left graph (y = -log(h⊖(x)), when y = 1, the cost goes to 0 when the hypothesized value is 1 and goes to infinity when the hypothesized value is close to 0.
In the similar vein, the right graph (y = -log(1 – h⊖(x)), when y = 0, the cost goes to 0 when the hypothesized value is 0 and goes to infinity when the hypothesized value is close to 1.
Combining both together in a neat equation will give you the cost function for the logistics regression with m training examples:


whereby i goes from 1 to m for m training examples.
In AI and Machine Learning , there will be many notations being thrown around and it would be helpful to get a sense of them.
When training the logistics regression model, we aim to find the parameters, “w” and “b” that minimises the overall cost function. In the next article, we will touch on the next important segment, Gradient Descent.
In numpy, we can code the Cost Function as follows:
import numpy as npcost = (-1/m) * np.sum(Y*np.log(A) + (1-Y)*(np.log(1-A)))
To explain:
- np.sum sums over the elements of the array (Y*np.log(A) + (1-Y)*(np.log(1-A)), which in this case would be sum over all the training examples. Read more here.
- np.log takes the natural log, element wise to the elements in the array. See more here.
- “*” takes the elements of one array and multiply them, element wise, to the elements of another array. This is not matrix multiplication, which has a shape requirement from both arrays: The number of the columns of the first array has to be equal to the rows of the second array.
I am immensely grateful to these sources:
https://www.cs.ubc.ca/labs/lci/mlrg/slides/non_convex_optimization.pdf
- https://www.internalpointers.com/post/cost-function-logistic-regression
- Andrew Ng’s lecture on Coursera: https://www.coursera.org/learn/neural-networks-deep-learning


